Rice diversity panel evaluated for agro-morphological diversity by multivariate analysis
Bạn đang xem bản rút gọn của tài liệu. Xem và tải ngay bản đầy đủ của tài liệu tại đây (279.38 KB, 7 trang )
<span class='text_page_counter'>(1)</span><div class='page_container' data-page=1>
<i><b>Int.J.Curr.Microbiol.App.Sci </b></i><b>(2017)</b><i><b> 6</b></i><b>(11): 3887-3901 </b>
3887
<b>Original Research Article </b>
<b>Rice Diversity Panel Evaluated for Agro-Morphological </b>
<b>Diversity by Multivariate Analysis </b>
<b>N. Vishnu Varthini1*, D. Sudhakar2, M. Raveendran2, S. Rajeswari1, </b>
<b>S. Manonmani1, Shalini Tannidi1, P. Balaji Aravindhan1, </b>
<b>Govindaraj Ponniah1, Karthika Gunasekaran1 and S. Robin1</b>
1
Centre for Plant Breeding and genetics, 2Centre for Plant Molecular Biology and
Biotechnology, Tamil Nadu Agricultural University, Coimbatore, Tamil Nadu, India
<i>*Corresponding author </i>
<i><b> </b></i> <i><b> </b></i><b>A B S T R A C T </b>
<i><b> </b></i>
<b>Introduction </b>
Rice is an indispensable staple food for half
of the world’s population. In countries where
rice is used as staple food, the per capita
consumption is very high ranging from 62 to
190 kg/year (Kaiyang <i>et al.,</i> 2008). It has the
second largest production after wheat with
over 503 million tonnes recorded in 2013.
While the demand for rice is rising up steadily
with steep increase in human population, the
land area available for rice production is
shrinking due to rapid urbanization and
changing life style. New rice cultivars that
combine high yield potential, resistance to
both biotic and abiotic stress and good grain
quality are urgently needed to meet future
consumer demands.
<i>International Journal of Current Microbiology and Applied Sciences </i>
<i><b>ISSN: 2319-7706</b></i><b> Volume 6 Number 11 (2017) pp. 3887-3901 </b>
Journal homepage:
Genetic diversity assessment for agro morphological traits in a population can be estimated
by different methods such as univariate and multivariate analysis. Multivariate analysis is
utilized for analyzing more than one variable at once. A diversed collection of 192
genotypes with traditional landraces and exotic genotypes from 12 countries was evaluated
for 12 agro- morphological traits by multivariate analysis which reveals the pattern of
genetic diversity and relationship among individuals. Twelve quantitative characters i.e.
plant height, leaf length, number of productive tillers, panicle length, number of filled
grains, spikelet fertility, days to 50% flowering; days to harvest maturity, grain length,
grain width, grain length width ratio, and single plant yield were measured. Multivariate
techniques such as UPGMA cluster analysis, principal component analysis and canonical
vector analysis was utilized to examine the variation and to estimate the relative
contribution of various traits for total variability. Analysis by UPGMA method had
clustered 192 genotypes into seven clusters. Principal component analysis had shown the
genetic diversity of the population panel. The cumulative variance of 80.56% of total
variation among 12 characters was explained by the first five axes. Canonical discriminant
analysis indicated that the first two functions accounted for more than 86% of total
variance and the traits such as days to 50% flowering, maturity, grain characters, panicle
length and plant height were identified as principal discriminatory characters. These
analyses have indicated the presence of variation in the population panel which can be
utilized for various crop improvement programs.
<b>K e y w o r d s </b>
Rice, Genetic
variation, Agro
morphological traits,
Multivariate analysis,
UPGMA, Principal
component analysis,
Canonical vector
analysis.
<i><b>Accepted: </b></i>
28 September 2017
<i><b>Available Online:</b></i>
10 November 2017
</div>
<span class='text_page_counter'>(2)</span><div class='page_container' data-page=2>
<i><b>Int.J.Curr.Microbiol.App.Sci </b></i><b>(2017)</b><i><b> 6</b></i><b>(11): 3887-3901 </b>
3888
Genetic diversity represents the heritable
variation within and between populations of
organisms. The success of plant breeding
depends on the availability of genetic
variation, knowledge about desired traits, and
efficient selection strategies that make it
possible to exploit existing genetic resource.
The pool of genetic variation within an
inter-mating population is the basis for selection as
well as for plant improvement.
Before exploiting a population for trait
improvement, it is necessary to understand the
magnitude of variability in the population
which is fundamental for genetic
improvement in all crop species. To develop
segregating population, genetic distance
estimates form the basis for selecting parental
combinations with sufficient genetic diversity
and for classifying germplasm into heterotic
groups for hybrid crop breeding. Population
Grouping can be based on geographical
origin, agro-morphological traits, pedigree
information, or molecular marker data (Liakat
Ali <i>et al.,</i> 2011).
Genetic distance estimates for population
grouping can be estimated by different
methods as it is crucial to understand the
usable variability existing in the population
panel. One of the approaches is to apply
multivariate analysis. Cluster analysis can
group cultivars and meaningful information of
genetic distance between genotypes and
clusters can be obtained. Genotypically
distant parents are able to produce higher
heterosis (Mian, 1989; Ghaderi <i>et al.,</i> 1979).
It is assumed that the maximum amount of
heterosis is manifested in cross combination
involving genotypes from the most divergent
cluster (Firoz <i>et al., </i>2008).
Statistical method of classification is usually
by multivariate methods as it has extensive
use in summarizing and describing the
inherent variation among crop genotypes.
Multivariate statistical tools include principal
component analysis (PCA), Cluster analysis
and discriminate analysis (Oyelola, 2004).
Principal component analysis (PCA) can be
used to uncover similarities between variable
and classify the cases (genotypes), while
cluster analysis on the other hand is
concerned with classifying previously
unclassified materials (Kaufman and
Rouseeuw, 2009). Canonical discriminant
analyses were used to determine the relative
contribution and linear associations among
the traits.
It can separate among-population effects from
within population effects by maximizing
discrimination among populations when
tested against the variation within populations
(Riggs, 1973; Tai, 1989).
Multivariate analysis has been used in various
crops <i>i.e.,</i> Rice (Sanni <i>et al.,</i> 2012,
Chakravorthy <i>et </i> <i>al.,</i> 2013), soybean
(Bhawana Sharma and Brijvirsingh, 2012),
coconut (Odewale <i>et al.,</i> 2012), safflower,
sorghum and oil palm to study the pattern of
variation. The study aimed to determine level
of germplasm variation and identify and
classify variation for grouping the accessions
by taking into account several characteristics
and relationship between them.
<b>Materials and Methods </b>
<b>Experimental material</b>
</div>
<span class='text_page_counter'>(3)</span><div class='page_container' data-page=3>
<i><b>Int.J.Curr.Microbiol.App.Sci </b></i><b>(2017)</b><i><b> 6</b></i><b>(11): 3887-3901 </b>
3889
Colombia, Indonesia, Philippines, Taiwan,
Uruguay, Venezuela and United States and 46
varieties and improved genotypes from
different states of India constitute the
population panel of 192 genotypes. For easy
identification and retrieval, each accession
was named as RG 1 to RG 192.
<b>Experimental site </b>
A set of 192 genotypes were grown in Paddy
Breeding Station, Department of Rice, Tamil
Nadu Agricultural University, India during
Rabi 2013. This area is situated at latitude of
11ºN and longitude of 77 ºE with clayey soil
of pH 7.8.
<b>Methods </b>
One hundred and ninety two genotypes were
transplanted 21 days after sowing as two
seedlings per hill in randomized complete
block design with a spacing of 20 X 20 cm.
Each plot per accession consisted of four rows
each 0.8 by 3.6 m long at a distance of 40 cm
between the plots. Normal cultural practices
were followed as per standard
recommendation.
Twelve quantitative characters were measured
according to methods in the descriptors for
rice <i>O. sativa</i> (IRRI, 1980). Variables
considered in the descriptive and multivariate
analyses were morphological (plant height,
leaf length, number of productive tillers,
panicle length, number of filled grains,
spikelet fertility), phenological (days to 50%
flowering and days to harvest maturity from
the day of seeding), and grain traits (grain
length, grain width, grain length width ratio,
and single plant yield).
<b>Statistical analysis </b>
The observations recorded on 12 traits were
statistically analyzed in SPSS16.0 to cluster
the genotypes based on genetic similarity.
Unweighted pair group method of average
linkage (UPGMA) constructed by SPSS16.0
was used to classify the accessions into
clusters. The PCA analysis reduces the
dimensions of a multivariate data to a few
principal axes, generates an Eigen vector for
each axis and produces component scores for
the characters (Sneath and Sokal, 1973; Ariyo
and Odulaja, 1991). Canonical discriminate
analysis measure the axis along which
variation between entries were maximum
(Rezai and Frey, 1990; Ariyo, 1993).
<b>Results and Discussion </b>
The maximum, minimum, sum, mean,
standard deviation (SD) and coefficient of
variation (CV) for the measured traits are
presented in table 2. The largest variation was
observed for number of productive tillers with
CV of 28.03 % followed by number of filled
grains per panicle (CV= 27), single plant
yield (23.19), leaf length (23.02), grain length
width ratio (22.16). Days to maturity has
shown the least variation with the CV of
9.74%.
The genotype RG1 has taken the longest days
for flowering as well as maturity. The taller
genotype is RG20 whereas RG111 has short
stature. RG183 has more number of
productive tillers but RG164 has higher single
plant yield.
Spikelet fertility ranges from 95.7% in RG131
to 54.2 in RG25. The accession with longest
grain was RG57 (10.5) and largest grain
width in RG160 (3.7) which is a bold grain
type. The slim grain type with lesser grain
width was RG95 (1.5) and shortest grain was
RG111 (5.8).
<b>Cluster analysis </b>
</div>
<span class='text_page_counter'>(4)</span><div class='page_container' data-page=4>
<i><b>Int.J.Curr.Microbiol.App.Sci </b></i><b>(2017)</b><i><b> 6</b></i><b>(11): 3887-3901 </b>
3890
Landraces has diffused across the different
clusters. 72 % of the landraces (62 landraces)
has amalgamated in cluster 2. Cluster 1,3,4,5
and 7 has the remaining landraces. Cluster 1
has two landraces RG1 (Mapillai samba) and
RG 106 (Katta samba). Cluster 7 has one
landrace RG164 (Thillainayagam). Cluster 3
has 7 landraces (RG4, RG12, RG33, RG42,
RG50, RG110andRG120). Nine landraces
(RG32, RG73, RG97, RG109, RG155,
RG163, RG168, RG179 and RG192) spread
across cluster 4. Cluster 5 has three landraces
(RG24, RG25 and RG44).
The population panel has 61 exotic genotypes
which has been clustered in group 2 (22
genotypes), group 4(29 genotypes) and each 2
genotypes in cluster 5 and 6. This panel also
has 47 improved genotypes and varieties from
different states of India. Majority of the
improved genotypes and varieties (51%) has
clustered in group 4. Remaining improved
genotypes and varieties has dispersed in
cluster 2 (13 genotypes), cluster 3(8
genotypes), cluster 5(1genotype) and cluster 6
(1 genotype).
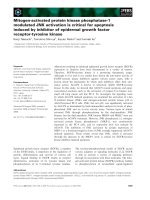
<b>Principal component analysis </b>
Principal component analysis has shown the
genetic diversity of the population panel. The
cumulative variance of 80.56% by the first
five axes with Eigen value of > 1.0 (Figure 1
and 2) indicates that the identified traits
within the axes exhibited great influence on
the phenotype of population panel (Table 3
and 4).
The different morphological traits contribute
for total variation calculated for each
component. For Component 1 which has the
contribution of Days to 50% flowering
(loadings -0.87), leaf length (0.78), plant
height (0.765), panicle length (0.637), days to
maturity (0.853) and number of filled grains
(0.352) for 28.46 % of the total variability.
For component 2, grain width (0.886) and
grain length width ratio (0.951) has
contributed 16.8 % of total variability.
Similarly spikelet fertility (0.771) and single
plant yield (0.542), grain length (0.81),
number of productive tillers (0.846) has
contributed for the total variation of 14.4%,
11.7% and 9.3% from component 3,
component 4 and component 5 respectively.
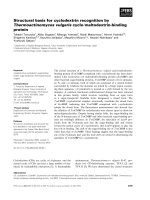
<b>Canonical Discriminant analysis </b>
Canonical discriminant analysis
simultaneously examines the differences in
the morphological variables and indicates the
relative contribution of each variable to
accession discrimination (Vaylay and van
Santen, 2002).
Quantitative variables were considered as
independent and the clusters identified by
cluster analysis as dependent variables. The
first four Discriminant functions were
statistically significant according to the
chi-square test at a probability of 0.01. Proper
values and the distribution of their variances
indicated that the first two functions
accounted for more than 86% of total
variance. Wilks’ lambda coefficients for these
two functions were precisely the lowest,
indicating an almost perfect discrimination
regarding the remaining functions. The
significant (<i>p</i>< 0.001) canonical correlation
between the accessions and the first canonical
variate (canonical correlation = 0.851) and
second canonical variate (canonical
correlation = 0.748) indicates that the
canonical variates can explain the
differentiation of the accessions.
</div>
<span class='text_page_counter'>(5)</span><div class='page_container' data-page=5>
<i><b>Int.J.Curr.Microbiol.App.Sci </b></i><b>(2017)</b><i><b> 6</b></i><b>(11): 3887-3901 </b>
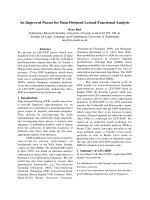
3891
canonical Discriminant function is dominated
by plant height, days to 50% flowering and
days to maturity (Table 5). Number of filled
grains per panicle, panicle length spikelet
fertility and grain length contribute for second
canonical Discriminant function. It is
therefore evident in the canonical
discrimination that the composition of the
accessions differs chiefly in days to 50%
flowering, maturity, grain characters, panicle
length and plant height. Centroids are
discriminant score for each group when the
variable means (rather than individual values
for each case) are entered into the function.
The Proximity of group centroids indicates
the errors in classification. The distance
between group centroids for different clusters
is far away which indicates the precision of
classification level (Figure 3).
<b>Fig.1</b> Scattered Diagram of first two components explaining the diversity of genotypes
</div>
<span class='text_page_counter'>(6)</span><div class='page_container' data-page=6>
<i><b>Int.J.Curr.Microbiol.App.Sci </b></i><b>(2017)</b><i><b> 6</b></i><b>(11): 3887-3901 </b>
3892
<b>Fig.3</b> Group centroids for different clusters is far away which indicates the precision of
classification level
<b>Table.1</b> Genotypes information with clustering pattern
G.
NO
Genotypes Parentage Origin Cluste
r
group
RG1 Mapillai samba Landrace Tamil Nadu, India 1
RG10
6
Katta samba Landrace Tamil Nadu, India 1
RG2 CK 275 CO50 X KAVUNI Tamil Nadu, India 2
RG3 Senkar Landrace Tamil Nadu, India 2
RG6 CHIR 5 Improved chinsurah West Bengal 2
RG7 Kudaivazhai Landrace Tamil Nadu, India 2
RG9 Kuruvaikalanjiyam Landrace Tamil Nadu, India 2
RG10 Nava konmani Landrace Tamil Nadu, India 2
RG11 CHIR 10 Improved chinsurah West Bengal 2
RG13 CHIR 2 Improved chinsurah West Bengal 2
RG15 Palkachaka Landrace Tamil Nadu, India 2
RG16 Thooyala Landrace Tamil Nadu, India 2
RG17 Chivapuchithiraikar Landrace Tamil Nadu, India 2
RG18 CHIR 11 Improved chinsurah West Bengal 2
RG19 Koolavalai Landrace Tamil Nadu, India 2
</div>
<span class='text_page_counter'>(7)</span><div class='page_container' data-page=7>
<i><b>Int.J.Curr.Microbiol.App.Sci </b></i><b>(2017)</b><i><b> 6</b></i><b>(11): 3887-3901 </b>
3893
RG21 Mohini samba Landrace Tamil Nadu, India 2
RG23 Koombalai Landrace Tamil Nadu, India 2
RG26 Rascadam Landrace Tamil Nadu, India 2
RG27 Muzhikaruppan Landrace Tamil Nadu, India 2
RG28 Kaatukuthalam Landrace Tamil Nadu, India 2
RG29 Vellaikattai Landrace Tamil Nadu, India 2
RG30 Poongar Landrace Tamil Nadu, India 2
RG31 Chinthamani Landrace Tamil Nadu, India 2
RG35 CK 143 CO50 X KAVUNI Tamil Nadu, India 2
RG36 Kattikar Landrace Tamil Nadu, India 2
RG37 Shenmolagai Landrace Tamil Nadu, India 2
RG38 Velli samba Landrace Tamil Nadu, India 2
RG39 Kaatuponni Landrace Tamil Nadu, India 2
RG40 kakarathan Landrace Tamil Nadu, India 2
RG41 Godavari samba Landrace Tamil Nadu, India 2
RG45 RPHP 105 Moirangphou MANIPUR 2
RG47 Machakantha Landrace Orissa, India 2
RG48 Kalarkar Landrace Tamil Nadu, India 2
RG49 Valanchennai Landrace Tamil Nadu, India 2
RG58 Kodaikuluthan Landrace Tamil Nadu, India 2
RG60 Rama kuruvaikar Landrace Tamil Nadu, India 2
RG61 Kallundai Landrace Tamil Nadu, India 2
RG62 Purple puttu Landrace Tamil Nadu, India 2
RG63 IG 71(EC 728651-
117588)
TEPI BORO::IRGC 27519-1 IRRI, Philippines 2
RG64 Ottadaiyan Landrace Tamil Nadu, India 2
RG65 IG 56 (EC 728700-
117658
BICO BRANCO Brazil 2
RG66 Jeevan samba Landrace Tamil Nadu, India 2
RG70 Karthi samba Landrace Tamil Nadu, India 2
RG72 Aarkadukichili Landrace Tamil Nadu, India 2
RG76 Mattakuruvai Landrace Tamil Nadu, India 2
RG77 Karuthakar Landrace Tamil Nadu, India 2
RG78 RPHP 165 Tilakkachari West Bengal 2
RG79 Manavari Landrace Tamil Nadu, India 2
RG82 Thooyamalli Landrace Tamil Nadu, India 2
RG84 Velsamba Landrace Tamil Nadu, India 2
RG85 RPHP 104 Kasturi (IET 8580) UTTARKHAND 2
RG88 Saranga Landrace Tamil Nadu, India 2
RG90 IG 61(EC 728731-
117696)
CRIOLLO LA FRIA Venezuela 2
RG91 IG 23(EC 729391-
121419)
MAHA PANNITHI::IRGC
51021-1
IRRI, Philippines 2
RG93 uppumolagai Landrace Tamil Nadu, India 2
RG94 Karthigai samba Landrace Tamil Nadu, India 2
RG95 Jeeraga samba Landrace Tamil Nadu, India 2
RG10
0
IG 7(EC 729598-
121648)
VARY MAINTY::1RGC 69910-1 IRRI, Philippines 2
RG10
2
</div>
<!--links-->
The effect of inactivation for C.parvum by Pulse lamp
- 4
- 510
- 0


.push({});</script> </div> </div> </div> <div class="vf_link_relate px-2 my-2"> <h2 class="vf_doc_relate text-2xl font-bold my-4">Tài liệu liên quan</h2> <ul class="grid grid-cols-12 gap-2"> <li class="col-span-6 md:col-span-2"> <div class="card-doc " onclick="actionDocRelated(this)"> <a class="card-doc-img" href="https://text.123docz.com/document/559247-the-effect-of-inactivation-for-c-parvum-by-pulse-lamp.htm" title="The effect of inactivation for C.parvum by Pulse lamp"> <i class="icon i_type_doc i_type_doc2"></i> <img class="lazy" src="data:image/gif;base64,R0lGODlhAQABAIAAAP///wAAACH5BAEAAAAALAAAAAABAAEAAAICRAEAOw==" data-src="https://media.store123doc.com/images/document/13/pt/by/medium_bye1378346898.jpg" width="124" height="179" alt="The effect of inactivation for C.parvum by Pulse lamp" onerror="this.src=)