Production modeling
Bạn đang xem bản rút gọn của tài liệu. Xem và tải ngay bản đầy đủ của tài liệu tại đây (988.49 KB, 6 trang )
Proceedings of the International MultiConference of Engineers and Computer Scientists 2008 Vol II
IMECS 2008, 19-21 March, 2008, Hong Kong
Machine Layout Evaluation for Laminated Bamboo
Manufacturing by Computer Simulation
N. Sangsai, V. Laemlaksakul
Abstract—This research was to select the optimal machine
layout for laminated bamboo manufacturing by computer
simulation. The laminating process was to cut bamboo trunk as
laminated piece. This process was important to total total time of
production line so the computer simulation was applied to run
each machine layout alternatives and gather the decided
parameters. Production rate (pieces/day), total time, WIP and
wait time were compared for making decision. The optimal
machine layout had Production rate at 12,120 12,390 laminated
pieces/day and production line efficiency at 89.32%.
KeyWords—Laminated
Simulation
Bamboo,
Machine
Layout,
I. INTRODUCTION
Currently, the manufacturing system has rapidly changed.
In the past, the market demand was unlimited and there were
not too various product requirements. This was called “Mass
Production”. The machine layout was then settled on products
having high demand. However, the market demand has turned
up side down at which customers require more variety of
products and less demand. This is called “Mass
Customization”. The size of products must be determined in
“Batch” in order to be flexible for production. Clearly, the
manufacturing systems must adapt to “Flexible Manufacturing
System (FMS)”. FMS is wellsuited for Mass Customization
era because it can manufacture various products for small or
medium batch size and for short time. The machine layout is
an important factor for FMS because it can directly help
production line less total time, work in process (WIP) and set
up time. Finally, the business can enhance potential
competitiveness and customer satisfaction [1].
The machine layout is based on 2 key parameters that are
(1) the variety of products and (2) the quantity of products. If
the customer requirements tend to be more various products
but less quantity demand, the product layout or cellular
manufacturing system (CM) should be considered [2].
Irani [3] applied production flow analysis to machine
layout. McAuley [4] used similarity coefficient value given by
machine and product matrix to solve problems. King [5] and
Rajamani [6] presented the developed matrix methodology for
solving machine layout problems by considering weight
scores for each row and column. Then the weight scores were
ranked from large to small in order to group related products
or machines. If the customer requirements tend to be less
various products but more quantity demand, the process layout
or production line system should be applied. There are also
some factors to be concerned such as line balancing and
economy.
Thailand has long produced bamboo furniture. Most designs
are built in roundshape styles. After that the surface finishing
are later done such as painting, coating.
The traditional bamboo furniture design only assembled the
round shape stem bamboo together as shown in Figure 1.
There was no any processing on bamboo. This could limit the
styles or designs of bamboo furniture. The new bamboo
furniture design turns to use the laminated bamboo instead as
shown in Figure 2. The laminated bamboo can help designing
furniture more styles and standardized. This research was to
design the appropriate machine layout for laminated bamboo
manufacturing.
Fig. 1 The traditional bamboo furniture design
Manuscript received December 30, 2007. This research was a part of a
research project titled “Development of Laminated Bamboo Furniture
Manufacturing” supported by King Mongkut’s University of Technology
North Bangkok, Thailand (the fiscal year 2007) under code: 5003110525032.
V. Laemlaksakul is an Associate Professor with the Department of
Industrial Engineering Technology, King Mongkut’s University of
Technology North Bangkok, Bangsue, Bangkok 10800 Thailand
(corresponding author phone: +6629132500; fax: +6625874356; email:
vcl@ kmitnb.ac.th).
N. Sangsai is a lecturer with the Department of Mechanical Engineering
Technology, King Mongkut’s University of Technology North Bangkok,
Bangsue, Bangkok 10800 Thailand (email: )
Fig. 2 The modern bamboo furniture design
ISBN: 978-988-17012-1-3
IMECS 2008
Proceedings of the International MultiConference of Engineers and Computer Scientists 2008 Vol II
IMECS 2008, 19-21 March, 2008, Hong Kong
II. M ETHODOLOGY
Decided factors used for selecting the best machine layout
for laminated bamboo manufacturing were based on these
criteria; (1) production rate, (2) total time, (3) WIP and
(4) wait time. The computer simulation was then constructed
to compare each machine layout design. The more details for
computer simulation are described in next section.
A. Modeling and Simulation
Preliminary step for laminated bamboo manufacturing study
was to collect possible data related to manufacturing. The pre
processes were as follows; (1) bamboo surface finishing for
cutting in laminated specimen (width x length x thickness) (2)
soaking all specimen in boron compound for 24 hours [7].
Bamboo
splits
Remove
2 sides
M1
2 nd trimmed
to width
M4
M2
1 st trimmed
to width
M3
Treated with
antiinsects
M5
(a)
Bamboo
splits
1 st trimmed
to width
M1
Table 1
Manufacturing process for bamboo strip
Bamboo Process
Splitting
Planning to
thickness
2 nd trimmed
to width
Description
M4
Remove
2 sides
M2
Planning to
thickness
M3
Treated with
antiinsects
M5
(b)
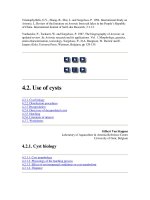
Fig. 3 Machine Layout (a) line A and (b) line B
Remove 2 sides
Planning to thickness
1 st trimmed to width
B. Input Modeling and Data Analysis
From the preliminary step performed, the related data for
simulation were as follows; (1) the original bamboo thickness
before surface finishing (the bamboo thickness are different
depending on its diameter) and (2) processing time varying
with its thickness. All data were statistically analyzed to find
its distribution and summarized in Table 2 and 3.
Table 2
The statistical distribution for each processing time in line A
nd
2 trimmed to width
Bamboo strip
From preliminary step, the complicated tasks for machine
layout simulation were (1) surface finishing and (2) cutting
into laminated pieces. The outline manufacturing flow for line
A and B is shown in Figure 3.
The ARENA software was used to construct the simulation
model for line A and B [8]. The production rate, total time,
WIP and wait time were key factors to decide which machine
layout was best appropriate.
Process
Thickness before
processing
Remove 2 sides
Planning to
thickness
(12 mm. to 4 mm.)
Trimmed to
width
Treated with
antiinsects time
ISBN: 978-988-17012-1-3
Statistical Distribution
8 + ERLA(0.996, 3): mm.
Setup time 10 min / lot
7 + LOGN(4.39, 4.61) : Sec./pieces
8 + ERLA(1.61, 2) : Sec./pieces
Setup time 5 min / lot
NORM(7.57, 1.94) : Sec./pieces
7 + ERLA(1.78, 2) : Sec./pieces
4 + ERLA(0.788, 5)) : Sec./pieces
NORM(9.82, 1.61) : Sec./pieces
4 + WEIB(7.68, 1.7) : Sec./pieces
NORM(18.3, 2.79) : Sec./pieces
16 + GAMM(4.18, 1.39) : Sec./pieces
14 + GAMM(0.973, 6.49) : Sec./pieces
17 + EXPO(3.45) : Sec./pieces
Setup time 3 min / lot
20 + 40 * BETA(0.567, 1.86):
Sec./pieces
12 + LOGN(5.61, 3.39) Sec./pieces
Constant 24 : hr.
IMECS 2008
Proceedings of the International MultiConference of Engineers and Computer Scientists 2008 Vol II
IMECS 2008, 19-21 March, 2008, Hong Kong
Table 3
The statistical distribution for each processing time in line B
Process
Thickness before
processing
1 st Trimmed to
width
Remove 2 sides
Planning to
thickness
(12 mm. to 4 mm.)
2 nd trimmed to
width
Treated with
antiinsects time
Statistical Distribution
8 + ERLA(0.996, 3): mm.
Setup time 20 min / lot
12 + EXPO(16.4): Sec./pieces
Setup time 3 min / lot
NORM(33.8, 12.6): min.
Setup time 5 min / lot
5 + LOGN(6.88, 6.41)) : Sec./pieces
7 + ERLA(2.46, 2) : Sec./pieces
8 + 28 * BETA(0.566, 2.55) :
Sec./pieces
6 + LOGN(7.55, 5.98)) : Sec./pieces
6 + LOGN(7.55, 5.98) : Sec./pieces
7 + LOGN(3.9, 3.76) : Sec./pieces
5 + LOGN(2.06, 1.52) : Sec./pieces
3 + ERLA(1.15, 4) : Sec./pieces
3 + 8 * BETA(2.52, 2.32) : Sec./pieces
4 + GAMM(3.04, 1.47) : Sec./pieces
5 + LOGN(3.56, 2.35) : Sec./pieces
Setup time 3 min / lot
12 + ERLA(4.54, 2) : Sec./pieces
NORM(19.1, 4.5): Sec./pieces
Constant 24 : hr.
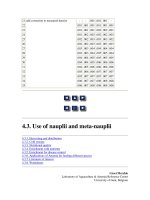
C. Model Verification and Validation
The Verification and Validation (V&V) for new production
was very difficult because there was no existed production line
to compare so the model was tested by running simulation as
many times as possible (Figure 4). Furthermore, the data from
experiences and the adjacent production lines can be helpful
for V&V.[2]
Fig. 4 The simulation program on V&V step
ISBN: 978-988-17012-1-3
D. Output Modeling
The output from running the simulation for each machine
layout design is production rate , total time, WIP and
wait time. These factors were considered to compare the
efficiency of each layout. The efficiency of each layout was
such as the WIP area, the maximum machine Production rate
and the bottlenecks of production line. When the real machine
layout is implemented, the efficiency of each layout will be an
important criterion to decide which layout will be the most
appropriate.
III. RESULTS
The simulation time of each machine layout was run by 30
consecutive days and each simulation run was performed 50
replications. After that the output of each machine layout was
pairwised and tested the different by ttest ( a = 0. 05 ). The
summarized data of each machine layout is shown in Table 3
and 4.
A. Production Lot Size
Simulation was run to find the optimal lot size by comparing
the production line A and B. Small lot size (150 – 300
pieces/lot) yields the production rate more than large lot size
(500 – 2,000 pieces/lot). Production rate from line B is
higher than from line A by 5.96% but lower than from line B
by 5.71% when lot size is increased to 2,000 pieces/lot.
B. Bottlenecks of production line.
In case of bottleneck, the average utilization of each
machine is of interest to consider which machine or
production line is in trouble.
· From production line A, there are 2 machines showing
bottlenecks that are M1 and M2. The average utilization is
100% and 95% respectively. These machines are in remove 2
sides and planning to thickness processes because these
machines can cut the bamboo size only one at a time. If the
machine can improve as progressive cutting, its total time will
definitely decrease. This points the guidelines for further
improving.
· From production line B, there are 2 bottleneck machines
that are M1 and M3. The average utilization is 100% and 92%
respectively. These machines are in trimmed to width and
planning to thickness processes as same as production line A.
The work in process of production line B is less than of
production line A so the production rate is also high.
C. Work in process / Total time/ Wait time
Simulation was run at different lot sizes 150, 200, 300,
500, 1,000, 1,300, 1,500 and 2,000 pieces per lot to compare
work in process, total time and waiting time. Production line B
yields less work in process total time and waiting time than
production line A by 1.51%, 10.63% and 17% respectively.
When considering small lot size (< 200 pieces/lot), work in
process, total time and waiting time from production line B
are less than from production line A by 1.51% 81.93% and
105.30% respectively. The optimal lot size between 100 – 200
pieces will benefit to the process.
IMECS 2008
Proceedings of the International MultiConference of Engineers and Computer Scientists 2008 Vol II
IMECS 2008, 19-21 March, 2008, Hong Kong
Production rate (pieces/day)
Production rate (pieces/day)
Lot
Fig. 5 Production rate (pieces/day) at different lot sizes of
production line A
Total time
Lot
Fig. 8 Production rate (pieces/day) at different lot sizes of
production line B
Total time
Lot
Fig. 6 Total time at different lot sizes of production line A
Wait time
Wait time
Lot
Fig. 7 Waiting time at different lot sizes of production line A
ISBN: 978-988-17012-1-3
Lot
Fig. 9 Total time at different lot sizes of production line B
Lot
Fig. 10 Waiting time at different lot sizes of production line B
IMECS 2008
Proceedings of the International MultiConference of Engineers and Computer Scientists 2008 Vol II
IMECS 2008, 19-21 March, 2008, Hong Kong
Table 4
Work in process and utilization of machines in line A
Lot
150
200
300
500
1000
1300
1500
2000
WIP
(pieces)
7,934
10,578
15,868
26,446
52,892
68,760
79,338
105,784
M1
1
1
1
1
1
1
1
1
Utilization
M2
M3
0.991
0.275
0.988
0.268
0.983
0.262
0.972
0.247
0.944
0.223
0.927
0.211
0.916
0.194
0.889
0.166
Table 7
Work in process and utilization of machines in line B
M4
0.161
0.159
0.153
0.148
0.127
0.124
0.112
0.096
Table 5
KPI of each lot size in line A (Adding more machines in
bottlenecks)
Lot
150
200
300
500
1000
1300
1500
2000
Total time
Wait time
WIP.
Prod. rate
(min./pieces)
(min./pieces)
(pieces)
(pieces/day)
48.041
64.007
81.079
98.003
117.401
126.355
133.795
146.442
39.402
52.63
64.277
69.997
62.036
54.519
51.065
36.31
8,669
11,559
17,338
28,897
57,794
75,132
86,691
115,588
12,390
12,327
12,120
11,467
10,033
9,143
8,850
7,400
Table 6
Utilization of machines in line A (Adding more machines in
bottlenecks)
Lot
150
200
300
500
1000
1300
1500
2000
M1
Utilization
M2
M3
M4
1.00
1.00
1.00
1.00
1.00
1.00
1.00
1.00
0.99
0.98
0.97
0.96
0.91
0.89
0.87
0.83
0.33
0.32
0.31
0.29
0.25
0.23
0.22
0.19
0.54
0.53
0.51
0.49
0.44
0.42
0.39
0.34
D. Productivity Improvement
The simulation run for laminated bamboo manufacturing can
benefits as;
· Combining the processes
The right and left cutting process can be combined into
one process in order to use the same machine. The efficiency
of production line A increased from 57.93% to 77.23%.
· Adding more machines in Bottlenecks
When adding more machines in production line A and B
(by simulation approach), the efficiency of production line A
and B is higher from 57.93% to 66.26% and 79.32% to
86.24% respectively. Furthermore, production rate of each
production line is at 93.27% and 89.32% respectively.
ISBN: 978-988-17012-1-3
Lot
150
200
300
500
1000
1300
1500
2000
WIP
(pieces)
10,421
15,632
26,053
52,106
67,738
78,159
104,212
M1
1
1
1
1
1
1
1
Utilization
M2
M3
0.950
0.982
0.962
0.973
0.960
0.957
0.928
0.916
0.894
0.891
0.892
0.875
0.878
0.834
M4
0.395
0.383
0.367
0.328
0.303
0.293
0.249
Table 8
KPI of each lot size in line B (Adding more machines in
bottlenecks)
Lot
150
200
300
500
1000
1300
1500
2000
Total time
Wait time
WIP.
Prod. rate
(min./pieces)
(min./pieces)
(pieces)
(pieces/day)
57.706
77.609
96.733
119.066
128.607
135.196
147.615
45.822
60.171
67.966
62.192
54.665
50.421
33.557
12,814
19,221
32,035
64,069
83,290
96,104
128,138
13,273
13,100
12,417
10,600
9,663
9,100
7,000
Table 9
Utilization of machines in line B (Adding more machines in
bottlenecks)
Lot
150
200
300
500
1000
1300
1500
2000
M1
1.00
1.00
1.00
1.00
1.00
1.00
1.00
Utilization
M2
M3
0.94
0.98
0.96
0.97
0.95
0.94
0.92
0.89
0.91
0.85
0.91
0.83
0.88
0.78
M4
0.78
0.75
0.72
0.62
0.58
0.53
0.45
IV. C ONCLUSIONS
Laminated bamboo manufacturing process is important to
the production line and total time. The efficient machine
layout for this process will improve production rate and
reduce manufacturing cost. Computer simulation was
considered to help making decision which machine layout
alternatives will be the most efficient or how many machines
should have in the selected layout. The important parameters
given by computer simulation in this research were
production rate, total time, WIP and wait time. The machine
layout B was the best following to all parameters. The new
laminated bamboo manufacturing process should rely on
machine layout B.
IMECS 2008
Proceedings of the International MultiConference of Engineers and Computer Scientists 2008 Vol II
IMECS 2008, 19-21 March, 2008, Hong Kong
ACKNOWLEDGMENT
Authors thank the College of Industrial Technology, King
Mongkut’s University of Technology North Bangkok,
Thailand for supporting the experimental equipments to
conduct this research.
REFERENCES
[1] J. Yang, R. H. Deane, “Setup time reduction and competitive advantage
in a closed manufacturing cell,” European Journal of Operational
Research, 69, 1993, pp. 413 – 423.
[2] E. F. Watson, R. P. Sadowski, “Developing and analyzing flexible cell
systems using simulation,” Proceeding of the 1994 Winter Simulation
Conference,1994, pp. 978 – 985.
ISBN: 978-988-17012-1-3
[3] S. A. Irani, Handbook of Cellular Manufacturing Systems. New York:
John Wiley & Sons Inc, 1999.
[4] J. McAuley “Machine grouping for efficient production,” The production
engineer ,51(2) , 1972 , pp.5357.
[5] J. R. King, “Machinecomponent grouping in production flow analysis,”
International Journal of Production Research, 8, 1980, pp. 213 – 237.
[6] D. Rajamani, N. Singh, Cellular manufacturing systems. New York:
Chapman & Hall, 1996.
[7] V. Laemlaksakul, S. Kaewkuekool, “Laminated bamboo materials for
furniture–A systematic approach to innovative product design,”
WSEAS Trans. on. Advances in Engineering Education, 5 (3), 2006, pp
435450.
[8] W. D. Kelton, P. S. Randall, D. A. Sadowski, Simulation with Arena.
McGraw – Hill. Inc, 1998.
IMECS 2008