Impact assessment of regulation works in the thai binh river downstream
Bạn đang xem bản rút gọn của tài liệu. Xem và tải ngay bản đầy đủ của tài liệu tại đây (2.04 MB, 91 trang )
MINISTRY OF EDUCATION AND TRAINING
MINISTRY OF AGRICULTURE AND RURALDEVELOPMENT
THUYLOI UNIVERSITY
IMPACT ASSESSMENT OF REGULATION WORKS
IN THE THAI BINH RIVER DOWNSTREAM
Nguyen Vinh Nguyen
MSc Thesis on Integrated Water Resources Management
November, 2017
MINISTRY OF EDUCATION AND TRAINING
MINISTRY OF AGRICULTURE AND RURAL DEVELOPMENT
THUYLOI UNIVERSITY
Nguyen Vinh Nguyen
IMPACT ASSESSMENT OF REGULATION WORKS
IN THE THAI BINH RIVER DOWNSTREAM
Major: Integrated Water Resources Management
THESIS OF MASTER DEGREE
Supervisors:
1. Assoc. Prof. Dr. Nguyen Mai Dang
2. Assoc. Prof. Dr. Ngo Van Quan
This research is done for the partial fulfilment of requirement for
Master of Science Degree at Thuyloi University
(This Master Programme is supported by NICHE – VNM 106 Project)
November, 2017
DECLARATION
I hereby certify that the work which is being presented in this thesis entitled, “Impact
assessment of Regulation works in the Thai Binh river downstream” in partial
fulfillment of the requirement for the award of the Master of Science in Integrated
Water Resources Management, is an authentic record of my own work carried out
under supervision(s) of Assoc. Prof. Dr. Nguyen Mai Dang and Assoc. Prof. Dr. Ngo
Van Quan.
The matter embodied in this thesis has not been submitted by me for the award of any
other degree or diploma.
Date: 19/11/2017
Signature
Nguyen Vinh Nguyen
i
Abstract
The Thai Binh River System’s downstream is a major economic region which is
located in the Red River Delta including Hai Phong city and Thai Binh province.
Currently, water distribution here is significantly unreasonable for the downstream
water stakeholders.
Therefore, a research regarding current water allocation assessment need and
has to be conducted in order to find out appropriate solutions for solving and
surmounting the issues. In this study, the MIKE 11 model was used to simulate the
recent status of the system and predict the water distribution according to some
proposed scenarios based on the system operation in the future.
The study determined the existing problems and troubles in water distribution
and water use in the Thai Binh River downstream. Accordingly, the impact of
structural measures proposed in this study on flow changing also was analyzed in
details. In addition, the study illustrated that the flow discharge of rivers in the system
will be changed significantly after building the regulated structure works. In addition,
the study proposed some alternatives aiming to strengthen the management of system
operation as well as water use in the downstream of Thai Binh River.
Key words: Red River Basin, Thai Binh River, MIKE 11 model, flow regime
ii
Acknowledgement
I would like to give a big thank to all people who have supported and assisted
me during my master thesis research. Thanks for their support, encouragement and
guidance that allowed me to complete this study in time.
Especially, I would like to express my appreciation to Assoc. Dr. Nguyen Mai
Dang and Assoc. Dr. Ngo Van Quan for their unlimited encouragement, guidance,
comments and technical supports as well as the thesis writing process from the
beginning of this thesis research.
I wish to thank Dr. Ilyas Masih, Assoc. Dr. Nguyen Thu Hien and Assoc. Dr.
Ngo Le An for their feedbacks, references and support on the proposal process.
I also want to thank to all instructors and staff of Thuy Loi University who have
helped me a lot during the master course.
I would like to give my appreciation to Dr. Ho Viet Cuong, Msc. Nguyen Thi
Ngoc Nhan, Msc. Nguyen Van Bach and Mr. Phan Van Thanh who was willing to
help me with modelling application in the thesis.
I also would like to thank the National Key Laboratory of River and Coastal
Engineering and Institute of Vietnam Academy for Water Resources for their
information and useful data input.
Last but not least, I want to take this opportunity to show my appreciation to my
family, friends for their inspiration and support throughout my life; this research is
simply impossible without you.
iii
Contents
DECLARATION ............................................................................................................. i
Abstract .......................................................................................................................... ii
1. INTRODUCTION .....................................................................................................6
1.1. Overview ...................................................................................................................6
1.2. Problem statement ...................................................................................................8
1.2.1 Objectives of the study ...................................................................................9
1.2.2 Research questions .........................................................................................9
1.2.3 Thesis overview ............................................................................................10
2. LITERATURE REVIEW .......................................................................................11
2.1. Overview of hydraulic modeling ...........................................................................11
2.2. Mike 11 Model .......................................................................................................13
2.3. Related studies .......................................................................................................15
3 STUDY AREA .........................................................................................................18
3.1. Description of the study area.................................................................................18
3.1.1 Geography and River Network .....................................................................18
3.1.2 Climatic characteristics ................................................................................20
3.1.3 Hydrological characteristics .........................................................................23
3.1.4 Tide and tidal effects in the river mouth ......................................................26
3.2. Water demand ........................................................................................................27
3.2.1 Water demand for agriculture .......................................................................27
3.2.2 Water demand for aquaculture .....................................................................28
3.2.3 Water demand for industry ...........................................................................29
3.2.4 Water demand for domestic..........................................................................29
3.3. Water exploitation and utilization issues ..............................................................30
4. METHODOLOGY ..................................................................................................32
4.1. The MIKE 11 Model ..............................................................................................33
4.1.1 Governing Equations ....................................................................................33
4.1.2 Methods used in the performance evaluation ...............................................34
4.2. Mike 11 Model Set-up............................................................................................35
4.2.1. Input data .....................................................................................................35
4.2.1.2 Boundary conditions ..................................................................................37
4.2.1.3 Cross-sections ............................................................................................38
1
4.2.1.4 Meteorological and hydrological data .......................................................39
4.3. Modeling calibration .............................................................................................39
4.3.1. Step by step..................................................................................................40
4.3.2 Initial conditions setup .................................................................................40
4.3.3 Calibrating the hydraulic parameters ...........................................................40
4.3.4. Modeling calibration in flood season ..........................................................41
4.3.4. Modeling calibration in dry season .............................................................44
4.4. Modeling validation ...............................................................................................48
4.4.1 Modeling validation in flood season ............................................................48
4.4.2 Modeling validation in dry season ...............................................................49
4.5. Proposed regulation works and scenarios ............................................................52
4.5.1. Proposed regulation works ..........................................................................52
4.5.2. Simulated Scenarios ....................................................................................53
5. RESULTS AND DISCUSSIONS............................................................................54
5.1. Scenario results simulated in August 1996 ..........................................................55
5.2. Scenario results simulated in January 2007 ........................................................62
6. CONCLUSIONS AND RECOMMENDATIONS ................................................72
6.1. Conclusions ............................................................................................................72
6.2. Recommendations for further researches ............................................................73
APPENDIX...................................................................................................................77
2
List of figure
Figure 1.1 Thai Binh River downstream area .................................................................8
Figure 2.1 Simulation interface file of Mike 11 (HD Module) .....................................15
Figure 3.1: Map of the study area focus on two districts: Vinh Bao and Tien Lang ....18
Figure 4.1: The research flowchart ................................................................................32
Figure 4.2: Schematic of network and reservoirs considered in the Red River basin...36
Figure 4.3: River network for simulation by Mike 11 model. ......................................37
Figure 4.4. Model calibration process ...........................................................................39
Figure 4.5: Hydraulic parameters interface ...................................................................41
Figure 4.6: The observed and simulated water levels for the 1996 flood event at Ha
Noi station in the case of calibration .............................................................................42
Figure 4.7: The observed and simulated water level in Van Uc River in 1/2006 –
Trung Trang Station ......................................................................................................45
Figure 4.8: The observed and simulated water level in Duong River in January 2006 –
Thuong Cat Station ........................................................................................................45
Figure 4.9: The observed and simulated hydrographs at Son Tay Station ....................48
Figure 4.10: The observed and simulated hydrographs at Ha Noi Station in January
2007 ...............................................................................................................................49
Figure 4.11: The observed and simulated hydrographs at Tra Ly Station ....................50
in January 2007 ..............................................................................................................50
Figure 4.12: Structure of the regulated dam in Moi River ............................................52
Figure 5.1. The locations of selected cross-sections .....................................................54
Figure 5.2 Actual water level at the selected points ......................................................55
Figure 5.3 Actual discharge at the selected points ........................................................55
Figure 5.4: Simulated water level of PA1 .....................................................................56
Figure 5.5: Simulated discharge of PA1........................................................................56
Figure 5.6: Simulated water level of PA2 .....................................................................57
Figure 5.7 Simulated discharge of PA2 .........................................................................57
Figure 5.8: Simulated water level of PA3 .....................................................................58
Figure 5.9: Simulated discharge of PA3........................................................................58
Figure 5.10: Simulated water level of PA1+2 ...............................................................59
Figure 5.11: Simulated discharge of PA1+2 .................................................................59
Figure 5.12: Simulated water level of PA1+3 ...............................................................60
Figure 5.13: Simulated discharge of PA1+3 .................................................................60
3
Figure 5.14: Simulated water level of PA1+2+3...........................................................61
Figure 5.15: Simulated discharge of PA1+2+3 .............................................................61
Figure 5.16: Actual water level at the selected points ...................................................62
Figure 5.17: Actual discharge at the selected points ....................................................62
Figure 5.18: Simulated water level of PA1 ...................................................................63
Figure 5.19: Simulated discharge of PA1......................................................................63
Figure 5.20: Simulated water level of PA2 ...................................................................64
Figure 5.21 Simulated discharge of PA2 .......................................................................64
Figure 5.22: Simulated water level of PA3 ...................................................................65
Figure 5.23: Simulated discharge of PA3......................................................................65
Figure 5.24: Simulated water level of PA1+2 ...............................................................66
Figure 5.25: Simulated discharge of PA1+2 .................................................................66
Figure 5.26: Simulated water level of PA1+3 ...............................................................67
Figure 5.27: Simulated discharge of PA1+3 .................................................................67
Figure 5.28: Simulated water level of PA1+2+3...........................................................68
Figure 5.29: Simulated discharge of PA1+2+3 .............................................................68
4
List of table
Table 2.1 Comparison of different One-Dimensional (1D) models ..............................12
Table 3.1. Monthly average temperature of the year at stations ...................................21
Table 3.2 Typical average monthly rainfall at stations .................................................22
Table 3.3 Typical monthly average wind speed at three stations ..................................23
Table 3.4: Total water used for cultivation and livestock in year 2012 ........................28
Table 3.5: Water demand of cultivation in period of 2020 and 2030 ...........................28
Table 3.6. Water demand of livestock in the period of 2020 and 2030 ........................28
Table 3.7 Water demand of aquaculture in 2012 ..........................................................29
Table 3.8 Water demand of aquaculture in the period of 2020 và 2030 .......................29
Table 3.9 Current status of water use of industrial zones .............................................29
Table 3.10 Water supply for domestic in Tien Lang and Vinh bao districts ................30
Table 3.11 Water demand of domestic in the period of 2020 and 2030 .......................30
Table 4.1: The upstream and downstream boundary of the model setup ......................39
Table 4.2: Calibrated Manning values of the river system............................................43
Table 4.3: Model performance of the MIKE 11 for the calibration at some stations ...44
Table 4.4: Calibrated Manning values of the Red and Thai Binh Rivers .....................46
Table 4.5: Model performance of the MIKE 11 for the calibration in the dry season ..47
Table 4.6: Error criteria of the model calibration in the 2002 flood event at some
stations ...........................................................................................................................49
Table 4.7: Model performance of the MIKE 11 for the model validation in the dry
season.............................................................................................................................50
Table 5.1 Comparison between actual and simulated flows of PA1 .............................56
Table 5.2 Comparison between actual and simulated flows of PA2 .............................57
Table 5.3: Comparison of actual and simulated flows of PA3......................................58
Table 5.4 Comparison of actual and simulated flows of PA1+2 ..................................59
Table 5.5 Comparison of actual and simulated flows of PA1+3 ..................................60
Table 5.6: Comparison of actual and simulated flows of PA1+2+3 .............................61
Table 5.7 Comparison of actual and simulated flows of PA1 .......................................63
Table 5.8 Comparison of actual and simulated flows of PA2 .......................................64
Table 5.9: Comparison of actual and simulated flows of PA3......................................65
Table 5.10: Comparison of actual and simulated flows of PA1+2 ...............................66
Table 5.11 Comparison of actual and simulated flows of PA1+3 ................................67
Table 5.12 Comparison of actual and simulated flows PA1+2+3.................................68
5
1. INTRODUCTION
1.1. Overview
Water is a useful natural resource and plays an important role in human being.
The water users in a river basing include some stakeholders such as agriculture,
industry, households, recreation and environment. Obviously all human activities
demand and need fresh water. Fresh water is extremely essential for lives; no other
natural resources can replace it. This meant that water has a high potential use for
human (Zaag & Savenije, 2013).
Nowadays, people have been using water resources in a negative way.
Accordingly, water quality and quantity are both declining significantly. There are
some reasons for this statement including the effects of natural conditions, climate
change, economic and social development, over exploitation of natural resources as
well as the poor management of local authorities.
Water crisis has been increasing and affecting widely all over the world. It is
about 1.2 billion people; similar to 1/5 global population, living in water shortage
areas and other 500 million people are being exposed by this trouble. Water shortage is
caused by natural phenomena and human activities. Fresh water is available
everywhere in our planet and much enough for human. However, fresh water is
distributed unevenly and overused tremendously on the world. In addition, fresh water
has been polluted for decades by many polluted sources due to economic development.
Unsustainable development also is one of the reasons for water crisis. (FAO, 2007).
According to plenty of water institutes, 1/3 countries in the world are facing with
water shortage. In year 2025, it will be predicted that approximately 35% of global
population will be able to face with tremendous water shortage problems.
Based on the report of Ministry of Natural Resources and Environment (2009),
Vietnam has about 3450 rivers with above 10 kilometers length. There are 206 water
sources which are considered as external water resources. Accordingly, total annual
water volume is about 830 billion m3 from the biggest river systems. Total potential
groundwater amount is about 63 billion m3 per year and distributed mainly in the hilly
and mountainous regions (Le Mai, 2013). It can be seen that Vietnam has a lot of
6
water due to the heavy rainy season and dense river intensity. However, droughts and
large scale water shortage occurred regularly in many provinces. Vietnam currently
has many challenges regarding water resources management. In addition, Vietnam is
ranked as one of the most affected countries by climate change and sea level rise.
In recent years, the demand for water is rising day by day under the pressure of
population and development - social growth. Moreover, the uneven distribution of
water resources in time and space with the requirements of environmental flows,
leading to water shortages appear. Besides, the competing interest of different
stakeholders even exaggerates the issue. Besides, erosion and sediment deposition are
happened more frequently on many river systems. These phenomena influences
directly on lives, economics and lives surrounding affected areas as well as the safety
of hydraulic works in the system. One of the natural disasters that needed to be
considered is sediment deposition at downstream areas of river system. In the northern
part of Vietnam, which includes Red and Thai Binh rivers, sediment deposition
happening regularly. Particularly, in Thai Binh river basin, at the downstream area,
Hai Phong city is the most affected area by erosion, deposition as well as salinity
intrusion.
Hydrological models have been used frequently in water resources planning and
management such as hydrological forecasting, reservoir operation, water quality,
research on flood, inundation and drought, designing irrigation system and supporting
for the integrated water resources management. An appropriate model selection is
essential for each research project. These selections thereby have to be based on study
objectives, considering input data and output data, expected results and solutions.
There are many studies on the water field that use models as effective tools to solve
problems. The MIKE 11 model has been developed by DHI Water and Environment
(Danish hydraulic institute) and is used popularly in Vietnam. This model is a
professional engineering software package for simulation of flow, water quality and
sediment transport in estuaries, rivers, irrigation system, channels and others bodies
(DHI 2011). This model will be used for simulation of scenarios and alternatives of
proposed management.
7
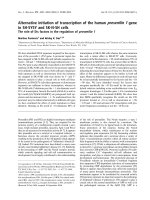
1.2. Problem statement
Figure 1.1 Thai Binh River downstream area
According to the report of Hai Phong Department of Agriculture and Rural
Development, In the Thai Binh River’s downstream, salt intrusion at river mouths is
increasingly happening because of the natural water distribution and sediment (Luoc
river moving and developing on the left side of Van Uc River - Figure 1.1), Thai Binh
River’s downstream has been deposited by sediment since 1960. The average depth of
river bed is fluctuating from 1 to 2 meters.
Besides, the water resources management here is causing a lot of negative impact on
water use. Water quality and quantity are predicted that they are not good enough for
water supply in the area in the future. Those problems mentioned above did, do and
8
will influence strongly on the socio-economic development of Tien Lang and Vinh
Bao districts. Because, these two areas play a role as key development of agricultural
areas as well as water demand would be increased significantly.
In addition, sediment transport is currently increasing at Do Son Beach due to the
water diversion to Van Uc River leading to amount of sediment flowing to the sea.
This will affect tourism and economic development of Hai Phong City.
1.2.1. Objectives of the study
Overall objective is to assess the impact of water regulation works in the
downstream of Thai Binh River by using hydrodynamic model. To achieve the main
objectives, the thesis consists of some detailed goals as follows:
+ Analyzing and assessing the current status of the study area in accordance
with problems and troubles.
+ Using the MIKE 11 to simulate the flow regimes according to proposed
solutions and scenarios in order to suggest the water allocation.
+ Determining the water diversion between Red River and Thai Binh River in
general, particularly determining the impact of regulation works to flow regime in Thai
Binh river’s downstream located in Hai Phong province. Main purpose of the
constructions is to increase the flow in Thai Binh river and to decrease the flow in Van
Uc river. Also, other purpose is to prevent saltwater intrusion in Thai Binh river as well.
+ Proposing solutions for water allocation, water usage, water management in
order to enhance the quality of water use in the study area.
1.2.2. Research questions
What is the current status of water use in the Thai Binh River passing Hai Phong
City?
How does the flow regime in Thai Binh river’s downstream area change if
regulation works added?
What is the effective solution of water management?
9
1.2.3. Thesis overview
Structure of the thesis includes those parts:
Chapter 1: Introduction, presents problem statement, needs of study, research
objectives, and overview of the study area.
Chapter 2: Literature review, reviews the previous studies related to the content
and cope of this research. An overview of hydrodynamic models also analyzed here.
MIKE 11 model will be presented in this chapter as well.
Chapter 3: Study area and data collection, presents the natural conditions,
climatic characteristics of the study area as well as the population characteristics,
economics and society. The water demand and management are also discussed in this
study.
Chapter 4: Metholodology, shows the methodology and steps to achieve the
objectives of the thesis. The chapter discusses the data input as well. Modeling
calibration and validation are also presented here.
Chapter 5: Results and discussions, analyses the model performances (MIKE
11) in order to obtain the research objectives.
Chapter 6: Cconclussions and recommendations, focuses on findings and
recommendations, and future researchs.
In this chapter, existed issues, needs of study, research objectives were be
showed. Because of the uneven river flow distribution between the Van Uc river and
Thai Binh river in the study area, Thai Binh river has high sedimentvolume and salt
intrusion and Van Uc river has the erosion.
10
2. LITERATURE REVIEW
2.1. Overview of Hydrodynamic Model
Any scientific field always needs to develop some processes such as monitoring data,
recording and measuring data, simulation and explanation of natural phenomena. To
have a better understanding of the processes of hydrology, they can be described in
laboratories by physical models. Besides that numerical models have been developed
increasingly due to their advantages such as costs, flexibility and applied technology.
Accordingly, hydraulic and hydrological models are tools to address the real
hydrological cycle in a simplified way. Such models are used for understanding the
hydrological processes as well as making hydrological predictions in cases where
water resources management and utilization activities are implemented. The models
apply several algorithms to provide a quantitative relation between the input data (e.g
rainfall, meteorological data) and output (e.g runoff). The hydrodynamic models have
been used for energy production, sediment transportation, water quality and
environment. Scientists have developed many 1D, 2D and 3D dynamic models. Those
models are used for sustainable water resources management.
Estuaries can be seen as potential and valuable natural resources of environment,
society and economics (Nordstrom, 1992). The research on sediment transportation in
estuaries is normally difficult due to the fluctuation of sediment and impacts of other
natural factors. The sediment transportation process on rivers is relatively complicated
including erosion process, sediment transport and deposition. Those processes relate to
flow regimes, particles characteristics, size and shape, and intensity and elements of
the particles. The morphological changes are the results of the nonlinear interaction
between water and sediment and river bed (Hibma et al, 2004). However, numerical
models are used as valuable tools for simulation of natural phenomena due to the
development of technology in the past decades in order to get a better understanding of
physical processes and numerical technique (Jiang, Ranasinghe & Cowell, 2013).
11
There are many numerical models from open sources, for example Delft3D
developed by Deltares to commercial models MIKE models developed by DHI. A lot
of hydraulic models that simulate the hydrologic regimes and sediment transport have
been considered aiming to obtain an appropriate model. The selected model need to be
considered with many factors such as management, variables and main process, data
available, and input and proposed solutions (Boorman et al., 2007). Hence, the input
data of various models have to be collected aiming to get best understanding of
advantages and disadvantages of them before the model application. Table 2.1 shows
the comparison of different hydrodynamic models.
Eventually, according to the author’s knowledge, natural conditions of the study
area and available input, MIKE 11 model was selected as an effective tool for
achieving the research study.
Table 2.1 Comparison of different One-Dimensional (1D) models
Model
Management
issue
Input
Data
required
Key
Variable
And
process
SWAT (Arnold et
al., 1995; Ndomba
&Griensven,
2011)
SWAT model was
developed predict
the impact of land
management
practices on water,
sediment,
and
agricultural
chemical yields in
large and complex
watersheds.
-DEM
-Soil and land use
map
-Climate data
-Hydrological data
-Sediment load
The model is based
on the water
balance equation
for the soil water
content.
MIKE 11
(Doulgeris et al.,
2012)
HEC-RAS
(Pappenberger et
al., 2005)
ISIS
(Van et al.,
2012)
The Mike 11 model
is a software
package for the
simulation of flow,
water quality,
sediment transport in
estuaries, rivers,
channels and other
water bodies.
HEC-RAS model is
used for variety
types of projects
such as steady,
unsteady and mixed
flow regimes. The
model is used for
multiple purposes.
ISIS is a full
hydrodynamic
simulator for
modeling
flows, water
levels in open
channels and
estuaries.
-Hydrological
-Topographic
-Cross section
-Meteorological
-Sediment
-Reach network
-Cross section
-Steady flow data
-Unsteady flow
-Sediment
The model is based
on Saint Venant’s
equation for
continuity and
momentum equation.
HEC-RAS model is
based
on
the
continuity equation
and
momentum
equation.
-Hydrological
-Cross
Section’s
Geometry
-Sediment
concentration
The model is
based on onedimensional
Saint Venant’s
equations.
12
Model
Key
output
Time
Step
Accessbility to
the
coding
Software
cost
SWAT (Arnold et
al., 1995; Ndomba
&Griensven,
2011)
- Water quality
-Stream flow
-Surface runoff
-Sediment yield
Daily time step
MIKE 11
(Doulgeris et al.,
2012)
-Discharge
-Water level
-Water quality
-Sediment transport
Sec, Minute, Hourly
and daily time step.
The
user
can The user has to pay
access to modify to use the model and
the code of the access to the code.
model.
The SWAT model This is not open
is free and a public source software.
domain software,
The model is very
but ArcGIS
expensive.
interface is needed.
So, it requires cost
of ArcGIS.
HEC-RAS
(Pappenberger et
al., 2005)
ISIS
(Van et al.,
2012)
-Stream flow
-Water level
-Sediment scour
and deposition
Minute, Hourly,
Daily.
The user can access
to modify the code
of the model.
-Runoff
-Water quality
-Sediment
Minute,
Hourly, Daily.
The users can
access freely
to the software
It is a public ID component
domain and free of as well as the
charge from HEC’s whole ISIS
website
component is
free for users.
(Source: Tania Hassan, 2016)
2.2. Briefs of Mike 11 Model
Modelling of rivers and channels. MIKE 11 is a versatile 1D modelling package
covering more application areas than any other river modelling package available.
MIKE 11 is a fully dynamic, one-dimensional modelling package. It includes
comprehensive facilities for modelling complex river channel networks, lakes and
reservoirs. With the hydrodynamic engine as a core module, MIKE 11 offers a variety
of add-on modules and large selection of hydraulic structures, including operational
structures allowing users to define complex control strategies as well as dam break
structures. Additional application areas include, rainfall-runoff, flood modelling,
ecology and water quality, real time forecasting and sediment transport and river
morphology assessments (DHI, 2007). MIKE 11 has been used widely all over the
world. The model includes some modules as follows:
● HD Hydrodynamic.
● AD Advection-Dispersion.
13
● ST Sediment Transport.
● ECO Lab Ecological Modeling.
● RR Rainfall-Runoff.
● FF Flood Forecast.
● DA Data Assimilation.
● Ice River Ice Modeling.
● GIS extension.
This study estimates the proportion of sediment transportation before and after
building reservoir systems on the Red River. Un-coherence sediment transportation
(ST) module is applied in this study. The ST module requires the output from
Hydrodynamic module (HD) including income and outcome water from each crosssection. HD module can describe the critical discharge and super critical discharge
throughout a flowchart. Hydraulic structure is necessary in any model applications and
MIKE 11 supplies all various standard structures. There are some typical applications
related to HD module including as below:
• Flood analysis and flood alleviation design studies
• Real time flood or drought forecasting
• Dam break analysis
• Optimization of reservoir and canal gate and structure operations
• Ecological and water quality assessments in rivers and wetlands
• Water quality forecasting
• Sediment transport and long term assessment of river morphology changes
• Salinity intrusion in rivers and estuaries
14
• Wetland restoration studies
• Integrated modelling of river and groundwater interaction
HD module requires the following input files:
• Network editor *.NWK11
• Cross-section editor *.XNS11
• Boundary editor *.BND11
• Time series files *.DFS0
• HD parameter file *.HD11
• Simulation editor *.SIM11
• Result files *.RES11
Figure 2.1 Simulation interface file of Mike 11 (HD Module)
2.3. Applications of Hydro-dynamic Model
All over the world, many researchers have experimented in order to estimate
the flow changing (Yan et al, 2010, Lajoie et al, 2007, Matteau et al, 2009; Magilligan
15
and Nislow, 2005). Using the MIKE 11 model has become popular nowadays because
of the effective simulation of model.
Many kinds of hydraulic models have been applied widely in solving water
resources issues such as 1D models (MIKE 11, HEC- RAS, etc…) and 2D models
(MIKE 21, TUFLOW, DELF3D….). In Vietnam, especially the MIKE models have
gained popularity lately. These packages have been developed by the DHI water and
environment (Danish Hydraulic Institute), which is a global organization dedicated to
solving challenges in water environments worldwide. There is the question is how
much is modelling needed? Robyn Johnston and Vladimir Smakhtin illustrated that
modelling needs to concentrate on uncertainties reports to assess the application of
model in reality for policy and management processes. New inventions are needed for
improving quality and quantity of modelling (Johnston & Smakhtin, 2014). MIKE 11
model is used to link the hydrodynamic progress and morphological changes (Wang,
2014). This is a useful method for this study. Numerical models are implemented by
the combination of hydrodynamic processes, wave, sediment transportation and depth
update (Jiang et al., 2013).
In Vietnam, scientists assessed changes of the flow and sediment regime due to
the effect of hydropower plants, hydraulic works, regulation works. For example in the
Red River Delta, there are some researches as follows: environment flows (Nguyen
Van Hanh and et al., 2010), sediment transportation (Do Minh Duc, 2004), assessment
of salinity intrusion (Do Thi Bich, 2000); the effects of river bed change, water intake
capacity of hydraulic works (Le Van Hung and Pham Tat Thang, 2015); flow changes
in dry and wet seasons to water distribution (Nguyen Thi Thu Nga and Ha Van Khoi,
2016); water diversion proportion and its effects to erosion and deposition (Nguyen
Huu Hue et al., 2016).
To simulate the flows, except MIKE 11, number of models have been
considered such as Q_SDM_BASIN_2014 (Dao Tan Quy, 2013), using 1-2D model to
assess the effects of constructions on rivers on flow regime and salinity intrusion at
estuaries (Luong Quang Xo, 2014). However, the model performances only showed
the Nash Coefficient from 0.70 to 0.82. MIKE 11 model for flow modelling is still
16
applied in many projects (Nguyen Thanh Hung et al, 2015, Nguyen Van Tuan et al,
2014). However, the studies concentrated on surrounding areas and large scale as well
as lack of information from the study area. Studying on the downstream area of Thai
Binh river need to have available data and detailed conditions of study area. In year
2016, Tania Hasan and others studied for Hai Phong area. However, this study was
only concentrated on sediment transportation due to the interaction of upstream
reservoir systems.
In order to solve completely the existing issues on the study area, this study will
focus on gathering input data including natural conditions, society, water demands,
water management in Thai Binh River, Hai Phong city. Besides, to strengthen the
effectiveness and accuracy of MIKE 11, this study will simulate the flood flow and dry
flow by implementing the model calibration and validation processes.
The chapter presented overview of hydrodynamic model and focus on the MIKE
11 model. Some reviews the previous studies related to the content and cope of this
research were be presented as well. Unlike previous studies, the study used two sets of
parameters for the Mike model in the dry season and flood season. The
specificconditions of study area were be showed.
17
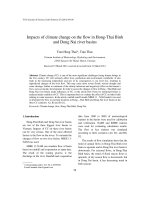
3 STUDY AREA
3.1. Description of Study Area
3.1.1. Geographic Characteristics and River Network
Figure 3.1: Map of the study area focus on two districts: Vinh Bao and Tien Lang
The Thai Binh River is included over 275 km length and 11 branches and estuaries in
downstream. These branches transfer the entire flows from Thai Binh River to four
river mouths including Thai Binh, Van Uc, Lach Tray and Cam estuaries.
The geographic location of the study area shown as follows:
+ Bordered with Thai Thuy district, Thai Binh province in the South-East
direction, close to the borders of Quynh Phu District, Thai Binh Province in the West
direction, Hoa river is a natural border defined from the conjunction of Luoc and Thai
Binh Rivers.
+ Bound by the East sea in the East direction, bordered with Van Uc river in the
North-East direction defined from the upstream of Moi – Van Uc river’s conjunction
to the Sea.
18
+ Bordered with Hai Duong province in the North-West direction, bound by
Moi and Luoc rivers defined from the conjunction of Hoa and Luoc rivers to the
conjunction of Moi and Van Uc Rivers.
Topography and geomorphology of Thai Binh River downstream are the results of
geologic movement in million years in relation with sediment deposition of the Red and
Thai Binh River basins. It can divide the geography into two main regions: the northern
part is lowland terrace with hilly regions, the southern part is remained delta area.
The delta area has elevation fluctuating from 2.50 m up to 3.50 m and the
elevation declining from the West to the East directions. The surface mainly covered
by mixed clay, sandy clay and sediment. In this area, there are many ponds, lakes and
wetlands affected by tidal fluctuation. These water bodies are laid along the large
rivers such as Van Uc, Lach Tray, Thai Binh and Hoa rivers. Particularly, the study
area has a long shoreline with many estuaries (Thai Binh and Van Uc estuaries)
leading to transfer amount of sediment to the Sea significantly. This helps forming the
huge polders, mangrove forests or new economic areas such as Tran Duong, Vinh
Quang, Tien Hung, Dong Hung, Tay Hung.
The geographic characteristics of Thai Binh River downstream influence the
flow regime of the local rivers. The incline of topography towards Northwest –
Southeast directions leads to flow downwards once tidal happening.
The study area’s river network consists of large main rivers which belong to
Red – Thai Binh river system such as Luoc, Moi, Hoa, Thai Binh and Van Uc Rivers.
The location of those rivers described as below:
Thai Binh River is flowing through Cat Khe and Phu Luong hydrological
stations. The river is then divided into two tributaries including Thai Binh and Rang –
Gua Rivers. A segment of Thai Binh tributary flows to Mia River, then merges with
Van Uc. Another segment of Thai Binh river right after Mia River is deposited
strongly. Dai Thang weir was built on this river to get water for irrigation purpose.
Another segment of Thai Binh River identified from Quy Cao to the sea becomes a
tributary of Luoc River. However, the river bed of this segment has been deposited
19
tremendously and flood controlling capacity of this river is mostly zero. Thai Binh
River, a segment from the conjunction of Moi River to the sea, has low velocity and
has been deposited by sediment. Currently, the river bed of this river is quite large but
the river depth is relatively shallow. The river bed elevation changes from -1.00 m
down to -2.50 m. Due to the degradation of the river, the discharge of Luoc River
flowing into this river is quite small. This will definitely lead to extreme salt intrusion.
Thai Binh River, from the conjunction of Moi River to the sea, plays an essential role
in supplying water for Tien Lang district.
Van Uc River has several tributaries such as Mia, Moi, Gua and Lai Vu Rivers.
This river divers a small amount of water to Lach Tray River. Van Uc River’s length is
about 43.5 km, average width of the river is approximately 500-800 m, and river bed
elevation changing from -10.00 m down to -16.00 m. The lowest point reaches -47.00
m where located nearby Moi River.
Luoc River is a tributary of the Red River. Luoc River transfers a small amount
of water to Hoa and Thai Binh Rivers, meanwhile, the entire water from this river is
transferred to Moi and Van Uc rivers. A segment of Luoc River passing Hai Phong has
length of 14 km, the average width of cross-sections here is 300 meters, bed elevation
fluctuating frim -8.00 m down to -12.00 m. Luoc river plays a role as a natural border
of Vinh Bao (Hai Phong province) and Hai Duong as well as a main source of water
supply for Vinh Bao and Tien Lanh districts.
Hoa River is another tributary of Luoc, which defined from Chanh Chu
conjunction. The river reaches to the sea throughout Thai Binh estuary. The length of
the river is about 37 km, and wide of river bed from 150 - 250 meters, elevation of
river bed from -5.00 m down to -7.00 m. Hoa River is a natural border between Vinh
Bao district and Thai Binh Province and is a water supply source for Vinh Bao district.
3.1.2. Climatic characteristics
The study area is located in the southern part of Hai Phong city. The topography of
the area is mainly delta. Therefore, climatic and hydrologic conditions here have the
characteristics of typical red river delta in general and Hai Phong city in particular.
20