10.1.1.577.9118
Bạn đang xem bản rút gọn của tài liệu. Xem và tải ngay bản đầy đủ của tài liệu tại đây (607.58 KB, 7 trang )
<span class='text_page_counter'>(1)</span><div class='page_container' data-page=1>
<b>Modeling the Farm-Retail Price</b>
<b>Spread for Beef</b>
<b>Michael K. Wohlgenant and John D. Mullen</b>
A new model for the farm-retail price spread, which accounts for both farm supply
and retail demand changes, is introduced. This model is applied to beef, and its
empirical performance relative to the markup pricing formulation is evaluated using
nonnested testing procedures. The results are consistent with theory and indicate the
markup pricing model is misspecified.
<i>Key words: beef, marketing margins, markup pricing, nonnested testing.</i>
In recent years the real farm price of beef has
declined despite a secular decline in beef
pro-duction. This suggests demand as well as
sup-ply changes are important in explaining price
changes. Farm-level demand for beef is
influ-enced by changes in both consumer demand
and the farm-retail price spread for beef. This
paper focuses on factors affecting the price
spread by estimating and testing alternative
empirical specifications of the farm-retail price
spread for beef.
A common approach to modeling price
spread behavior is to assume the price spread
is a combination of both percentage and
con-stant absolute amounts (Waugh; George and
King). This suggests an empirical specification
in which the price spread is related to retail
price and marketing input prices. This
mod-eling approach has been applied to beef by
Freebairn and Rausser, Arzac and Wilkinson,
and Brester and Marsh. As emphasized by
Gardner (p. 404) the problem with this
ap-proach is that the relationship between farm
Michael K. Wohlgenant is an associate professor of economics at
North Carolina State University; John D. Mullen is a senior
econ-omist with the New South Wales Department of Agriculture,
Aus-tralia.
Paper No. 10701 of the Journal Series of the North Carolina
Agricultural Research Service, Raleigh.
This material is based upon work supported by the U.S.
De-partment of Agriculture under Agreement No. 58-3J23-4-00278.
Any opinions, findings and conclusions or recommendations
ex-pressed in this publication are those of the authors and do not
necessarily reflect the view of the U.S. Department of Agriculture.
Without implication, appreciation is expressed to Oscar Burt,
Gordon King, Richard King, and Wally Thurman, and anonymous
reviewers for constructive comments on an earlier draft.
and retail prices can be depicted accurately if
changes occur solely in supply or demand, not
both. Because demand as well as supply changes
appear to be important for beef, an alternative
approach to modeling price spread behavior
seems desirable.
As is demonstrated below, relating the price
spread to industry output and marketing input
prices where both prices are deflated by retail
beef price allows simultaneous changes in
de-mand and supply conditions. Hence, this
mod-el, referred to as the relative price modmod-el, is
more theoretically appealing. While still
sim-ilar in many respects, neither the relative price
model nor the George and King formulation
is a special case of the other, so nonnested
econometric testing procedures are used.
Out-of-sample forecast tests also are employed to
test the adequacy of the new specification.
Overall, the results indicate superiority of the
relative price model over the markup pricing
specification.
<b>Theoretical Considerations</b>
The relative price spread model can be derived
from an industry-wide specification of derived
demand by processors for quantity of the farm
output. Assuming the farm product is
prede-termined with respect to price from year to
year because of biological lags in the
produc-tion process, derived demand for the farm
out-put is written in price dependent form as
(1)
<i>Pf f(Q, Pr, C)</i></div>
<span class='text_page_counter'>(2)</span><div class='page_container' data-page=2>
<i>where Pf is the price of the farm output, Q is</i>
the quantity of the agricultural commodity
<i>processed, Pr is the price of the retail product,</i>
and C is a vector of marketing input prices
(wage rates, transport costs, etc.). Neoclassical
theory of the firm implies demand for a factor
of production is invariant to proportionate
changes in all input and output prices (Varian,
chap. 1). This means equation (1) can be
writ-ten in terms of relative prices as
(2) <i>P/P, = fQ, 1, C/Pr) = g(Q, C/P,).</i>
Heien (p. 128) calls equation (2) the
"farm-retail margin." This equation shows the
the-oretical determinants of the farm-retail price
ratio. Increases in farm-level output and
in-creases in relative marketing costs would be
expected to lower the farm-retail price ratio.
To obtain a specification for the farm-retail
price spread note that when farm price is
mea-sured in the same units as the retail product
that the relative price spread is by definition
equal to one minus the relative farm price.
Thus, using equation (2), the specification for
the relative price spread is
(3) <i>(M/P) = 1 -g(Q, C/P) = h(Q, C/Pr)</i>
or, in terms of the absolute spread, as
(4) <i>M= Prh(Q, C/Pr),</i>
<i>where M = P, - Pf is the farm-retail price</i>
spread.1
In constrast to the markup pricing model,
this model indicates that there is no fixed
re-lationship between the price spread and retail
price. In general, the relationship between the
prices will change as output and relative
mar-keting input prices change. This formulation
is consistent with the theory of food price
de-termination put forth by Gardner. It suggests
that shifts in retail demand and farm supply
have two possible avenues of influence on the
farm-retail price spread: quantity of output and
retail price. Increases in output and increases
in relative marketing costs lead to a higher
relative price spread. Because shifts in both
demand and supply can cause output and retail
price to change, a complete analysis of the price
spread is only possible through analyzing the
complete set of market behavior equations. The
present paper is primarily concerned with
The farm price is assumed to be net of by-product values.
specification of the structural equation
defin-ing the linkage between farm and retail prices.
An alternative way to obtain equation (4) is
to view the spread as the price of a bundle of
marketing services. On this interpretation,
firms would be expected to provide marketing
services to the point where the marginal value
<i>of these services (M) equals marginal cost. That</i>
is,
(5) <i>M = k(Q, C),</i>
<i>where k(.) is the marginal cost function of </i>
mar-keting services. The marginal cost function is
homogenous of degree one in input prices
<i>(Varian), implying k(Q, C) = (l/t)k(Q, tC) for</i>
<i>all t > 0. With t = (1/Pr), this yields an equation</i>
of exactly the same form as (4).
The foregoing analysis suggests an
alterna-tive specification for the price spread relation
of the same form as equation (5) but with both
<i>M and C deflated by some general price index</i>
such as the consumer price index. Such a
spec-ification of marketing margin behavior is
prev-alent in the literature (e.g., Buse and Brandow).
The choice between (4) and (5), therefore, can
be thought of as a choice between relative and
real price specifications for price spread
be-havior.
<b>Empirical Specifications and Nonnested</b>
<b>Testing Procedures</b>
Based on the previous theoretical
consider-ations, three empirical specifications are
hy-pothesized for the farm-retail price spread for
beef. These are:
(6) <i>Mt = ao + alPrt + a<sub>2</sub>IC, + Elt,</i>
(7) <i>M, = bPrt + b<sub>2</sub>PtQt + bICt + </i>E2t, and
<i>(8) Mt </i>= <i>c+ </i> <i>Q + cIC, + E,</i>
<i>where Mt is the farm-retail price spread for</i>
beef, cents per pound (retail price of choice
beef minus retail equivalent of farm price net
<i>of by-product value), Pr is the retail price, of</i>
<i>choice beef (c/lb.), ICt is an index of marketing</i>
costs for beef, 1967 = 100 (simple average of
index of earnings of employees in packing
plants, and producer price index of fuels and
<i>related products and power), and Qt is per </i>
cap-ita quantity of beef produced (million pounds
of beef, carcass weight, divided by civilian
population in millions to remove trend growth
</div>
<span class='text_page_counter'>(3)</span><div class='page_container' data-page=3>
deflated by the consumer price index.2
Equa-tion (6) is the markup pricing hypothesis
aug-mented by the index of marketing costs.
Equa-tions (7) and (8) are linear specificaEqua-tions for
the relative price spread formulation (4) and
the real price spread formulation (5),
respec-tively.
Note that equation (7) does not contain an
intercept. The reason for this can be seen by
comparing equation (3) with equation (4).
Spe-cifically, the theory underlying this
specifica-tion suggests that the price spread relaspecifica-tion is
homogenous of degree 1 in input and output
prices. Clearly, equations (3) and (4) do not
produce identical empirical specifications since,
if the error term in one of these equations is
assumed to be homoscedastic, it must be
het-eroscedastic in the other. Specifying the
rela-tive price spread hypothesis as equation (7) has
the advantage that the comparison with
equa-tions (6) and (8) leads to easily identifiable
nonnested hypotheses (see, e.g., Quandt).
Because no one specification for price spread
behavior is a special case of the other,
non-nested testing procedures need to be employed.
A number of tests have been proposed (see
Godfrey and Pesaran). The simplest of these
tests is the J-test proposed by Davidson and
MacKinnon. This test can be implemented as
follows. Suppose the null nypothesis is the
markup pricing model (6) and the alternative
hypothesis is the relative price spread model
(7). Consider the compound regression model
<i>(9) M = (1 </i>- <i>X)(ao + alPrt + a2ICt) + XM2t + E</i>
= <i>+ a'Pt </i> <i>+ a2'ICt + XMt M 2</i> + <i>t,</i>
<i>where M2t is the predicted value of Mt from</i>
the regression model (7). Under the null
hy-pothesis (6), the value of X is zero; that is, the
relative price model can explain none of the
variation in price spread not already accounted
for by the markup model. Davidson and
MacKinnon (also see Pesaran) show that one
may validly test whether X = 0 by estimating
equation (9) and employing a conventional
t-test. The J-test can be used also to test the
truth of a hypothesis against several
alterna-tives at once. For example, to test (6) against
both (7) and (8), one would estimate the
com-pound model consisting of the right-hand-side
2 <i>Sources for beef data are USDA Livestock and Meat Statistics</i>
<i>and Livestock and Poultry Outlook and Situation. Other data were</i>
<i>obtained from the Economic Report of the President and USDL</i>
<i>Employment and Earnings of the United States.</i>
<i>variables in (6) and the predicted values M2t</i>
and M3, from (7) and (8) and then test the
significance of these predicted values using a
conventional F-test.
Godfrey and Pesaran present monte-carlo
results which indicate the J-test has low power
for small samples. They propose two
addi-tional tests which seem to have good
small-sample properties.3 These tests are an adjusted
<i>Cox-type test (No-test) and Wald-type test </i>
(W-test). As with the J-test, computed values for
the <i>No </i>and W-tests can be compared with the
tabled t-value with the appropriate degrees of
freedom. Formulas for these test statistics are
not presented here in order to save space; they
can be found in Godfrey and Pesaran (sec. 2).
<b>Econometric Results and Hypothesis</b>
<b>Testing</b>
Equations (6)-(8) were estimated with U.S.
an-nual time-series data covering the period
1959-83, a total of twenty-five observations. These
results, together with equation (7) with an
in-tercept included, are reported in table 1. All
parameter estimates have the expected signs.
The fact that the intercept in equation (7) is
not significantly different from zero provides
some support for the relative price
specifica-tion. However, by the usual statistical criteria
and consistency with a priori expectations, it
is difficult to choose between these models.
The only model that appears somewhat
sus-pect is equation (8), which has a substantially
<i>lower R2</i> and a low Durbin-Watson statistic.4
Table 2 presents pair-wise nonnested tests
<i>of each of the three models. Here, H1</i> through
<i>H3</i> correspond to models (6)-(8), respectively.
Each group of three rows relates to a particular
hypothesis being tested. The first element of
each column is the value of the J-test, the
sec-ond element is the value of the NO-test, and
the third element is the value of the W-test.
Although the main interest is in testing the
<i>truth of H1</i> <i>against H2</i> <i>and H3, all pair-wise</i>
tests are presented because the test results can
3 Davidson and MacKinnon (pp. 783-84) discuss another test
based on an F-test from estimating a compound model which
includes the regressors from both the null and alternative
hypoth-esis. This test is not employed here because it yields the same
results as the J-test for the three specifications considered.
</div>
<span class='text_page_counter'>(4)</span><div class='page_container' data-page=4>
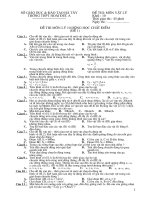
<b>Table 1. Econometric Estimates of Alternative Specifications of the Farm-Retail Price Spread</b>
<b>for Beef, 1959-83</b>
Explanatory Variables Statistics
Model Intercept <i>Prt </i> <i>Pr </i> <i>QQt </i> <i>IC, </i> <i>R2</i> D-Wa
<i>M, eq. (6) </i> 5.524 .199 .084 .72 2.03
(4.861)b (.051) (.013)
<i>M,, eq. (7) </i> .183 .783 x 10-3 .083 NAc NA
(.032) (.316 x 10-3) (.011)
<i>M,, </i>eq. (7) 4.699 .189 .757 x 10-3 .079 .78 2.33
with intercept (4.424) (.052) (.316 x 10-3) (.012)
<i>M,, eq. (8) </i> 19.229 .049 .079 .56 1.30
(4.134) (.040) (.016)
a Durbin-Watson statistics.
b Standard error of the coefficient.
c NA-not applicable.
be sensitive to the ordering of the null and
alternative hypothesis (see Davidson and
MacKinnon, p. 783). All entries in the table
can be compared with the tabled value for the
two-sided t-test with twenty-two degrees of
freedom. At the 5% significance level, this
crit-ical value is 2.074.
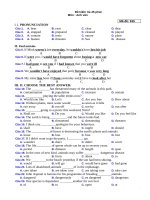
The pair-wise tests in table 2 indicate
<i><b>rejec-tion of both H</b><b>1</b></i> <i>and H3</i> but nonrejection of H2
relative to the other hypotheses. In only one
<i><b>case (H</b><b>1</b></i> <i>vs. H3) do the test results yield </i>
am-biguous conclusions. In this case, the J-test
<i>indicates rejection but the No- and W-tests </i>
in-dicate nonrejection. This is consistent with the
findings of Godfrey and Pesaran, who find a
tendency for the J-test to reject when it should
not.
As noted earlier, the J-test can be used also
to test each hypothesis against the other two
jointly by estimating a compound model
con-sisting of the regressors of the null hypothesis
and the predicted values of the dependent
vari-ables for the two alternative hypotheses. These
test statistics, which are computed using the
conventional formulas for F-tests, yield values
<i>for H1</i> <i>of 2.73, for H2</i> of .54, and for <i>H3</i> of
10.33. In each case, the F-value has two
nu-merator and twenty denominator degrees of
freedom. With a 5% critical value of 3.49, this
<i>suggests rejection of only H3. While this result</i>
may appear favorable for the markup pricing
hypothesis, the F-test gives disproportionate
weight to <i>H3, which based on the results in</i>
table 2 appears to be an inferior alternative to
either H1 <i>or H2. In other words, the relevant</i>
<i>comparison seems to be between Hi and H2.</i>
The pair-wise results in table 2 clearly indicate
a preference for the relative price spread
mod-el.
<b>Out-of-Sample Forecast Tests</b>
Equations (6) and (7) also were subjected to
out-of-sample forecast tests. Recursive
resid-ual analysis, described by Galpin and
Haw-kins, was used to assess the extent of parameter
instability over the sample period. Recursive
residuals are derived by sequentially deleting
observations from the model and by using
the estimated parameters from the reduced
sample to generate year-ahead forecast errors.
Under the null hypothesis that the model
spec-ification is correct, these (standardized)
recur-sive residuals will be normally distributed. A
<i><b>Table 2. Pair-wise Nonnested Tests for H,</b></i>
<b>through H3</b>
Null
N u l
l Alternative Hypothesis
Hypo-thesis <i>H, </i> <i>H2</i> <i>H3</i>
<i>H, </i> 2.39 2.39
-3.23 -. 60
-2.92 -. 59
<i>H2</i> 1.06 1.06
-. 37 -1.19
-. 37 -1.06
<i>H<sub>3</sub></i> 4.66 4.66
-7.72 -5.93
-6.10 -3.47
</div>
<span class='text_page_counter'>(5)</span><div class='page_container' data-page=5>
total of twenty-two recursive residuals were
generated for each model, and normality was
tested using the Shapiro-Wilk statistic. For each
model the null hypothesis of normally
distrib-uted errors was not rejected at a 10%
signifi-cance level.
The CUSUM test suggested by Brown,
Dur-bin, and Evans was also applied. Under the
null hypothesis, the sum of the recursive
re-siduals (standardized by the standard
devia-tion of the sample) is expected to follow a
ran-dom walk around zero. While none of the
CUSUM plots for the three models closely
re-sembled a random walk, neither did they cross
the "critical boundaries"; hence, the plots do
not indicate a process of gradual structural
change.
On these criteria the relative price and
George and King models seem to be correctly
specified and the residuals have the desirable
properties. However, other aspects of the
be-havior of the recursive parameters and
resid-uals gave cause for concern about the stability
of the models. The normal probability plots
did not pass through the origin, and the
CU-SUM plots and residuals suggested that both
models were systematically overpredicting the
price spread from around 1973. Dufour argues
that "structural changes will be indicated by
tendencies to either overpredict or
underpre-dict" (p. 34). A plot of the recursively
esti-mated parameters also suggested structural
change around 1966. The structural shift
seemed most pronounced for the George and
King model and involved the parameter on
retail price changing from negative to positive
and that on marketing input prices becoming
much smaller. This type of behavior results
either from the presence of outliers in the base
period for the recursive estimation or from
some form of model misspecification. Because
the parameters changed most in the late 1960s
it would seem that misspecification was more
likely the problem.5
The out-of-sample forecasting performance
5 The two price spread models were also subjected to
within-sample structural tests. Plots of the price spread suggested that
structural change may have occurred in the early 1970s coincident
with rising oil prices. Moschini and Meilke found some evidence
of structural change in demand for meat around this time. Hence,
the significance of slope and intercept dummy variables for the
period 1973 to 1983 for the three models was tested using an F-test.
The relative price model was structurally stable. The intercept
dummy variable for George and King model was significant at the
5% level but not the 1% level after failing to reject the hypothesis
that the slope parameters were stable.
of both models was compared using a
mean-squared-error (MSE) test developed by Ashley,
Granger, and Schmalansee. In this test, the
difference in the out-of-sample forecast errors
between the two models was regressed on the
sum of the forecast errors from the two models.
When both intercept and slope are positive, a
conventional F-test can be employed to test
that both models have equal forecasting
per-formance (see Ashley, Granger, and
Schma-lansee, p. 1155). This test was applied to ten
out-of-sample forecast errors (1974-83) for
equations (6) and (7) using parameters
esti-mated with data over the period 1959-73. The
computed F-value was 67.76, indicating strong
rejection of the null hypothesis that the two
MSE's are the same.6 The relative price spread
model has a much smaller MSE and hence is
preferred on this criterion.
<b>Discussion</b>
Overall, the test results indicate rejection of
the markup pricing specification compared to
the relative price spread specification. The
rea-son for the difference in empirical performance
appears to be significant shifts in retail demand
as well as farm supply, which are reflected both
in retail price and quantity and, therefore, the
relationship between retail and farm price. The
inferior performance of the markup pricing
model is consistent with the conclusion by
Gardner (p. 406) that, with both supply and
demand shifts, no markup pricing relationship
can depict accurately the relationship between
retail and farm price.
It is interesting to compare the results of this
study with those of Buse and Brandow, who
also included retail price and quantity in their
margin specifications. In contrast to the
find-ings reported here, their results indicated
vol-ume had a small and insignificant effect on the
farm-retail price spread for beef. This was true
for both quarterly and annual data. While Buse
and Brandow's finding of an insignificant
re-lationship could be a function of the time
pe-riod used (1921-41, 1947-57), it also could be
an artifact of the specific functional form they
used. In particular, their model related the price
spread linearly to retail price and quantity
</div>
<span class='text_page_counter'>(6)</span><div class='page_container' data-page=6>
without an interaction term between price and
quantity. The results in table 2 clearly indicate
this interaction term is preferred to a linear
quantity term. The implication of this finding
is that quantity affects margin behavior mainly
through its effect on the percentage
markup-a lmarkup-arger volume lemarkup-ads to markup-a higher percentmarkup-age
markup and vice versa.
A related implication of the relative price
spread model concerns estimation of derived
demand elasticities. George and King show that
with their specification of price spread
behav-ior (and assuming fixed input proportions),
de-rived demand elasticities can be obtained as
the product of retail price elasticities of
de-mand and elasticities of price transmission
be-tween retail and farm prices. As emphasized
by Hildreth and Jarrett (p. 110), this
relation-ship obtains only when quantity does not
ap-pear in the processor behavioral equation.
Otherwise, the formula must be modified to
account for the influence of retail price on
out-put quantity. In that case, the correct derived
demand formula to use is
<i>r7'e</i>
<i><b>1 -(n/E)</b></i>
<i>where r is the price elasticity of retail demand,</i>
<i>e is the elasticity of price transmission, and E</i>
is the price elasticity of the retail supply
func-tion.7 Using this formula, derived demand
elasticities from the relative price spread
mod-el can be compared with those derived from
the George and King model. At the sample
mean prices and quantities of 90.49¢ and
100.36 pounds, the elasticity of price
trans-missions for the George and King and relative
price spread models are .75 and .81,
respec-tively. The retail supply elasticity for the
rel-ative price spread model at the sample means
is estimated to be 9.4. Assuming a retail
de-mand elasticity of -. 6, we obtain elasticities
of derived demand for the George and King
and relative price spread models of -. 45 and
-. 46, respectively. Thus, despite the inferior
statistical performance of the George and King
model, this model and the relative price spread
model yield almost the same derived demand
elasticities at the sample means. The reason
for the similarity in estimates is the large retail
supply elasticity at this data point.
7 On the assumption the retail product is produced in fixed
pro-portions with the farm product, the retail supply elasticity can be
derived by differentiating equation (1). See Hildreth and Jarrett
for details.
Despite the similarity in derived demand
elasticities with these two models, the choice
of an econometric model for price spread
be-havior will depend upon its ultimate use. If
the model is to be used to obtain derived
de-mand elasticities, then the George and King
model might suffice. However, if the model is
intended to be used in policy applications
re-lating to shifts in both retail demand and farm
supply, then preference would be for the
rel-ative price model. The reason for this is that
the relative price model can account for shifts
in supply and demand which have different
consequences for the relationship between farm
and retail prices. For example, a policy aimed
at reducing farm output supply (which would
cause quantity to fall and retail price to rise)
would have different consequences for the
re-lationship between farm and retail prices than
a policy aimed at increasing retail demand
(which would cause both quantity and retail
price to rise). The relative price spread model
proposed here is an improvement on previous
specifications of margin behavior precisely
be-cause it can account for simultaneous changes
in farm output supply and retail demand.
<i>[Received July 1986; final revision</i>
<i>received April 1987.]</i>
<b>References</b>
Arzac, E. R., and M. Wilkinson. "A Quarterly
Econo-metric Model of United States Livestock and Feed
Grain Markets and Some of Its Policy Implications."
<i>Amer. J. Agr. Econ. 61(1979):297-308.</i>
Ashley, R., Granger, C. W. J., and R. Schmalansee.
"Ad-vertising and Aggregate Consumption: An Analysis
<i>of Causality." Econometrica 48(1980):1149-67.</i>
Brester, G. W., and J. M. Marsh. "A Statistical Model of
the Primary and Derived Market Levels in the U.S.
<i>Beef Industry." West. J. Agr. Econ. 8(1983):34-49.</i>
Brown, R. L., J. Durbin, and J. M. Evans. "Techniques
for Testing the Constancy of Regression Relationships
<i>Over Time." J. Amer. Statist. Soc. B </i>
37(1975):149-92.
Buse, R. C., and G. F. Brandow. "The Relationship of
Volume, Prices, and Costs to Marketing Margins for
<i>Farm Foods." J. Farm Econ. 42(1960):362-70.</i>
Davidson, R., and J. G. MacKinnon. "Several Tests for
Model Specification in the Presence of Alternative
<i>Hypotheses." Econometrica 49(1981):781-93.</i>
Dufour, J. M. "Recursive Stability Analysis of Linear
</div>
<span class='text_page_counter'>(7)</span><div class='page_container' data-page=7>
<i>Economic Report of the President. Washington, DC, </i>
var-ious issues.
Freebair, J. W., and G. C. Rausser. "Effects of Changes
<i>in the Level of U.S. Beef Imports." Amer. J. Agr.</i>
<i>Econ. 57(1975):676-88.</i>
Galpin, J. S., and D. M. Hawkins. "The Use of Recursive
Residuals in Checking Model Fit in Linear
<i>Regres-sion." Amer. Statistician 38(1984):94-105.</i>
Gardner, B. L. "The Farm-Retail Price Spread in a
<i>Com-petitive Food Industry." Amer. J. Agr. Econ. 57(1975):</i>
399-409.
<i>George, P. S., and G. A. King. Consumer Demand for</i>
<i>Food Commodities in the United States with </i>
<i>Projec-tions for 1980. Giannini Foundation Monograph No.</i>
26, University of California, Berkeley, 1971.
Godfrey, L. G., and M. H. Pesaran. "Tests of Non-Nested
Regression Models: Small Sample Adjustments and
<i>Monte Carlo Evidence." J. Econometrics 21(1983):</i>
133-54.
Heien, D. M. "Price Determination Processes for
<i>Agri-cultural Sector Models." Amer. J. Agr. Econ. 59(1977):</i>
126-32.
<i>Hildreth, C., and F. G. Jarrett. A Statistical Study of</i>
<i>Livestock Production and Marketing. Cowles </i>
Com-mission Monograph No. 15. New York: John Wiley
& Sons, 1955.
Moschini, G., and K. D. Meilke. "Parameter Stability
<i>and the U.S. Demand for Beef." West. J. Agr. Econ.</i>
9(1984):271-81.
<i>Parish, R. M. "Price 'Levelling' and 'Averaging'." Farm</i>
<i>Economist 11(1967):187-98.</i>
Pesaran, M. H. "Comparison of Local Power of
Alter-native Tests of Non-Nested Regression Models."
<i>Econometrica 50(1982):1287-1305.</i>
Quandt, R. E. "A Comparison of Methods for Testing
<i>Non-Nested Hypothesis." Rev. Econ. and Statist.</i>
56(1974):92-99.
<i>U.S. Department of Agriculture. Livestock and Meat </i>
<i>Sta-tistics. Washington DC, various issues.</i>
<i>. Livestock and Poultry Outlook and Situation.</i>
Washington DC, various issues.
<i>U.S. Department of Labor. Employment and Earnings</i>
<i>of the United States. Washington DC, various issues.</i>
<i>Varian, H. R. Microeconomic Analysis. New York: W.</i>
W. Norton & Co., 1978.
</div>
<!--links-->