State Induced Capital Penetration of Agriculture Sector in India
Bạn đang xem bản rút gọn của tài liệu. Xem và tải ngay bản đầy đủ của tài liệu tại đây (728.29 KB, 57 trang )
<span class='text_page_counter'>(1)</span><div class='page_container' data-page=1>
<b>State Induced Capital </b>
<b>Penetration of Agriculture Sector </b>
<b>in India </b>
Anirudh Kumar
Ph.D. Research Scholar
</div>
<span class='text_page_counter'>(2)</span><div class='page_container' data-page=2>
<i>Abstract </i>
</div>
<span class='text_page_counter'>(3)</span><div class='page_container' data-page=3>
<b>Introduction </b>
</div>
<span class='text_page_counter'>(4)</span><div class='page_container' data-page=4>
<b>Section I- Corporate sector and Government policies </b>
Indian Economy has historically been an agrarian economy, with agriculture being the mainstay
occupation of its population and largest contributor to GDP at the time of the country’s
independence from British rule. According to previously used methodology to calculate GDP in
1950-51 contribution of Agriculture & allied, Industry, and Services sector was 51.81 per cent,
14.16 per cent, and 33.25 per cent, respectively at current prices. In 2013-14 share of Industry
sector has increased to 24.77 per cent, services sector to 57.03 per cent while that of agriculture
and allied sector has declined to 18.20 per cent. There is a structural imbalance in the Indian
Economy where agriculture still employs half the population of India while contributing less than
20 per cent to the country’s GDP.
</div>
<span class='text_page_counter'>(5)</span><div class='page_container' data-page=5>
The following are some of the channels through which corporates penetrates into agriculture: -
• Contract farming: A package of input supply, price security, sharing of monsoons risk,
sharing of technical knowledge by the firm etc. under a forward contract between producer
and processor. Food Processing companies by such arrangement get assured input supply,
they are dependent on farmer for their raw material supply, the structure of Contract
farming is such that the success of farmers in cultivating a good crop translates into a
success for the processor.
• FPI- Food processing Industry: an industry still at nascent stage as the sector contributes
less than 2% to Indian GDP, and only 10% of India food is processed.
• MCX-Multi-Commodity exchange in different agricultural commodities also options and
other spot and derivatives being introduced by SEBI
• Annual reports of private Corporates like ITC, HUL etc. hints toward other channel like:
Integrated watershed programs, diversifying farming activities through introducing
Livestock Development program to diversify farmers income, R&D facilities of corporates
working in coordination with ICAR and support by other government research institutes.
• Integrated Consumer Goods Manufacturing and Logistics facility with the aim of making
a demand driven value and supply chains in agriculture, replacing the traditional supply
chains.
• Supplying Agri-inputs like seeds, pesticides, fertilizers etc. to the Farmer, engaging in
innovation and research of the aforementioned products.
Some of the facilitative and regulatory function that the government has done until now to facilitate
corporate penetration in agriculture (as per Press Information bureau (PIB), Government of India):
</div>
<span class='text_page_counter'>(6)</span><div class='page_container' data-page=6>
• Agricultural producing and marketing committee- APMC law 2003, and its amendment in
2013 and in 2017: includes de-notification of perishables from AMPC act and stresses on
direct selling of farmers to agribusiness corporates.
• APLCFS-2018 ( Agriculture produce and Livestock Contract Farming and services
Act),: a separate law for contract farming earlier contract act (1872) used to apply to this
sector, but a need for separate law keeping in mind the specific provision of contract
farming was felt
• Government has launched a Scheme for Agro-Marine Processing and Development of
Agro-Processing Clusters formally- KISAN SAMPADA YOJANA with a budgeted
expenditure of Rs. 6,000 crore rupees for the period 2016-20 to promote food processing
industries in India. Private sector is supposed to take a lead role in its implementation. the
SAMPADA scheme is flexible enough to let the entrepreneur choose the appropriate
location for their projects based on availability of raw material, viability of the project and
techno-economic feasibility.
• Ministry of Food Processing Industries (MoFPI) :- establishing mega food parks and
signing MoUs with Italy and France and other countries with departments like NIFTEM-
National Institute of Food Technology Entrepreneurship and Management and IIFPT
-Indian Institute of Food Processing Technology for developing Food processing
technologies so as to stimulate investment for developing infrastructure of FPI sector,
developing capability for institutional cooperation, and to ensure farmer’s participation in
conferences, workshops, food fairs etc.
</div>
<span class='text_page_counter'>(7)</span><div class='page_container' data-page=7>
• Notification by SEBI for using stock markets for MCX in agriculture commodities
Privatization is glorified as the one-shot panacea to cure all the maladies affecting our country
– and the same is true with regard to the approach towards agriculture. In the discourse
surrounding it, the emphasis always tends to be on the ‘efficiency’ aspects of heightened
<i>corporate presence. What is neglected in the process is the dimension of concentration of </i>
economic power that is also associated with the corporate sector.
Ploeg (2008) regards big corporates as food empire who are present in every arena of Agri-market;
from input supplying, developing chemicals, carrying out R&D in agriculture, food processing,
selling, distribution, marketing of the agriculture product etc. The control by few corporates over
the amount of fertilizers, pesticides, seeds, tractors, the sale of farmer’s produce, to the
consumption by the consumer etc. and the political-support garnered by them prompts Ploeg to
regard them as an empire.
At the time of independence, planning was recognized as a potent tool to transform the Indian
economy and bring it out of the stagnancy and decadence; the legacy inherited from two centuries
of British rule. The expectations were to emulate the success story of the centrally-planned Russian
model of development. Several plans were chalked-out even before an independent Indian state
came into being.
Post-independence, a planning commission (1950) was set up, national development council was
established, elaborate plans were made, where state was designated to play a significant central
role. Gradual policy changes continued thereafter till the 1990s when, Indian economy witnessed
the balance of payment crisis that initiated widespread liberalization of the economy, and a change
in the role of state from omnipotent manager, owner, regulator of the economy etc., to imparting
some of these function to the private sector while retaining the regulatory function with itself.
</div>
<span class='text_page_counter'>(8)</span><div class='page_container' data-page=8>
depressing agriculture income, minimal surplus to invest and naturally no market for industrial
good, as the mass just didn’t have the monetary income to buy goods. Land reforms was the
necessary corrective to this particular problem of economic concentration and to eliminate its
dragging effects on the economy. Land Reforms, however, met political resistance from the rich
and powerful land holding class in India and achieved limited success. Only some parts of the
country- West Bengal, Kerala etc. could execute the policy. A similar thing happened in the
process of increasing agriculture productivity as green revolution-1965 onwards was limited to
Punjab, Haryana and Western Uttar Pradesh etc. Green revolution marked a shift in policy towards
increasing productivity of the agricultural land through use of HYV seeds, and greater use of
fertilizers, pesticides etc., and thereby increasing the return in farming rather than distribute the
land equally through land reforms.
Limited success of land reforms could never be fully compensated by other policies to promote
agricultural development. An agriculture policy geared towards increasing agricultural
productivity, equal distribution of land, achieving food security for the millions only remained on
paper and could never come into effect. It not only meant an agricultural sector prone to crisis but
also impeded the development of the industrial sector. Lerche (2013) remarks that this is the main
cause due to which the larger agrarian question could never be resolved, even in 21st<sub> century </sub>
majority of Indian population is employed in agriculture, with rampant farmer suicide, lower yields
than other countries, reeling under crisis as the primitive and unbalanced nature of agriculture is
still intact.
</div>
<span class='text_page_counter'>(9)</span><div class='page_container' data-page=9>
whenever agricultural faced severe distress and resources had to be diverted there, this led to a
very slow growth in the size of the market. Agriculture worked as a constrained to the growth of
industrial sector in two ways, first as the resources earmarked for development of industrial sector
had to be diverted to agriculture and second in the absence of market for industrial product.
The monopoly element by the post-independence industrial development process was documented
by Mahalanobis committee, Monopoly Inquiry Commission (MIC), Industrial licensing policy
inquiry committee (ILPIC), Hazari committee etc. There was unanimous agreement on the
formation of monopoly in the economy via licensing requirement, amending Industrial
development regulation act (IDRA) (1948 & 1956) to make special provision for some business
houses. S.K. Goyal (1979) contends that state took measures to protect, promote and support
incumbent industrialist at the neglect of other potential enterprising individuals.
Goyal (1979) contends that there were two kinds of concentration that came to characterize the
Indian economy. One was a concentration over business and economic assets and the second and
more dangerous was the aggregate concentration; the corporate-state nexus with which they could
change the thrust of government policy, customizing the economic policies as deemed fit by them.
The corporate-state nexus hindered the growth of the economy. Though the Monopolies &
Restrictive Trade Practices Act (MRTP act-1969) came into effect to curb growth of monopoly
power in the Indian economy, it achieved little of that objective. Corporates always found a way
around government regulations. For e.g. intercorporate investment, opaqueness in accounting
practices. Production capacity was undertaken by them under licensing agreement which were
never utilized, at other times they produced more than their licensing capacity to tap the profit etc.
Little was done by corporates to develop technological base so as to fare the economy through the
changing course of global growth trajectory shaped by the third industrial revolution.
</div>
<span class='text_page_counter'>(10)</span><div class='page_container' data-page=10>
reducing their dependence on usurious moneylender. Government financed a lot of business
operation where private capital was not forthcoming. Public Private Partnership (PPP), providing
loan, acquiring equity share etc., became some of the way to finance business operation during
that time.
MRTP and Competition Act 2002 (CA02) have led to hampering the growth of monopoly power
of business houses. Mazumdar (2008) documents that none of these expectations and policy efforts
bore fruits, as government though owned a substantial share through debt or equity actively choose
to not exercise its decision-making power and interfere in management. The narrow private sector
could make decisions, foray into new ventures, could carry on its opaque accounting practices, and
kept other out, only this time by the legitimacy provided by the state. Though MRTP was on paper
a good act it couldn’t bring out the required change in industrial sector. The MRTP Act was
abolished and replaced eventually by the Competition act of 2002. Mehta (2005) states that the
competition act shifted attention away from monopolization of the economy and towards
enhancing competition. Checking monopoly power was not the regulating-government priority
agenda.
Other measures like abolition of managing agency, the foreign exchange regulation act (FERA)
led to the exit of some MNC’s like IBM, coke in the 1980’s, and some of this vacated space was
occupied by indigenous industries though they lacked technology to fill those roles.
</div>
<span class='text_page_counter'>(11)</span><div class='page_container' data-page=11>
<b>Section II: Concentration of Corporate sector in Agri-input and </b>
<b>Agri-output market </b>
We analyze the corporate sector by first focusing on Agri-input market and then on Agri-output
market.
<b>Concentration in Corporates, providing input to the Agriculture Sector </b>
</div>
<span class='text_page_counter'>(12)</span><div class='page_container' data-page=12>
in 2017, when there are three (3) big scale mergers taking place in the global front among the big
six firms. And Indian agriculture is more mechanized than ever, with wheat being the most
mechanized crop. Due to limitation imposed by data, we extrapolate our findings based on the
secondary data and studies of different authors.
Sharma (2009) notes that the yield of food grains has increased from 522 kg per hectare in
1950-51 to more than three times to 1854 kg per hectare ha in 2007-08, and food grains
production increased from 51 million tonnes (approx.) in 1950-51 to about 231 million tonnes
in 2007-08. Production of sugarcane, oilseeds and cotton all increased more than four-fold
reaching approximately 348 million tonnes, 29.75 million tonnes, and 25.88 million bales,
respectively in 2007-08. The period 2002 to 2007 saw an unprecedented
increasein imports of fertilizers, the reason being that there has not been any addition
in domestic capacity of fertilizer research and productionowing to uncertain policy environment
regarding the same. Imports of fertilizers namely nitrogen, potassium and phosphorous and their
variant has increased from about 1.9 million tonnes in 2002-03 to nearly 7.8 million tonnes in
2007-08.
Rao (2015) notes that the total Production of food grains in India catapulted to
260 million tonnes in theyear-2013-14 from 81 million tonnesin the year 1965, when
seed-fertilizer technologies first arrived in the form of green revolution into the country’s agriculture.
Food grain productivity per unit of land has also increased from 591 kilograms per hectare to
2,100 kilograms per hectare in the aforementioned Period, Rao states that there is a need of a
second green revolution as the productivity of cereals-wheat and rice along with other crop as
Indian agricultural productivity is far behind that of the agricultural productivity of the world.
</div>
<span class='text_page_counter'>(13)</span><div class='page_container' data-page=13>
Nagarajan (2014) et. al. noted that the consumption, production and import of fertilizer all
experienced an upward trend from 1971 to 2011. The sale of seeds, pesticides, tractor and fertilizer
all experienced an upward trend. The competition in the market actually increased post
liberalization between the Public & Private companies of India and foreign MNC’s. In tractor
manufacturing Indian firms leads the market share (89%) in 2011, in seeds market the market is
evenly distributed between the three, while in the other market the market is less skewed towards
the foreign players.
Especially noticeable is the Cotton production and the corporate players engaged in it.
Murgukar(2007) et. al. noted that Private sector has grown rapidly in the period 1997-2007. The
area, volume and value under proprietary hybrid cotton seeds have increased over the years while
the corresponding under public hybrids have come down. With Bt-cotton, the cotton-seed industry
holds within itself a seed and a technology market. The technology market- i.e. the upstream
activities in cotton is characterized by the monopoly of MMB- Monsanto Mahyco Biotech which
licenses its Bt genes product to almost all cotton seed companies. MMB sets Bt seed prices as high
as four times the price of non-Bt hybrids. There is competition in the seed market among limited
bunch of major firms namely- Monsanto Mahyco of US, Rasi seeds & Nuziveedu Seeds
Limited(NSL) seed companies of Indian origin. Though private firms engaged in downstream
activites of distribution, marketing etc. has increased over the years, and concentration measured
by HHI- Herfindahl Hirschman Index and Mobility index is lower than that in global market, the
price of proprietary seeds has increased over the years.
</div>
<span class='text_page_counter'>(14)</span><div class='page_container' data-page=14>
Subhash (2017) et. al. studies the Pesticides industry in India, he recognizes that the data of
production, consumption of chemical pesticides is difficult to reconcile, and hence only a vague
picture of corporate involvement in Indian market can be formed. Pesticides use has increased in
India especially since 2009-10, in the year pesticide consumption increased to 0.29 kg/ha which is
50 per cent more than that in the year 2009-10. The per-hectare pesticides use in India stands at
0.29 kg/ha (of gross cropped area) which is much lower than countries like China at 13.06 kh/ha,
Japan- 11.85 kg/ha etc. The category Pesticides include Insecticides, Fungicides and Herbicides.
Insecticides form the highest share out of total pesticides used in India, though their total share has
come down over the years as use of fungicides has increased. The firms engaged in Pesticides
relies on heavy import from the industry giants of Germany’s Bayers and China’s Chemchina. The
author notes that though 6000 companies are engaged in this industry in India, and the
concentration by the top-4 is 19% in 2014-15, while that of top-8 is 28 per cent, still there is a need
to promote competition in pesticide industry so as to reduce pesticides prices.
</div>
<span class='text_page_counter'>(15)</span><div class='page_container' data-page=15>
most of the country and are in the process of being merged, despite widespread agitation from
farmer groups, NGOs, parliamentarian etc. These big corporates bend rules, find loopholes in the
regulation law and use it to their advantage.
<b>Concentration in Corporates, sourcing output from the Agriculture Sector </b>
In this section, we go into the details of the corporate sector; the companies comprising it, the
range of products they deal in, the nature of their organization- foreign, private & public. The
objective of this section is to gauge the concentration in corporates, sourcing their input
requirements from agricultural sector to produce their output such as processed food products,
beverages etc. To fulfil this objective, we use the Prowess Database of CMIE- Centre for
Monitoring Indian Economy for the time period 2007-16, so as to trace out the growth in
concentration in this short span of last decade.
</div>
<span class='text_page_counter'>(16)</span><div class='page_container' data-page=16>
TABLE 1.) Market share of 21 large cos dominating food manufacturing sector
S. no. Co. Name Market share= sales/total sales( in percentage) (in percentage)
Mar
2007
Mar
-2008
Mar
-2009
Mar
-2010
Mar
-2011
Mar
-2012
Mar
-2013
Mar
-2014
Mar
-2015
Mar
-2016
1
Adani
Wilmar
Ltd.
1.61 1.66 2.45 2.13 2.70 3.29 3.13 2.37 2.26 2.72
2 Allanasons
Pvt. Ltd.
1.50 1.43 1.47 1.29 1.51 1.62 1.69 1.67 1.61 1.68
3
Bajaj
Hindusthan
Sugar Ltd.
1.12 0.92 0.70 1.03 1.60 1.21 1.50 1.10 0.71 0.75
4
Cotton
Corporatio
n Of India
Ltd.
1.08 0.80 2.09 2.92 0.88 0.47 0.43 0.78 0.74 2.16
5
Godfrey
Phillips
India Ltd.
0.97 0.89 0.96 0.91 0.97 0.92 0.80 0.67 0.68 0.66
6
Gokul
Refoils &
Solvent
Ltd.
0.95 1.00 1.15 0.98 1.43 1.78 1.26 1.01 0.89 0.25
7
Gujarat Co
-Op. Milk
Mktg.
Fedn. Ltd.
2.59 0.00 0.00 2.78 3.09 0.00 0.00 0.00 0.00 0.00
8
Hindustan
Coca Cola
Beverages
Pvt. Ltd.
</div>
<span class='text_page_counter'>(17)</span><div class='page_container' data-page=17>
9 I T C Ltd. 11.86 10.5
0
9.79 9.17 9.74 9.62 9.21 7.52 7.65 7.98
10 Nestle India
Ltd.
1.79 1.78 1.88 1.82 2.02 2.10 1.88 1.50 1.54 1.30
11
Parle
Biscuits
Pvt. Ltd.
0.85 0.76 0.89 0.00 0.00 0.00 0.00 0.96 1.02 1.09
12
Pepsico
India
Holdings
Pvt. Ltd.
1.47 1.37 0.00 0.00 0.00 0.00 0.00 1.29 1.38 1.01
13 Ruchi Soya
Inds. Ltd.
5.22 5.39 5.12 4.69 5.26 7.11 5.72 3.89 4.25 4.22
14
Triveni
Engineerin
g & Inds.
Ltd.
1.25 0.83 0.83 0.81 0.56 0.52 0.71 0.52 0.32 0.31
15
United
Breweries
Ltd.
0.90 0.97 1.04 1.03 1.45 1.58 1.43 1.16 1.25 1.48
16 United
Spirits Ltd.
2.84 2.70 3.15 3.20 4.06 4.39 4.13 3.33 3.13 3.60
17
Britannia
Industries
Ltd.
1.45 1.28 1.36 1.21 1.36 1.37 1.25 1.02 1.11 1.22
18
Cargill
India Pvt.
Ltd.
0.00 0.00 0.00 0.00 0.00 0.00 0.00 1.21 1.02 1.09
19
Karnataka
State
Beverages
Corpn.
Ltd.
</div>
<span class='text_page_counter'>(18)</span><div class='page_container' data-page=18>
20
Mother
Dairy Fruit
&
Vegetables
Pvt. Ltd.
0.00 0.00 0.00 0.00 0.00 0.00 0.00 1.02 1.05 1.10
21
Pernod
Ricard
India Pvt.
Ltd.
0.00 0.00 0.00 0.00 0.00 0.00 0.00 1.39 1.56 1.89
<b>TOTAL </b> <sub>37</sub><sub>.46 32.2</sub>
9
32.8
9
33.9
6
36.6
3
36.0
0
36.5
3
36.5
8
36.6
6
39.4
9
Source: Prowess Database
<b>Table 2) Profit share of 21 large cos dominating food manufacturing sector </b>
S. no. Co. Name Profit share= Profit/total Profit (in percentage)
Mar
2007
Mar
-2008
Mar
-2009
Mar
-2010
Mar
-2011
Mar
-2012
Mar
-2013
Mar
-2014
Mar
-2015
Mar
-2016
1 Adani
Wilmar
Ltd.
0.08 0.51 0.60 0.15 0.05 0.06 0.44 0.03 0.42 0.31
2 Allanasons
Pvt. Ltd.
0.23 0.15 0.33 0.29 0.32 0.37 0.48 1.07 1.09 0.79
3 Bajaj
Hindusthan
Sugar Ltd.
0.49 -0.99 1.46 0.34 0.12 -1.41 -5.45 -6.71 -5.41 -0.44
4 Cotton
Corporatio
n Of India
Ltd.
0.25 0.32 0.77 0.08 -0.01 -0.80 0.14 0.18 0.13 0.07
5 Godfrey
Phillips
India Ltd.
</div>
<span class='text_page_counter'>(19)</span><div class='page_container' data-page=19>
6 Gokul
Refoils &
Solvent
Ltd.
0.39 0.74 0.25 0.39 0.49 -0.61 0.03 0.03 0.06 0.01
7 <sub>Gujarat Co</sub><sub></sub>
-Op. Milk
Mktg.
Fedn. Ltd.
0.23 0.00 0.00 0.21 0.20 0.00 0.00 0.00 0.00 0.00
8 Hindustan
Coca Cola
Beverages
Pvt. Ltd.
0.00 0.00 0.00 0.00 1.07 1.64 1.00 0.86 1.19 0.62
9 <sub>I T C Ltd</sub><sub>. </sub> <sub>41</sub><sub>.32 41.2</sub>
2
34.48 36.9
6
39.1
9
38.8
0
38.3
1
56.3
2
69.2
5
51.3
5
10 Nestle India
Ltd.
5.01 5.63 5.51 5.62 6.17 6.05 5.66 7.53 8.93 3.00
11 Parle
Biscuits
Pvt. Ltd.
1.16 1.73 1.01 0.00 0.00 0.00 0.00 1.44 1.62 1.32
12 Pepsico
India
Holdings
Pvt. Ltd.
-0.02 0.25 0.00 0.00 0.00 0.00 0.00 -1.15 -0.74 -0.28
13 Ruchi Soya
Inds. Ltd.
1.61 2.20 1.04 1.64 1.63 0.97 1.06 0.13 0.23 -4.49
14 Triveni
Engineerin
g & Inds.
Ltd.
0.87 1.31 1.73 0.72 0.04 -0.38 -0.59 -0.73 -0.90 -0.03
15 United
Breweries
Ltd.
</div>
<span class='text_page_counter'>(20)</span><div class='page_container' data-page=20>
16 United
Spirits Ltd.
6.48 4.34 3.28 3.33 3.13 2.20 1.73
-21.9
9
-9.50 0.92
17 Britannia
Industries
Ltd.
1.22 2.08 1.65 0.74 1.00 1.10 1.19 2.39 4.35 4.09
18 Cargill
India Pvt.
Ltd.
0.00 0.00 0.00 0.00 0.00 0.00 0.00 -0.69 -0.05 0.20
19 Karnataka
State
Beverages
Corpn.
Ltd.
0.00 0.00 0.00 0.00 0.00 0.00 0.17 0.23 0.24 0.15
20 Mother
Dairy Fruit
&
Vegetables
Pvt. Ltd.
0.00 0.00 0.00 0.00 0.00 0.00 0.00 0.03 0.32 0.83
21 Pernod
Ricard
India Pvt.
Ltd.
0.00 0.00 0.00 0.00 0.00 3.84 3.61 5.47 6.61 5.91
61.82 61.8
5
54.01 52.4
2
55.9
3
53.9
1
49.6
1
47.0
2
81.0
5
66.8
0
Source: Prowess Database
</div>
<span class='text_page_counter'>(21)</span><div class='page_container' data-page=21>
Corpn. Ltd., Mother Dairy Fruit & Vegetables Pvt. Ltd., Pernod Ricard India Pvt. Ltd. having a
market share of 0% in 2007 but have a market share greater than 1% each in 2016 revealing the
dynamic environment in which this sector and economy works. Though the data is not up to date.
Even on the available data an idea of the size of market and changes in it, can be formed through
these exercises. It is important to understand that acquiring a market share of 1% or greater is a
big achievement as we are here talking about the whole Agri-manufacturing sector comprising of
diverse industries within it. We will look at the industry wise break-up in the exercises following
this one. Some of them like Cargill are foreign MNC’s and some other cos. like Hindustan coca
cola simply used to operate with a different name or didn’t had its data updated on prowess
database. Table 2 furthers the point of concentration in profit accounted by these companies which
command a disproportional market share as shown in Table 1.
The nature of the firms and these firms and the product they deal in are shown in table 3).
Table 3) Foreign, Private, PSU etc.; nature of the dominant 21 firms and the product they deal in
S. no. Name of the
Company
Nature- foreign,
Private, PSU,
Cooperative
etc.
Range of Products dealt in
1 Adani
Wilmar
Ltd.
MNC an Indian
Private co. The
Adani group
was estd. in
1988
<b>Resources, logistics, energy, agriculture, real estate </b>
<b>and financial service </b>
2 Allanasons
Pvt. Ltd.
MNC an Indian
Private co. The
allana group
was estd. in
1865
Frozen Buffalo Meat, Chilled Vacuum Packed
Buffalo Meat, Frozen Buffalo Offal, Chilled Lamb
Carcasses, Spices Products, Coffee Beans, Fruits
Pulps & Concentrates etc.
3 Bajaj
Hindusthan
Sugar Ltd.
MNC an Indian
Private co. Part
of the Bajaj
group was
founded in
1931
</div>
<span class='text_page_counter'>(22)</span><div class='page_container' data-page=22>
4 Cotton
Corporation
Of India
Ltd.
CCI is a
Government of
India agency,
incoporated in
1970
Export, Trade and procurement of cotton
5 Godfrey
Phillips
India Ltd.
MNC of Indian
origin-founded
in l930s -
flagship
company of
<b>Modi Group </b>
Tobacco, agri-business, specialty chemicals, retail,
lifestyle, education and FMCG; defining Group
today
6 Gokul
Refoils &
Solvent Ltd.
Indian
company of
Gokul groups
1992, MNC of
Indian origin
Edible oils such as Soya bean oil, Cottonseed oil,
Palm oil (Palmolein), Sunflower oil, Mustard oil,
Groundnut oil, Vanaspati and Industrial oils such as
Castor Oil
7 Gujarat
Co-Op. Milk
Mktg. Fedn.
Ltd.
Indian
Co-operative set-up
by the NDDB
in 1965
Milk Bread Spreads, Cheese, UHT Milk, Beverage
Range, Amul PRO, Ice Cream, Paneer, Dahi, Ghee,
Milk Powders, Mithai Range, Mithai Mate,
Chocolates, Lactose Free Milk, Fresh Cream, Amul
Sour Cream, Pouch Butter Milk, Amul Cattle Feed
etc.
8 Hindustan
Coca Cola
Beverages
Pvt. Ltd.
Founded 1992,
Wholly-Owned
Subsidiary of
the MNC,
Coca-Cola
Company, USA
estd. in 1886
Coca-Cola, Diet Coke, Thums Up, Sprite, Fanta,
Limca, Kinley, Soda, Schweppes, Tonic Water.
Still Beverages – Maaza, Minute Maid, Pulpy
Orange, Minute Maid, Nimbu Fresh, Minute Maid
100% Juices (Apple, Grapes, Orange, Mixed Fruit),
Minute Maid range of fruit flavoured drinks. Water
- Kinley, Bonaqua etc.
9 I T C Ltd. Formed in
1910, an India
based MNC
Fast-Moving Consumer Goods (FMCG), Hotels,
Paperboards & Packaging, Agri Business &
Information Technology
10 Nestle India
Ltd.
Foreign MNC
Founded in
1866,
incorporated as
Nestlé S.A.
(Société
Anonyme)
</div>
<span class='text_page_counter'>(23)</span><div class='page_container' data-page=23>
11 Parle
Biscuits
Pvt. Ltd.
Indian private
limited
company,
founded in
1929 by
Chauhan family
Deals in Biscuits under the brand Parle-G,
KrackJack, Monaco, Kreams, Golden Arcs, Parle
Marie, Milk Shakti, Parle Hide & Seek Bourbon,
Parle Hide & Seek Fab, Top, Parle Gold Star,
Happy Happy, 20-20, simply good, Namkeen parle
magix, coconut, cheeselings, Parle-G Gold. Sweet
confectionery under brands like Melody, Mango
Bite, Poppins, 2 in 1 Eclairs, Mazelo, Kismi Toffee
Bar, Londonderry, Kaccha Mango Bite. Snacks
under brands like Mexitos Nachos, Parle's Wafers,
Fulltoss, Parle Namkeens, Parle rusk, Parle Cake.
12 Pepsico
India
Holdings
Pvt. Ltd.
U.S. based
MNC, founded
in 1965
largest MNC food and beverage businesses in the
country. PepsiCo, Inc. is an
American multinational food, snack, and beverage
corporation it deals in the arena of manufacturing,
marketing, and distribution of grain-based snack
foods, beverages, and other products. Its brand
includes: Pepsi, Diet Pepsi, Mountain Dew, Lay's,
Gatorade, Tropicana, 7 Up, Doritos, Brisk, Quaker
Foods, Cheetos, Mirinda, Ruffles, Aquafina, Naked,
Kevita, Propel, Sobe, H2oh, Sabra, Starbucks
(ready to Drink Beverages), Pepsi Max, Tostitos,
Mist Twst, Fritos etc.
13 Ruchi Soya
Inds. Ltd.
Public limited
co., an Indian
Conglomerate
part of Ruchi
group
Manufacture and sale of edible oils, vanaspati,
bakery fats, and soya food primarily in India. It also
offers soya chunks, granules, and soya flour
products. Wide range of food products include
cooking oils, soya foods, vanaspati and bakery fats.
The edible oil range holds a number of brands
including Mahakosh, which is an umbrella brand
containing Soyabean oil, Cottonseed oil, Groundnut
oil; Ruchi Gold Palmolein and Ruchi Gold Mustard
oil; Nutrela oils, namely Nutrela Soyabean oil,
Nutrela Mustrad oil, Nutrela Sunflower oil, Nutrela
Groundnut oil and Nutrela Rice Bran oil; and
Sunrich sunflower oil. Nutrela is the largest selling
soya foods brand in the country, with more than
50% market share
14 Triveni
Engineering
& Inds. Ltd.
Indian based
co. part of
Triveni group
</div>
<span class='text_page_counter'>(24)</span><div class='page_container' data-page=24>
15 United
Breweries
Ltd.
Indian
conglomerate
co estd in 1857
by scotsmen
and is owned
by UBHL and
heineken
international
Beverages, aviation and investments in various
sectors. The company markets beer under the
Kingfisher brand and owns various other brands of
alcoholic beverages.
16 United
Spirits Ltd.
Indian
alcoholic
beverage co.
subsidiary of
Diageo(54.8%),
Alcohol,the world's second-largest spirits company
by volume
17 Britannia
Industries
Ltd.
Estd. in 1892
and is a part of
Wadia group,
founded by
Nusli wadia.
Manufacture and sale of biscuits, bread, rusk, cakes
and dairy products, sells its Britannia and Tiger
brands of biscuit throughout India
18 Cargill
India Pvt.
Ltd.
foreign based
MNC,
Cargill-family in 1865
Processes, refines and markets a wide range of both
indigenous and imported edible oils, fats and blends
to the food industry including Sweekar, Nature
Fresh, Gemini, Rath and sunflower and Shakti
brands of Edible Oil, Chalki fresh atta in India by
the brand name "Sampoorna”. Cargill developed
some of these brands like Naturefresh but acquired
most of them like sunflower oil, rath, gemini,
sweekar refined oil, Leonardo brand of olive oil.
19 Karnataka
State
Beverages
Corpn. Ltd.
public sector
company
owned by the
Government of
Kerala
has a monopoly over wholesale and retail vending
of alcohol in Kerala
20 Mother
Dairy Fruit
&
Vegetables
Pvt. Ltd.
Commissioned
in 1974 as a
wholly owned
subsidiary of
the NDDB
Dealing in Brands like Mother Dairy, Safal, Dhara,
Dailycious etc
21 Pernod
Ricard
Pernod Ricard
is a French
company
</div>
<span class='text_page_counter'>(25)</span><div class='page_container' data-page=25>
India Pvt.
Ltd.
Founded in
1975, France
(including brands like Chivas Regal), along with
many other holdings
Source: The official website of each company
It is notable that most of these major players in the market are of Indian origin starting as family
group, others are either cooperatives, government undertaking, or are companies of foreign
descent. The Foreign companies too are a part of a particular family business group which
established itself either in 19th or 20th century. If we look at the nature of these firms in terms of
product manufactured and the place of incorporation, we find that most of these are conglomerates
i.e. have simultaneous engagement in diverse set of often unrelated business, of foreign or Indian
origin. Column 3 that shows the nature of these firms-foreign, private, public reveals that out of
these 21 firms 5 are of Foreign descent, 4 are cooperatives or are under government control, 12
are companies of Indian origin. Even from the firms from Indian descent only 2 firms have
established themselves after 1980s and 4 are cooperatives and government companies. The rest
are Indian firms established as family houses before independence or are their foreign MNC
counterparts.
</div>
<span class='text_page_counter'>(26)</span><div class='page_container' data-page=26>
It is important to understand that Agri-manufacturing segment of the corporates is a big category,
we can get an idea of product wise concentration of companies by the product wise sub-category
of products given in the prowess database. The Agri-Manufacturing category in the data set contain
2653 companies, the category Agri-Manufacturing contains further sub categories namely 1) Food
products, 2) Tobacco products, 3) Floriculture, 4) Other agricultural products. The category food
products further contain 7 sub-categories namely, (1.1) dairy companies -containing 140
companies, (1.2) Tea cos. contain 233 companies, (1.3) Coffee cos. contains 30 companies, (1.4)
Sugar cos. containing 227 cos, (1.5) Vegetable Oils and products containing 402 companies, (1.6)
beer and alcohol containing 160 cos., (1.7) other food products containing 703 companies. We
undertake a closer inspection of these sub-categories of Agri-Manufacturing industries to check
for concentration and the extent of the same.
</div>
<span class='text_page_counter'>(27)</span><div class='page_container' data-page=27>
Table 4) Dominant food Product Companies
Dominant food Product Companies <sub>Mar</sub><sub>-07 </sub> <sub>Mar</sub><sub>-16 </sub>
S.no. Company Name market
share (%)
market
share (%)
1 <sub>Adani Wilmar Ltd</sub><sub>. </sub> <sub>2</sub><sub>.14 </sub> <sub>3</sub><sub>.49 </sub>
2 <sub>Bajaj Hindusthan Sugar Ltd</sub><sub>. </sub> <sub>1</sub><sub>.49 </sub> <sub>0</sub><sub>.96 </sub>
3 <sub>Allanasons Pvt</sub><sub>. Ltd. </sub> <sub>2</sub><sub>.00 </sub> <sub>2</sub><sub>.15 </sub>
4 <sub>Balaji Distilleries Ltd</sub><sub>. [Merged] </sub> <sub>1</sub><sub>.24 </sub> <sub>0</sub><sub>.00 </sub>
5 <sub>Balrampur Chini Mills Ltd</sub><sub>. </sub> <sub>1</sub><sub>.19 </sub> <sub>0</sub><sub>.56 </sub>
6 <sub>Britannia Industries Ltd</sub><sub>. </sub> <sub>1</sub><sub>.93 </sub> <sub>1</sub><sub>.57 </sub>
7 <sub>Cargill Foods India Ltd</sub><sub>. [Merged] </sub> <sub>0</sub><sub>.72 </sub> <sub>0</sub><sub>.00 </sub>
8 <sub>Glaxosmithkline Consumer Healthcare Ltd</sub><sub>. </sub> <sub>1</sub><sub>.00 </sub> <sub>0</sub><sub>.90 </sub>
9 <sub>Gokul Refoils & Solvent Ltd</sub><sub>. </sub> <sub>1</sub><sub>.27 </sub> <sub>0</sub><sub>.32 </sub>
10 <sub>Gujarat Ambuja Exports Ltd</sub><sub>. </sub> <sub>1</sub><sub>.14 </sub> <sub>0</sub><sub>.55 </sub>
11 <sub>Gujarat Co</sub><sub>-Op. Milk Mktg. Fedn. Ltd. </sub> <sub>3</sub><sub>.44 </sub> <sub>0</sub><sub>.00 </sub>
12 <sub>Marico Ltd</sub><sub>. </sub> <sub>1</sub><sub>.11 </sub> <sub>0</sub><sub>.96 </sub>
13 <sub>Nestle India Ltd</sub><sub>. </sub> <sub>2</sub><sub>.38 </sub> <sub>1</sub><sub>.67 </sub>
14 <sub>Parle Biscuits Pvt</sub><sub>. Ltd. </sub> <sub>1</sub><sub>.14 </sub> <sub>1</sub><sub>.39 </sub>
15 <sub>Pepsico India Holdings Pvt</sub><sub>. Ltd. </sub> <sub>1</sub><sub>.95 </sub> <sub>1</sub><sub>.29 </sub>
</div>
<span class='text_page_counter'>(28)</span><div class='page_container' data-page=28>
17 <sub>Sabmiller India Ltd</sub><sub>. </sub> <sub>1</sub><sub>.11 </sub> <sub>0</sub><sub>.77 </sub>
18 <sub>Suguna Foods Pvt</sub><sub>. Ltd. </sub> <sub>1</sub><sub>.18 </sub> <sub>1</sub><sub>.14 </sub>
19 <sub>Tata Global Beverages Ltd</sub><sub>. </sub> <sub>0</sub><sub>.85 </sub> <sub>0</sub><sub>.59 </sub>
20 <sub>Triveni Engineering & Inds</sub><sub>. Ltd. </sub> <sub>1</sub><sub>.66 </sub> <sub>0</sub><sub>.39 </sub>
21 <sub>United Breweries Ltd</sub><sub>. </sub> <sub>1</sub><sub>.20 </sub> <sub>1</sub><sub>.90 </sub>
22 <sub>United Spirits Ltd</sub><sub>. </sub> <sub>3</sub><sub>.78 </sub> <sub>4</sub><sub>.61 </sub>
23 <sub>Cargill India Pvt</sub><sub>. Ltd. </sub> <sub>0</sub><sub>.00 </sub> <sub>1</sub><sub>.39 </sub>
24 <sub>Hindustan Coca Cola Beverages Pvt</sub><sub>. Ltd. </sub> <sub>0</sub><sub>.00 </sub> <sub>2</sub><sub>.10 </sub>
25 <sub>Karnataka State Beverages Corpn</sub><sub>. Ltd. </sub> <sub>0</sub><sub>.00 </sub> <sub>4</sub><sub>.29 </sub>
26 <sub>Kwality Ltd</sub><sub>. </sub> <sub>0</sub><sub>.12 </sub> <sub>1</sub><sub>.11 </sub>
27 <sub>Mother Dairy Fruit & Vegetables Pvt</sub><sub>. Ltd. </sub> <sub>0</sub><sub>.00 </sub> <sub>1</sub><sub>.41 </sub>
28 <sub>Pernod Ricard India Pvt</sub><sub>. Ltd. </sub> <sub>0</sub><sub>.00 </sub> <sub>2</sub><sub>.42 </sub>
Total <sub>40</sub><sub>.99 </sub> <sub>43</sub><sub>.34 </sub>
Source: Prowess Database
<b>We start by looking at the sub-category of food products by looking at 1.1)</b> Dairy companies. The
prowess database records 140 companies engaged in manufacturing dairy products. Table 5 shows
that out of these 140 companies we find that only 7 companies command a market share of 68%
(approx.) with a corresponding share in profit of 69%(approx.) and asset share of 58%(approx.).
</div>
<span class='text_page_counter'>(29)</span><div class='page_container' data-page=29>
Table 5) Dominant Dairy cos.
Dominant Dairy cos. Mar-07 Mar-16
S. no. Company Name sales/total
sales (%)
sales/total
sales (%)
1 <sub>Sterling Agro Inds</sub><sub>. Ltd </sub> <sub>5</sub><sub>.42 </sub> <sub>2</sub><sub>.64 </sub>
2 <sub>Gujarat Co</sub><sub>-Op. Milk Mktg. </sub>
Fedn. Ltd.
40.88 0.00
3 <sub>Hatsun Agro Products Ltd</sub><sub>. </sub> <sub>5</sub><sub>.65 </sub> <sub>7</sub><sub>.78 </sub>
4 <sub>Heritage Foods Ltd</sub><sub>. </sub> <sub>3</sub><sub>.33 </sub> <sub>5</sub><sub>.38 </sub>
5 <sub>Kwality Ltd</sub><sub>. </sub> <sub>1</sub><sub>.44 </sub> <sub>12</sub><sub>.76 </sub>
6 Mother Dairy Fruit &
Vegetables Pvt. Ltd.
0.00 16.17
7 Glaxosmithkline Consumer
Healthcare Ltd.
11.89 10.32
Total <sub>68</sub><sub>.60 </sub> <sub>55</sub><sub>.05 </sub>
Source: Prowess Database
</div>
<span class='text_page_counter'>(30)</span><div class='page_container' data-page=30>
(the NOVA brand) in 2016. The research again is constrained by the limitations imposed by the
absence of database in 2016 and other intermittent period for Amul and other brands.
<b>1.2) Tea companies: Comprises of 233 companies. As shown in Table 6, this sector is dominated </b>
by just seven (7) companies namely A V Thomas & Co. Ltd., Amalgamated Plantations Pvt. Ltd.,
Goodricke Group Ltd., Gujarat Tea Processors & Packers Ltd., Jay Shree Tea & Inds. Ltd.,
Mcleod Russel India Ltd., Tata Global Beverages Ltd. Tata group is dominating throughout the
last decade with a sales share of more than 25% and profit share of 62.5%(approx.) in 2016.
Mcleod russel is the second dominant player in the market share with market share of
12.5%(approx.) exactly half than that of Tata’s.
Table 6) Tea cos and its giants
Tea cos and its giants <sub>Mar</sub><sub>-07 </sub> <sub>Mar</sub><sub>-16 </sub>
S. no. Company Name Sales/total sales (%) Sales/total sales (%)
1 <sub>A V Thomas & Co</sub><sub>. Ltd. </sub> <sub>4</sub><sub>.91 </sub> <sub>5</sub><sub>.60 </sub>
2 <sub>Amalgamated Plantations Pvt</sub><sub>. </sub>
Ltd.
0.00 4.79
3 <sub>Goodricke Group Ltd</sub><sub>. </sub> <sub>4</sub><sub>.47 </sub> <sub>6</sub><sub>.27 </sub>
4 Gujarat Tea Processors & Packers
Ltd.
5.00 8.38
</div>
<span class='text_page_counter'>(31)</span><div class='page_container' data-page=31>
6 <sub>Mcleod Russel India Ltd</sub><sub>. </sub> <sub>12</sub><sub>.42 </sub> <sub>12</sub><sub>.70 </sub>
7 <sub>Tata Global Beverages Ltd</sub><sub>. </sub> <sub>21</sub><sub>.19 </sub> <sub>25</sub><sub>.17 </sub>
Total <sub>52</sub><sub>.89 </sub> <sub>68</sub><sub>.87 </sub>
Source: Prowess database
It is clear from Table 6, that Tata tea is the dominant player in this segment. We can note that all
of these players were well established in 20th and 19th century and are dominating not only in India
but the world as well. With tata’s owning AGM as well as Tata brand, and as a house Tata’s &
Birla’s are some of the dominated family group whereas in the MNC’s from foreign patron’s front
Williamson Magor Group and Goodricke Group are dominating this industry.
</div>
<span class='text_page_counter'>(32)</span><div class='page_container' data-page=32>
Table 7) Dominant Coffee cos.
Dominant Coffee
cos.
Mar-07 Mar-16
S. No. Company name Sales/ Total
Sales (%)
Sales/ Total
Sales (%)
1 C C L Products
(India) Ltd. 35.01 41.88
2 Nedcommodities
India Pvt. Ltd.
15.71 12.66
3 <sub>Tata Coffee Ltd</sub><sub>. </sub> <sub>42</sub><sub>.94 </sub> <sub>43</sub><sub>.41 </sub>
Total <sub>93</sub><sub>.65 </sub> <sub>97</sub><sub>.95 </sub>
Source: Prowess Database
We can note from table 7, that Tata group dominates not just in tea segment but also in Coffees.
We already know that it produces product ranging from Salt to Jaguar Car, and it started its
operation in Steel company. It just substantiates our point of concentration of conglomerates of
incumbent firms diversifying their operations.
<b>1.4) Next, we take up the sugar companies, according to prowess there are 227 companies in </b>
sugar industry and in these as table 8, shows only 5 companies had 28% of the market share in
2007 ,whose market share increased to 36%(approx.) in 2016.
</div>
<span class='text_page_counter'>(33)</span><div class='page_container' data-page=33>
Table 8) Dominant Sugar companies
Dominant Sugar companies <sub>Mar</sub><sub>-07 </sub> <sub>Mar</sub><sub>-16 </sub>
S.
no.
Company Name <sub>sales</sub><sub>/total sales </sub>
(%)
sales/total sales
(%)
1 <sub>Bajaj Hindusthan Sugar Ltd</sub><sub>. </sub> <sub>7</sub><sub>.79 </sub> <sub>9</sub><sub>.78 </sub>
2 <sub>Balrampur Chini Mills Ltd</sub><sub>. </sub> <sub>6</sub><sub>.23 </sub> <sub>5</sub><sub>.71 </sub>
3 <sub>E I D</sub><sub>-Parry (India) Ltd. </sub> <sub>2</sub><sub>.46 </sub> <sub>5</sub><sub>.40 </sub>
4 <sub>Shree Renuka Sugars Ltd</sub><sub>. </sub> <sub>3</sub><sub>.21 </sub> <sub>11</sub><sub>.95 </sub>
5 <sub>Triveni Engineering & Inds</sub><sub>. </sub>
Ltd.
8.63 4.01
Total <sub>28</sub><sub>.31 </sub> <sub>36</sub><sub>.86 </sub>
Source: Prowess Database
Note about the companies engaged in Sugar industry: -
1) Bajaj Hindusthan Sugar Ltd.: BHL of Bajaj group company and is a sugar producer in
India founded in 1931 by Jamnalal Bajaj and is one of the largest sugar producers in the
country and the world. The company is headquartered in Mumbai, India.
</div>
<span class='text_page_counter'>(34)</span><div class='page_container' data-page=34>
3) E I D-Parry (India) Ltd.:. Founded in 1788, ‘Parry’ has been a household name for over
225 years. The Company holds the distinction of setting up India’s first sugar plant at
Nellikuppam in 1842 and even today continues to pioneer new paths in each of its
businesses. founded in 1900, the Murugappa Group is an Indian business conglomerate,
founded, managed, and largely owned by the Murugappa family. They have presence in
several segments including abrasives, auto components, bicycles, sugar, farm inputs,
fertilizers, plantations, bioproducts and nutraceuticals.
4) Shree Renuka Sugars Ltd.: Shree Renuka Sugars is a global agribusiness and bio-energy
corporation. The Company is one of the largest sugar producers in the world, the leading
manufacturer of sugar in India, and one of the largest sugar refiners in the world engaged
in sugar, ethanol and power generation. Founded in 1998.
5) Triveni Engineering & Inds. Ltd.: Indian based co. part of Triveni group. Engaged in Sugar
production, water treatment, steam turbines, gears manufacturer, sugar exporter, gears
supplier, sugar producer India, gearboxes manufacturer, waste water treatment from India.
One of the three leading producers of sugar in India.
From the above we can see the diverse nature of companies engaged in sugar processing, their
conglomerate nature, family-business organization and dominance in the respective products.
</div>
<span class='text_page_counter'>(35)</span><div class='page_container' data-page=35>
2016. Other than Ruchi Group, Adani Group and Gokul Group also has a substantial market share
in this sector.
Table 9) Dominant companies in vegetables oils and products segment
Dominant companies in
vegetables oils and products
segment
Mar-07 Mar-16
Company Name <sub>sales</sub><sub>/total sales (%) </sub> <sub>sales</sub><sub>/total sales (%) </sub>
1. Adani Wilmar Ltd. 7.32 14.26
2 <sub>Cargill India Pvt</sub><sub>. Ltd. </sub> <sub>0</sub><sub>.00 </sub> <sub>5</sub><sub>.75 </sub>
3 <sub>Gokul Refoils & Solvent Ltd</sub><sub>. </sub> <sub>4</sub><sub>.32 </sub> <sub>1</sub><sub>.32 </sub>
4 <sub>J V L Agro Inds</sub><sub>. Ltd. </sub> <sub>1</sub><sub>.91 </sub> <sub>3</sub><sub>.30 </sub>
5 <sub>Marico Ltd</sub><sub>. </sub> <sub>3</sub><sub>.80 </sub> <sub>3</sub><sub>.92 </sub>
6 <sub>Ruchi Soya Inds</sub><sub>. Ltd. </sub> <sub>23</sub><sub>.72 </sub> <sub>22</sub><sub>.05 </sub>
Total <sub>41</sub><sub>.08 </sub> <sub>50</sub><sub>.60 </sub>
Source: Prowess Database
</div>
<span class='text_page_counter'>(36)</span><div class='page_container' data-page=36>
Shantilal Adani in 1988 as a commodity trading business with the flagship company Adani
Enterprises Limited, earlier known as Adani Exports Limited. Its diverse businesses include
energy, resources, logistics, agribusiness, real estate, financial services, and defence, aerospace
etc. AWL as a company sells its products under the brand Fortune, various products are sold by
AWL like oil, rice, vanspati oil, soya chunk, besan etc.
JVL agro inds. Ltd. founded in 1989 : JVL Agro Industries Limited is an India-based vegetable
oil solution company elling under the Jhoola brand. The Company is engaged in the production
of vanaspati, refined oil, mustard oil, DOC and trading of good. JVL Agro Industries Limited,
formally known as Jhunjhunwala Vanaspati Limited, incorporated in the year 1989, manufactures
hydrogenated vegetable oil (Vanaspati Ghee) and refined oils, at its manufacturing facility in
Varanasi, Uttar Pradesh.
Marico: family business of Harsh maliwal by the name Bombay oil inds. Maliawal later founded
his own co. in 1991, which launched a number of brand like parachute, saffola, livon, set wel,
zatak, Hercules etc. Marico is an Indian consumer goods company providing consumer products
and services in the areas of Health and Beauty based in Mumbai.
</div>
<span class='text_page_counter'>(37)</span><div class='page_container' data-page=37>
<b> 1.6) Beer and alcohol: there are 160 companies in this industry segment. Table 10, shows that </b>
out of 160 companies only 7 dominate.
Table 10) Beer and alcohol cos.
Source: Prowess Database
The degree of concentration in this segment can be gauged by the Mergers and Acquisitions
(M&A) activities within these 7 companies. As Balaji distillers has been acquired by United spirits
in 2008. United spirit used to hold a substantial stake in united breweries which it sold to Heineken
in 2015, Heineken international is itself world’s largest brewer in terms of volume and is a majority
shareholder in United spirits.
Beer and alcohol cos. Mar-07 Mar-16
S. no. Company Name Sales/total Sales
(%)
Sales/Total
Sales (%)
1 <sub>Balaji Distilleries Ltd</sub><sub>. [Merged] </sub> <sub>9</sub><sub>.16 </sub> <sub>0</sub><sub>.00 </sub>
2 <sub>Karnataka State Beverages Corpn</sub><sub>. Ltd. </sub> <sub>0</sub><sub>.00 </sub> <sub>23</sub><sub>.45 </sub>
3 <sub>Pernod Ricard India Pvt</sub><sub>. Ltd. </sub> <sub>0</sub><sub>.00 </sub> <sub>13</sub><sub>.24 </sub>
4 <sub>Radico Khaitan Ltd</sub><sub>. </sub> <sub>5</sub><sub>.82 </sub> <sub>4</sub><sub>.59 </sub>
5 <sub>Sabmiller India Ltd</sub><sub>. </sub> <sub>8</sub><sub>.21 </sub> <sub>4</sub><sub>.12 </sub>
6 <sub>United Breweries Ltd</sub><sub>. </sub> <sub>8</sub><sub>.83 </sub> <sub>10</sub><sub>.37 </sub>
7 <sub>United Spirits Ltd</sub><sub>. </sub> <sub>27</sub><sub>.87 </sub> <sub>25</sub><sub>.22 </sub>
</div>
<span class='text_page_counter'>(38)</span><div class='page_container' data-page=38>
SABMiller an MNC dealing in brewing and beverage company based in England, until October
10th 2016 when it was acquired by Anheuser-Busch InBev. Earlier, it was the world's
second-largest brewer measured in terms of revenues. It used to sell its product under brands such as
Fosters, Miller, and Pilsner Urquell.
Radico Khaitan Ltd. (RKL), formerly Rampur Distillery & Chemical Company Ltd., is an Indian
company that manufactures industrial alcohol, Indian Made Foreign Liquor (IMFL), country
liquor and fertilizers. It is the fourth largest Indian liquor company. Selling its product under
brand name like Magic moments, 8 PM, after dark whisky, black cat etc. The M&A activities, and
the sheer number of dominant companies in this segment is itself evidence of increasing
concentration in this industry.
<b>1.7) Other food products: this category includes 704 companies, out of which there are 26 </b>
dominant companies sharing 70%(approx.) of the market share among themselves in 2007 which
reduced to 64%(approx.) in 2016. Out of these 26 companies, 9 companies were found to be
galloping 50% of the market share in 2007 which reduced to 40%(approx.) in 2016. So, we find
that only few firms dominate this segment too, as shown in table 11. Although the concentration
has somewhat reduced among the dominant 9 companies, the lost share is more or less is
distributed among the other 17 companies who have been dominating this segment from past
<b>decade. </b> <b> </b>
</div>
<span class='text_page_counter'>(39)</span><div class='page_container' data-page=39>
<b>Table 11) Dominant food products cos. </b>
Dominant food products cos. Mar-07 Mar-16
S. no. Company Name Sales/ Total
Sales (%)
Sales/ Total
Sales (%)
1 Allanasons Pvt. Ltd. 7.93 6.63
2 Britannia Industries Ltd. 7.66 4.83
3 Gujarat Ambuja Exports Ltd. 4.53 1.69
4 Mondelez India Foods Pvt. Ltd. 3.70 3.52
5 Nestle India Ltd. 9.46 5.15
6 Parle Biscuits Pvt. Ltd. 4.52 4.29
7 Pepsico India Holdings Pvt. Ltd. 7.76 3.99
8 Suguna Foods Pvt. Ltd. 4.68 3.51
9 Hindustan Coca Cola Beverages Pvt. Ltd. 0.00 6.47
Total 50.23 40.07
Source: Prowess Database
</div>
<span class='text_page_counter'>(40)</span><div class='page_container' data-page=40>
Table 12) Dominant Tobacco cos.
Dominant Tobacco cos. Mar-07 Mar-16
S. no. Company Name Sales/ Total Sales
(%)
Sales/ Total Sales
(%)
1 Dharampal Satyapal Ltd. 3.97 7.50
2 Godfrey Phillips India
Ltd.
6.59 6.34
3 I T C Ltd. 80.46 77.25
4 V S T Industries Ltd. 2.99 3.07
Total 94.01 94.16
Source: Prowess Database
<b>3) Floriculture segment: There are 60 companies in this segment. As shown in Table 13, out of 60 </b>
companies only 9 companies used to command a market share of 85.20% in 2007, which increased
to 96.95% in 2016. Further, one company namely Ramesh flowers Pvt. Ltd. commanded almost
90% of the market share in 2016. The fact that only one firm dominated almost this entire segment,
highlights the monopolistic and concentrated nature of this segment.
</div>
<span class='text_page_counter'>(41)</span><div class='page_container' data-page=41>
Table 13.) Dominant floriculture cos.
Source: Prowess Database
We find that almost in all the cases, barring a few the same companies which used to dominate in
2007 are dominating in 2016. Concentration has been increasing in all the product segments, with
clear monopolist tendencies in some product segments like Tobacco by ITC, Tea by Tata, coffee
by Tata coffees’ and CCL product ltd, Beer and Alcohol segment by United spirits etc.
S. no. Company Name Sales/
Total
Sales (%)
Sales/
Total
Sales (%)
1 C C L Flowers Ltd. 3.42 0.00
2 Deccan Florabase Ltd. 10.56 0.00
3 Pochiraju Industries Ltd. 52.78 5.01
4 Flowers Valley Pvt. Ltd. 0.00 2.83
5 Ramesh Flowers Pvt. Ltd. 0.00 89.11
6 Suvarna Florex Ltd. 3.45 0.00
7 Tanflora Infrastructure Park Ltd. 3.49 0.00
8 Vikram Greentech (India) Ltd. 3.15 0.00
9 Zygo Flowers Ltd. 8.35 0.00
</div>
<span class='text_page_counter'>(42)</span><div class='page_container' data-page=42>
Table 14.) Dominant cos. in the category other Agricultural products
Mar-07 Mar-16
S. no. Company Name Sales/ Total
Sales (%)
Sales/ Total
Sales (%)
1 A D M Agro Inds. Kota & Akola Pvt. Ltd. 3.64 0.32
2 Rei Agro Ltd. 6.58 0.72
3 Amira Pure Foods Pvt. Ltd. 2.24 3.22
4 Best Foods Ltd. 1.46 3.47
5 K R B L Ltd. 5.56 4.60
6 Sanwaria Consumer Ltd. 2.26 3.70
7 Cotton Corporation Of India Ltd. 10.78 19.28
Total 32.53 35.31
Source: Prowess Database
The same conclusion is reached in all the exercises that the concentration in Indian
agricultural-Manufacturing market and in its sub-categories is very high and the level of concentration has only
been increasing in the last decade with which this section is concerned. We can also note that
most of these dominant players are behemoths, who have sustained oil shocks, economic
depressions, regulations and are there in business since 19th & 20th century. With the advent of
21st<sub> century and new opportunities arising in the food manufacturing segment in the economy as </sub>
</div>
<span class='text_page_counter'>(43)</span><div class='page_container' data-page=43></div>
<span class='text_page_counter'>(44)</span><div class='page_container' data-page=44>
<b>Section III – Fragmentation of Agriculture sector and its </b>
<b>interlinkages with the corporate sector </b>
Source: Agriculture Census
The agriculture census-2011 gives us a concrete picture of the size-pattern of
operational-landholding in India. The census divides the operational-land holdings in 5 categories of marginal,
small, semi-medium, medium, large landowner. The figure available clearly points towards the
division of the size of operational-landholding that has taken place in India from the time of first
agriculture-census 1971 to 2011. Figure 1 illustrates this point. The large farmers owning more
than 10 ha (hectare) accounted for only 0.7% of the total agricultural-landholding in India,
compared to 4%(approx.) in 1971. There has been a phenomenal rise of Marginal farmers in India,
there share in total agricultural landholding being 50%(approx.) in 1971, which has increased to
67%(approx.) in 2011. As the above figure makes it clear there has been growth of small and
marginal farmers in India and the large and medium farmers have decreased in numbers, implying
that the size of landholding in India has followed a secularly downwards trend. This exercise
demonstrates that the agricultural-sector is scattered, unorganized and has undergone drastic
fragmentation throughout the studied period-1970-71 to 2010-11 for which data is available.
0
10
20
30
40
50
60
70
80
1970-71 1976-77 1980-81 1985-86 1900-91 1995-96 2000-01 2005-06 2010-11
Figure 1. Rise of the Marginal Holding Farmers
</div>
<span class='text_page_counter'>(45)</span><div class='page_container' data-page=45>
Sharma (1994) notes that at the time of independence semi-feudal relations-Zamindari, Mahalwari,
Ryotwari etc. in the agriculture sector were prevalent as a consequence of which the rural masses
were impoverished and agricultural production stagnated. He notes that the extent of concentration
in land owned by households remained almost unchanged throughout the period 1953-54 to 1982,
though regional inequalities in concentration of ownership of land were prevalent. If the data is
looked at from the point of view of different hierarchies of landownership a decline in the
landownership of top 1 per cent,5 per cent and 10 per cent is observed across states, which in turn
came to be owned by the middle 40-80 percent and 50-80 per cent of the household. The area
owned by bottom 40 per cent remained the same in majority of the states. During 1970’s a fairly
noticeable increase in the proportion of landless households was visible in the economy in majority
of the states. There was a simultaneous decline in the large holdings farmers and rise in the
operational holding of the marginal holding (0.01 -0.99 acre), but the area owned by
sub-marginal farmers remained low. Sharma (1994) brings an important relation to the fore in our
understanding of landholding operated and landholding owned, though the sub-marginal farmers
operated area increased their area owned didn’t witnessed a similar increase, the area owned and
operated by the middle farmer increased while that owned and operated by large farmer witnessed
a declined, the extent of landlessness in the period 1953-54 to 1982 also increased. All these
changes in the structure of land operated and owned had widespread implications in the growth of
agriculture which witnessed a decline both in relation to its previous year performance and with
respect to industrial and service sector of the economy.
Rawal(2008) in the paper “Ownership Holdings of Land in Rural India: Putting the Record
Straight” conjectures that the 48th<sub> (1992) and 59</sub>th<sub> (2003-04) round of NSSO underestimates the </sub>
</div>
<span class='text_page_counter'>(46)</span><div class='page_container' data-page=46>
The NSS 70th<sub> round on “Household Ownership and Operational Holdings in India”, in its report </sub>
571(70/18.1/1) states that the total area owned has fallen from 119.6 mha(million hectares) in
1971-72 to around 92.4 mha in 2013, a fall of approximately 23 per cent, a decline of 14 per cent
was observed in the period 2003 to 2013, the average area owned per household plunked by more
than half since 1971-72 from 1.53 ha in 1971-72 to 0.59 ha in 2013 (figures including landless
households), surprisingly the percentage of landless household also came down from 9.60 ha in
1971-72 to 7.41 ha, implying that either the household left the agricultural occupation or they came
to possess smaller pieces of land due to land reforms, hence the foreseen decline in average area
owned per household. The NSS Land holding surveys (LHS) clarify this point, as the highest
percent of households are reported as marginal households showing an increase in percentage
distribution of households from 53(approx.) percent in 1971-72 to 75.41 percent in 2013. In the
percentage distribution of area owned it is the semi-medium and medium category of household
that maintain its record of moderate growth with substantial share, 22 per cent and 19 percent
(approx.) respectively in area owned, in 2013, in sync with Sharma’s (1994) observation since
1952. It is the marginal category which accounted for maximum growth and maximum share of
29.75 percent in 2013, in the percentage area owned, highlighting the sub-division of land in
smaller plots. The percentage of large and medium holding farmers in the period 1971-72 to 2013
in area owned came down from 54 per cent to 25 per cent respectively. The inequality in land
ownership is reflected in the fact that in 2013, 75 per cent of marginal category household owned
30 per cent (approx.) of land, while 2.17 per cent of medium and large category households owned
24.64 percent of total agriculture land.
</div>
<span class='text_page_counter'>(47)</span><div class='page_container' data-page=47>
resolved in India, the state supported agriculture and industry with increasing and decreasing
degree of focus in successive five year plans due to its scarce resource base as mentioned earlier.
<b>Interlinkages between corporate and Agriculture sector </b>
</div>
<span class='text_page_counter'>(48)</span><div class='page_container' data-page=48>
Source: WIOD database, November 2016 release
On the other side, industries providing inputs and capital goods for agriculture increased in
importance even as Indian agriculture also changed and used industrial products more intensively.
Thus, the inter-linkages between agriculture and manufacturing – the importance of manufacturing
as a user of inputs produced by the agricultural sector and the use of manufactured inputs in
agriculture – have also remained strong.
The periodic publication of NAS input-output tables by the CSO and the WIOD- world input
output data – help in constructing a limited picture of trends over time in the linkages between
agriculture and industry. The NAS input-output data reveals that 13.54% of agricultural output
was used as input in the manufacturing sector in 1993-94, which increased to 19.43% by 2007-08.
The WIOD data shows that in 2000, 18.95 per cent of crop production, 26.71 per cent of forestry
and logging and 15.21 per cent of fishing output were absorbed as inputs in the manufacturing
sector. By 2014, the corresponding figures were 21.67, 29.88 and 18.63 per cent respectively.
0.00
5.00
10.00
15.00
20.00
25.00
2000 2001 2002 2003 2004 2005 2006 2007 2008 2009 2010 2011 2012 2013 2014
<b>Figure 2. Agricultural Output used as Input in </b>
<b>Manufacturing of Food & Textiles/ Total Agricultural </b>
<b>Output </b>
Agriculture o/p used as i/p in manuf of food, beverages and tobacco products /Total agriculture
crop-o/p---showing importance of agri o/p for manuf in total crop agri o/p
</div>
<span class='text_page_counter'>(49)</span><div class='page_container' data-page=49>
The input-output table available from the study of Krishna Singh and M.R. Saluja in the NCAER
working paper-WP111 “Input-output table for India-2013-14”, based on the supply and use table
(SUT) of the new GDP series, suggests that the inter-linkages between agriculture and
manufacturing may be even greater than what is indicated above. According to their estimates,
agricultural output used by manufacturing as input stood at 36.55%, of total agricultural output in
2013-14.
The wide variation in the levels between NCAER data and NAS/WIOD is due to a part of
agricultural output treated as going into private final consumption expenditure (PFCE) in the latter
is, in the NCAER data, counted as intermediate input into manufacturing which then produces the
items going into PFCE. This is made clear by table 15. As we can note from it, the distribution of
agricultural output between the part going to final consumption and that towards intermediate
consumption is more biased towards the latter in the NCAER calculations. Thus, the NCAER data
takes into account that many agricultural products go through at least some manufacturing process
before they are actually consumed.
Table 15
Share in Agricultural Output
Of:
WIOD NCAER
2014 2013-14
PFCE 55.58 46.67%
Intermediate Consumption 40.11 54.18%
Source: NAS and NCAER IO table data & concordance sheets.
</div>
<span class='text_page_counter'>(50)</span><div class='page_container' data-page=50>
manufacturing output was used as input in Agricultural sector, this figure increases to
15%(approx.) in 2014, reflecting the gradual modernization of agricultural sector. The WIOD table
also reveals that use of chemicals products as an input in agriculture has increased from
approximately 7% in 2000 to 7.5% in 2014. Highlighting greater dependence of agriculture on
manufactured products from the industrial sector.
Differences in calculation and methodology notwithstanding, the fact is that the production
interlinkages between the agriculture and industrial sector have remained strong.
<b>Conclusion </b>
A lack of affirmative action, rigid and unchanging laws in the face of loopholes in Laws relating
to Agriculture leading to creation of newer avenues for corporates investment and profits without
a change or perhaps worsening of the fortunes of farmer is leading to agriculture sector being
detrimental to the health of farmer.
</div>
<span class='text_page_counter'>(51)</span><div class='page_container' data-page=51>
intermediaries and control in the market and on farmers produce. Debt burden gets worse down
the scale, its heaviest among small and marginal farmers, with 86% of farmer and 80% of
agricultural labor household in debt.
Corporate influence in the economy has grown not only in terms of control over business assets,
market and profit share but also in terms of growing influence over the state’s economic policies.
In other word business concentration and economic concentration both increased, growth of the
former can be noted from our analysis in Section II, where we highlight the increasing
concentration in the market-share of Agri-manufacturing industries. The business concentration
can be noted by the increasing dominance in Agri-output and Agri-input market by only few large
players. The economic concentration can be noted by corporate lobbying for state’s support to
facilitate their expansion in the economy - agricultural has figured in that process, as highlighted
in Section I, both because of the deepening linkages between manufacturing and agriculture as
shown in section III. Thus, in several ways, the value generation process in the agricultural sector
and corporate profits have got linked in a way and in a context that tends to make for greater capital
penetration of the agricultural sector.
Corporate penetration in Indian agriculture has increased as is evident by growth of food
processing industries and increasing dependence of agriculture on inputs like chemicals, fertilizer
& pesticides. However, both Agri-input and Agri-output market is characterized by oligopolistic
and oligpsonistic tendencies, in concurrence with the international market trend of concentration
and consolidation. In a globalized world, where trade boundaries are obliterating geographical
boundaries, greater competition, lower prices of commodities, food security are expected. What
we note is that centrifugal forces are in operation in the headwinds of globalized world. The rise
in concentration in the Agri-input market hasn’t meant that more and more R&D is happening to
provide efficient and affordable inputs to the farmers. Corporate penetration in the
Agri-output market has not translated into increasing the wealth of farmer. The rise in concentration has
just spelled profit for the corporates.
</div>
<span class='text_page_counter'>(52)</span><div class='page_container' data-page=52>
other legislation by pointing that under liberalization the private corporate sector and the different
industries present in India have been dominated by firm’s with a “past” i.e. incumbent firms both
domestic and foreign from pre-liberalization era have consolidated their position and other
segments of society are excluded that too with the aid of the state ,in short, “cronyism” with
reference to concentration of economic power manifested itself. In our analysis of Food
manufacturing sector, the aforesaid is vindicated. Mazumdar points out the firms that established
themselves in the British era like ITC, Unilever etc., continued their dominance from the 19th
century till his studied period (2008), our study points out that such firms not only have a large
share in the food manufacturing segment but their share is actually growing in the last decade
(2007-16), with other MNC’s too capturing a sizeable share post liberalization. P. Mehta (2009)
highlights how the issue of enhancing competition has been emphasized in CA02 rather than
checking monopoly power– the MRTP Act too in its enthusiasm to check monopoly had placed a
restriction on dominance rather than its abuse thus throwing away the baby, in the form of
competition, with the bathwater. The CA02 neglects the issue of existing monopoly of private
corporates in market by focusing on competition in the market.
</div>
<span class='text_page_counter'>(53)</span><div class='page_container' data-page=53>
structural imbalance of the agriculture market consisting of pseudo-monopolist corporate sector
on one side and a weak fragmented farmer on the other.
<b>References </b>
<i>Alfaro, L., & Chari, A. (2009). India transformed? insights from the firm level 1988-2005 (No. </i>
w15448). National Bureau of Economic Research.
Athreye, S., & Kapur, S. (2006). Industrial concentration in a liberalising economy: A study of
<i>Indian manufacturing. The Journal of Development Studies, 42(6), 981-999. </i>
<i>Bagchi, A.K. (1972), Private Investment in India 1900-39 (1975 ed.). Cambridge: Cambridge </i>
university press
<i>Basant, R. (2000). Corporate response to economic reforms. Economic and Political Weekly, </i>
813-822.
<i>Cabinet committee on Economic Affairs (CCEA), GoI, (2017, May 3), Cabinet approves New </i>
<i>Central Scheme-SAMPADA (Scheme for Marine Processing and Development of </i>
<i>Agro-Processing </i> <i>Clusters), </i> [PIB release]. Retrieved from
<i>Chakravarty, S. (1998). Development planning: the Indian experience. OUP Catalogue. </i>
Ch-3, Mazumdar, S. (2015). Monopoly and Indian Industry in Chandrasekhar, C.P. (2015)
Economics Volume 1 Indian Industrialization (pp. 94-125), India: OUP
Chandrashekhar. C.P. (2016) Agribusiness: Consolidation against the farmer, frontline print
edition: oct 14, 2016 retrieved from
Das, G. (2006). The Indian model. Foreign Aff., 85, 2.
Fugile, K., Heisey P., King J. & Schimmelpfennig D. (2013). Concentration in ag input industry
influences farm technology; Amber Waves | Jan 31, 2013
GDP statistics of India retrieved from
</div>
<span class='text_page_counter'>(54)</span><div class='page_container' data-page=54>
GDP statistics of India retrieved from https
://community.data.gov.in/gdp-growth-rate-of-india-constant-prices-during-2001-02-to-2013-14/
<i>GHI-2016 </i> (Rep.). (n.d.). Retrieved August 9, 2017, from IFPRI website:
/>
Ghosh, J. (2003). Corporate agriculture: The implications for Indian farmers. Retrieved from
Goyal, S. K. (1979) Monopoly capital and public policy. New Delhi, Allied publishers
<i>HDI-2016 </i> (Rep.). (n.d.). Retrieved April 9, 2018, from UNDP website:
/>
<i>Kannan, E. (2017, June 13). Why a price increase alone won’t help farmers. The Hindu. Retrieved </i>
from />
Krishnakumar, T. (2018, May 2). Making India’s fruit processing industry globally competitive.
<i>Livemint </i> .Retrieved from
/>
Lerche, J. (2013) The Agrarian Questions in Neoliberal India: Agrarian transition bypassed?
Journal of Agrarian Change, 13(3), 382-404
Mazumdar, S. 2006. “Business Groups and Concentration in the Private Corporate Sector in
India’, unpublished thesis, Jawaharlal Nehru University, New Delhi.
———. 2008a. ‘Crony Capitalism and India: Before and After Liberalization’, Working Paper
No. 2008/04, Institute for Studies in industrial Development, New Delhi.
</div>
<span class='text_page_counter'>(55)</span><div class='page_container' data-page=55>
<i>Ministry of Agriculture & Farmer Welfare, GoI (2005, June 13). Electronic networking of APMCs </i>
<i>in </i> <i>Maharashtra </i> [PIB Release]. Retrieved from
<i>Ministry of Consumer Affairs, Food and Public Distribution, GoI, (2016, November 29). 14 States </i>
<i>deregulated Fruits and Vegetables marketing from APMC. [PIB release]. Retrieved from </i>
<i>Ministry of Agriculture & Farmer Welfare GoI, (2015, August 7), Promoting Contract Farming </i>
[PIB release]. Retrieved from
<i>Ministry of Food Processing Industries-MoFPI, GoI (2016, July 26). Status of FPI, [PIB release]. </i>
Retrieved from />
<i>Mehta, P., & Mehta, P. S. (Eds.). (2005). Towards a Functional Competition Policy for India: An </i>
<i>Overview. Academic Foundation </i>
Murugkar, M., Ramaswami, B., & Shelar, M. (2007). Competition and monopoly in Indian cotton
<i>seed market. Economic and Political weekly, 3781-3789.</i>
Nayyar, D. (2008). The internationalization of firms from India: Investment, mergers and
<i>acquisitions. Oxford Development Studies, 36(1), 111-131. </i>
NSS 70th round on “Household Ownership and Operational Holdings in India”, in its report
571(70/18.1/1) (January-December 2013)
<i>Household Ownership and Operational Holdings in India (January-December 2013, Rep. No. </i>
571(70/18.1/1)). (n.d.). NSS.
<i><b>P. Sainath (2018, July 2), “Punjab’s arthiyas: sins of commission”in PARI Retrieved from </b></i>
on April 2, 2019 at 3:06 pm.
<i>Patel, R. (2007). Stuffed and starved: Markets, power and the hidden battle for the world food </i>
<i>system. Black Inc.. </i>
</div>
<span class='text_page_counter'>(56)</span><div class='page_container' data-page=56>
Pray, C. E., & Nagarajan, L. (2014). The transformation of the Indian agricultural input industry:
<i>has it increased agricultural R&D?, Agricultural economics, 45(S1), 145-156. </i>
Raghavan, T.C.A. Sharad (2014, September 9). India’s agricultural yield suffers from low
<i>productivity </i> <i>LiveMint. </i> Retrieved <b>from </b>
<b></b>
<b> </b>
Ramaswamy, K.V. 2005, ‘State of Competition in the Indian Manufacturing Industry’, in
Pradeep S. Mehta (ed.), Towards a Functional Competition Policy for India: An Overview
, pp. 155–64. New Delhi: Academic Foundation
Rao, N. C., Pray, C. E., & Herring, R. J. (2015). Biotechnology for a second green revolution in
India: socioeconomic, political, and public policy issues.
<i>Rawal, V. (2008). Ownership holdings of land in rural India: Putting the record straight. Economic </i>
<i>and Political Weekly, 43-47. </i>
Ray, R. K. (1992). Entrepreneurship and industry 1n India, 1800-1947.New Delhi: OUP
<i>Roy, T. (2011). Economic History of India, 1857-1947. OUP Catalogue. </i>
Sharma, H. R. (1994). Distribution of landholdings in rural India, 1953-54 to 1981-82:
<i>Implications for land reforms. Economic and Political weekly, A12-A25.</i>
Sharma, V. P., & Thaker, H. (2009). Economic Policy Reforms and the Indian Fertilizer Industry.
Sidhu, M. S. (2005). Fruit and vegetable processing industry in India: An appraisal of the
<i>post-reform period. Economic and Political Weekly, 3056-3061.</i>
Singh, S. (2009). Agricultural Machinery Industry in India: A Study of Growth, Market Structure,
<i>and Business Strategies. Growth, 8(9), 10. </i>
Singh, K. & Saluja M.R. (2016), Input–Output Table for India: 2013-14. NCAER working paper
No.: WP 111, later published in<i>: The Journal of Applied Economic Research (2018), 12(2), </i>
</div>
<span class='text_page_counter'>(57)</span><div class='page_container' data-page=57>
Singh, S. (2012). New markets for smallholders in India: Exclusion, policy and
<i>mechanisms. Economic and Political Weekly, 95-105. </i>
Singh, S., & Bhogal, S. (2014). Depeasantization in Punjab: status of farmers who left
<i>farming. Current Science, 1364-1368. </i>
Subash SP, Chand P., Pavithra S, Balaji SJ & Pal S. Pesticide Use in Indian Agriculture: Trends,
Market Structure and Policy Issues - Technical Report- January 2017-ICAR
<i>Tyabji, N. (2000). Industrialisation and Innovation: The Indian Experience. SAGE Publications </i>
Pvt. Limited.
<i>Van der Ploeg, J. D. (2012). The new peasantries: struggles for autonomy and sustainability in an </i>
<i>era of empire and globalization. Routledge. </i>
Varinsky, D. (2018, April 10). The $66 billion Bayer-Monsanto merger just got a major green
<i><b>light - but farmers are terrified. Business Insider India. Retrieved from </b></i>
</div>
<!--links-->
<a href=' /><a href=' /><a href=' /><a href=' /><a href=' />
<a href=' /> Tài liệu All Mutual Funds, Asset Management Companies (AMCs) and Association of Mutual Funds in India (AMFI) pptx
- 152
- 584
- 0
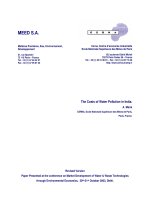


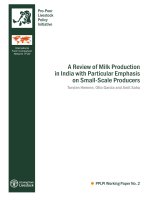
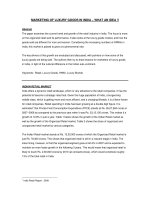
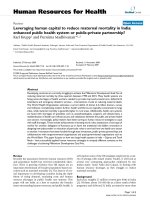

.push({});</script> </div> </div> </div> <div class="vf_link_relate px-2 my-2"> <h2 class="vf_doc_relate text-2xl font-bold my-4">Tài liệu liên quan</h2> <ul class="grid grid-cols-12 gap-2"> <li class="col-span-6 md:col-span-2"> <div class="card-doc " onclick="actionDocRelated(this)"> <a class="card-doc-img" href="https://text.123docz.com/document/1051398-tai-lieu-all-mutual-funds-asset-management-companies-amcs-and-association-of-mutual-funds-in-india-amfi-pptx.htm" title="Tài liệu All Mutual Funds, Asset Management Companies (AMCs) and Association of Mutual Funds in India (AMFI) pptx"> <i class="icon i_type_doc i_type_doc2"></i> <img class="lazy" src="data:image/gif;base64,R0lGODlhAQABAIAAAP///wAAACH5BAEAAAAALAAAAAABAAEAAAICRAEAOw==" data-src="https://media.store123doc.com/images/document/14/br/xm/medium_xmf1392776426.jpg" width="124" height="179" alt="Tài liệu All Mutual Funds, Asset Management Companies (AMCs) and Association of Mutual Funds in India (AMFI) pptx" onerror="this.src=)