Emercy analysis and enerdy modeling for the sustainable use of the lower mekong river basin
Bạn đang xem bản rút gọn của tài liệu. Xem và tải ngay bản đầy đủ của tài liệu tại đây (1.89 MB, 144 trang )
Thesis for the Degree of Doctor of Philosophy
Emergy Analysis and Energy Modeling
for the Sustainable Use of
the Lower Mekong River Basin
by
Dang Viet Hung
Department of Environmental Engineering
The Graduate School
Pukyong National University
August 2006
Emergy Analysis and Energy Modeling
for the Sustainable Use of
the Lower Mekong River Basin
Advisor: Prof. Suk Mo Lee
by
Dang Viet Hung
A thesis submitted in partial fulfillment of the requirements
for the degree of
Doctor of Philosophy
in Department of Environmental Engineering, The Graduate School,
Pukyong National University
August 2006
Emergy Analysis and Energy Modeling
for the Sustainable Use of
the Lower Mekong River Basin
A dissertation
by
Dang Viet Hung
Approved by:
(Chairman)
Prof. Chung Kil Park
(Member)
Prof. Lim Seok Kang
(Member)
Prof. Dae Seok Kang
(Member)
Dr. Jin Woo Yang
(Member)
Prof. Suk Mo Lee
August 31, 2006
Table of Contents
List of Tables........................................................................................................................ iii
List of Figures ...................................................................................................................... iv
List of Appendixes............................................................................................................... vi
Abstract................................................................................................................................ vii
I. Introduction ........................................................................................................................1
II. Study Site and Research Methods..................................................................................5
1. Study Site............................................................................................................................5
1.1 Study area .....................................................................................................................5
1.2 Current situation ..........................................................................................................12
1.3 Recent plans of development and environment in LMR Basin ...................................19
2. Research Methods............................................................................................................21
2.1 Emergy Analysis ..........................................................................................................21
2.2 Energy Modeling..........................................................................................................31
III. Results ............................................................................................................................38
1. Emergy Analysis of LMR Basin ........................................................................................38
1.1 LMR Countries.............................................................................................................38
1.2 LMR Basin ...................................................................................................................53
2. Energy Modeling of LMR Basin ........................................................................................59
2.1 Energy systems diagram and Model of LMR Basin ....................................................59
2.2 Calibration of LMR Basin Model ..................................................................................63
2.3 Current simulation and Reference scenarios of LMR Basin Model.............................66
2.4 Simulation for the Sustainable Use of LMR Basin.......................................................71
i
IV. Discussion .....................................................................................................................82
1. Comparison of Emergy Indices from Emergy Analyses ...................................................82
1.1 LMR Countries.............................................................................................................82
1.2 LMR Basin ...................................................................................................................84
2. Energy Modeling for the Sustainable Use of LMR Basin..................................................87
2.1 Sustainable Use and Ecological Engineering..............................................................87
2.2 Application for feedback emergy .................................................................................90
2.3 Ecological engineering approaches ............................................................................92
2.4 Possibility of ecological engineering............................................................................94
V. Conclusion ......................................................................................................................95
Appendix..............................................................................................................................97
Acknowledgments ........................................................................................................... 127
References........................................................................................................................ 129
ii
List of Tables
Table 2.1 Areas and Populations of LMR Countries ..............................................................5
Table 2.2 Parts of area and population of LMR Countries in LMR Basin.............................10
Table 2.3 Rice yield of LMR Basin in 2000...........................................................................13
Table 2.4 Fisheries production of LMR Basin in 2001..........................................................13
Table 2.5 Forest cover in LMR Basin in 1993 and 1997 ......................................................18
Table 2.6 Statistical References ...........................................................................................28
Table 3.1 Emergy Analysis Table of Laos in 2003 ...............................................................39
Table 3.2 Emergy Analysis Table of Cambodia in 2003.......................................................41
Table 3.3 Emergy Analysis Table of Vietnam in 2003..........................................................43
Table 3.4 Emergy Analysis Table of Thailand in 2003 .........................................................45
Table 3.5 Emergy Indices of LMR Countries ........................................................................48
Table 3.6 Comparison of emergy uses per unit area and emergy uses per capita..............49
Table 3.7 Emergy Analysis Table of LMR Basin in 2003 .....................................................55
Table 3.8 Emergy Indices of LMR Basin ..............................................................................58
Table 3.9 Calibration table of the model of LMR Basin ........................................................63
Table 3.10 Calibration table of the model with Feedback.....................................................73
Table 3.11 Values of K4, K7, and K8 with various percents of feedback ...............................74
Table 3.12 Values of K4, K7, K8 and feedback emergy for the sustainable use ...................81
Table 3.13 Values of percent of feeback and total emergy storage for the sustainable use81
Table 4.1 Ecological engineering for feedback emergy........................................................91
iii
List of Figures
Fig. 1.1 Methodology of Thesis...............................................................................................4
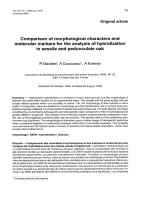
Fig. 2.1 Map of Cambodia.......................................................................................................6
Fig. 2.2 Map of Laos ...............................................................................................................7
Fig. 2.3 Map of Thailand .........................................................................................................8
Fig. 2.4 Map of Vietnam..........................................................................................................9
Fig. 2.5 Location of LMR Basin.............................................................................................11
Fig. 2.6 Completed hydropower projects in the Mekong Basin ............................................15
Fig. 2.7 Forecast of regional electric power demand (MW)..................................................16
Fig. 2.8 Decrease in forest cover of LMR Basin (ha)............................................................18
Fig. 2.9 Emergy quality chain used to calculate solar transformity.......................................21
Fig. 2.10 Concepts of energy transformation hierarchy and transformity.............................23
Fig. 2.11 Autocatalytic production process ...........................................................................24
Fig. 2.12 Order arranged from the left side with low transformities to the right side with high
transformities ...........................................................................................................25
Fig. 2.13 Summary diagram of emergy flows .......................................................................27
Fig. 2.14 Diagram illustrating emergy indices for a national or regional economy ...............29
Fig. 2.15 Scales of space and time.......................................................................................31
Fig. 2.16 Relations among environmental science, ecology, energy modeling, and
environmental management & technology ..............................................................32
Fig. 2.17 Steps of energy modeling ......................................................................................33
Fig. 2.18 Diagram with numbers of one kind ........................................................................34
Fig. 2.19 Equation for a storage model with five kinds of pathways.....................................35
Fig. 3.1 Emergy signature of Laos........................................................................................40
Fig. 3.2 Summary diagram of Laos.......................................................................................40
Fig. 3.3 Emergy signature of Cambodia ...............................................................................42
Fig. 3.4 Summary diagram of Cambodia ..............................................................................42
Fig. 3.5 Emergy signature of Vietnam ..................................................................................44
Fig. 3.6 Emergy signature of Thailand..................................................................................46
iv
Fig. 3.7 Summary diagram of Vietnam .................................................................................47
Fig. 3.8 Summary diagram of Thailand.................................................................................47
Fig. 3.9 Emergy used per unit area of LMR Countries .........................................................50
Fig. 3.10 Emergy used per capita of LMR Countries............................................................50
Fig. 3.11 Emergy to money ratios of LMR Countries............................................................51
Fig. 3.12 Emergy indices of LMR Countries .........................................................................52
Fig. 3.13 Energy systems diagram of LMR Basin for emergy analysis ................................54
Fig. 3.14 Emergy signature of LMR Basin ............................................................................56
Fig. 3.15 Summary diagram of emergy flows in LMR Basin Economy ................................57
Fig. 3.16 Energy systems diagram of LMR Basin for energy modeling ...............................60
Fig. 3.17 Numerical systems diagram of LMR Basin............................................................61
Fig. 3.18 Simulation model of LMR Basin.............................................................................62
Fig. 3.19 Simulation of LMR Basin Model.............................................................................66
Fig. 3.20 Validation of LMR Basin Model..............................................................................67
Fig. 3.21 Scenarios with increasing Pg (Q graphs) ..............................................................68
Fig. 3.22 Scenarios with increasing Pg (A graphs)...............................................................69
Fig. 3.23 Scenarios with increasing Pg (M graphs) ..............................................................69
Fig. 3.24 Scenarios with increasing exports (Q graphs).......................................................70
Fig. 3.25 Scenarios with increasing exports (A graphs) .......................................................70
Fig. 3.26 Scenarios with increasing exports (M graphs).......................................................71
Fig. 3.27 Simulation model with feedback ............................................................................72
Fig. 3.28 Modeling with feedback (Q graphs) .......................................................................74
Fig. 3.29 Modeling with feedback (A graphs) .......................................................................75
Fig. 3.30 Modeling with feedback (M graphs).......................................................................75
Fig. 3.31 Modeling with feedback (GRDP graphs) ...............................................................76
Fig. 3.32 Contribution of Q and A in the total emergy storage at various percents of
feedback ..................................................................................................................77
Fig. 3.33 Quantities of the total emergy storage at various percents of feedback in
comparison ..............................................................................................................78
Fig. 3.34 Unsustainable use of LMR Basin without feedback from now to 2300 .................80
Fig. 3.35 Sustainable use of LMR Basin with feedback increased gradually .......................80
v
List of Appendixes
Appendix 3.1.1-1 Footnotes to Emergy Analysis Table of Laos in 2003..............................97
Appendix 3.1.1-2 Footnotes to Emergy Analysis Table of Cambodia in 2003 .................. 102
Appendix 3.1.1-3 Footnotes to Emergy Analysis Table of Vietnam in 2003 ..................... 107
Appendix 3.1.1-4 Footnotes to Emergy Analysis Table of Thailand in 2003..................... 113
Appendix 3.1.2-1 Footnotes to Emergy Analysis Table of LMR Basin in 2003 ................. 119
Appendix 3.2.3-1 Microsoft Visual Basic Program for simulating LMR Basin Model without
feedback............................................................................................................................. 124
Appendix 3.2.4-1 Microsoft Visual Basic Program for simulating LMR Basin Model with
feedback............................................................................................................................. 125
vi
Emergy Analysis and Energy Modeling for the Sustainable Use of
the Lower Mekong River Basin
Dang Viet Hung
Department of Environmental Engineering, The Graduate School,
Pukyong National University
Abstract
Emergy analysis and energy modeling were performed to supply the insight and to give
the way for sustainable use of the Lower Mekong River Basin (LMR Basin) which supplies
benefits both to human society and natural environment. Emergy analyses in 2003 showed
that about 96%, 94%, 81%, and 70% of the total emergy used in Laos, Cambodia, Vietnam,
and Thailand (LMR Countries), respectively, were derived from within the country. The
emergy money ratios decrease from Laos to Cambodia, Vietnam, and Thailand with
6.64E+13 sej/$, 5.34E+13 sej/$, 3.09E+13 sej/$, and 6.52E+12 sej/$, respectively. The
EmSIs of Laos and Cambodia were very high with the values of 53.29 and 38.66, while the
EmSIs of Vietnam and Thailand were moderate with the values of 0.98 and 0.71. In LMR
Basin, real wealth contributions of natural environment to human economy are 49%. The
most important renewable resource is the chemical potential of rain of 1429.23E+20 sej/yr.
The second most important renewable resource is the chemical potential of river of
362.68E+20 sej/yr. Agriculture production is the main economic activity. People in the basin
are among the poorest in the world which the carrying capacity of natural environment was
equal to 38% population of the basin.
Nowadays, LMR Basin is entering a new phase of development with high growth rate.
From energy modeling results, the current development is unsustainable. The scenarios
with increasing exports showed that increased exploitation of environmental resource for
economic development in LMR Basin will result in the exhaustion sooner or later. For the
sustainable use of LMR Basin, feedback from economic process to environmental
vii
production must be carried out and should be increased gradually with 0.32% per year from
0.32% in 2004 to 66% in 2210 and kept at 66% from 2210 to 2300 in order to maximize the
total emergy storage of environmental stock and economic assets. As the additional means,
the ecological engineering approaches for such feedback including (1) sustainable use of
ecosystems such as environmentally sound energy development, ecological agriculture,
complex aquaculture, industrial ecology, and ecotourism; (2) artificial construction of
ecosystems such as created wetland; (3) restoration of ecosystems such as reforestation;
and (4) ecologically sound harvest such as capture of fish and exploitation of forest in
natural balance could make LMR Basin move more effectively and more efficiently towards
sustainable use.
viii
Lower Mekong River Basin의 지속가능한 이용을 위한
Emergy analysis와 Energy modeling
Dang Viet Hung
부경대학교 환경공학과 대학원
요약문
메콩강 하류유역을 대상으로 인류의 편익과 자연환경을 동시에 고려할 수 있는 에머지 분석과 에너지 모델링을
수행하고 그 결과를 바탕으로 메콩강 하류유역의 지속가능한 이용을 위한 방안을 제시하였다. 에머지 분석 결과,
메콩강 하류유역 국가인 라오스, 캄보디아, 베트남, 태국은 각각 총 에머지 사용량의 96%, 64%, 81%, 70%을 자국
으로부터 조달하고 있었고, 이를 지속성 관점에서 검토한 결과 캄보디아와 라오스의 경우 매우 건전한 상태였으나
베트남과 태국의 경우 임계수준에 가까웠다. 이들 국가의 가장 중요한 자연환경 자원은 강우의 화학적 에너지로서
1,429.23E+20 sej/yr로 나타났다. 두 번째로 중요한 자연환경 자원은 강물의 화학적 에너지로서 362.68E+20 sej/yr
로 나타났다. 주요경제활동은 농업생산이었으며 자연환경에 의한 인구수용능력은 메콩강 햐류유역 국가총인구의
38%에 해당하였다.
최근 메콩강 하류유역국가들은 높은 성장율과 함께 새로운 발전단계로 접어들고 있다. 메콩강 하류유역 국가들
에 대한 에너지 모델링 수행결과에 따르면, 현 단계의 발전양상은 자연자원의 고갈에 따른 생산력저하로 지속성이
저하되는 것으로 나타났다. 따라서, 경제활동으로부터 얻은 이윤을 자연환경의 생산에 피드백 시켜야만 시스템의
지속가능성이 높아지는 것으로 나타났다. 경제적자산과 환경자원의 에머지량을 최대화하여 지속성을 유지하기 위
한 환경정책으로서 2003년부터 2210까지는 0%에서 66%까지 시기별로 피드백을 증가시키고, 2210년부터 2300년
까지는 66%까지 피드백 시키는 구조로 개편되어야만 현재의 수준으로 실질적인 부가 지속되는 것으로 예측되었다.
이러한 피드백은 생태공학적 방법을 적용함으로써 메콩강 하류유역의 지속 가능한 이용을 달성할 수 있다. 이를
위한 생태공학적 접근방법으로 첫째, 환경적으로 건전한 에너지의 개발, 환경친화적 영농, 복합양식, 생태산업단지
의 조성, 생태관광 등과 같은 생태계의 건전한 이용, 둘째, 인공습지와 같은 인공 생태계의 조성, 셋째, 황폐한 산
림의 재조림과 같은 생태계 복원, 그리고 마지막으로 자연의 균형에 맞는 적절한 자원의 개발과 같은 생태학적으
로 건전한 수확을 들 수 있으며 이를 실제 자원개발, 산업발전, 환경정책 등에 적용함으로써, 곧 메콩강 하류유역
의 지속가능한 발전과 이용을 도모할 수 있을 것이다.
I. Introduction
People in the Lower Mekong River Basin (LMR Basin) depend heavily on the water
flow from the Mekong River. Approximately 80% population lives in rural areas. Agriculture
production, capture fisheries, aquaculture production, forest management, industry
production, hydroelectric generation, and utilization of ecological resources for conservation
and tourism are the main characteristics of the economy based on the abundant natural
resources such as water, land, forest, wetland, and biodiversity. LMR Basin is still very poor.
In the last 15 years, the economies within the basin have begun to change. Growth rates of
Thailand were over 10% in the late 1980s and early 1990s, and those of Cambodia, Laos,
and Vietnam were about 5% in the 1990s (MRC, 2003).
Economic development is necessary and sustainable development is the common goal
of all countries in LMR Basin (LMR Countries). However, the current economic production
together with the rapid population growth is causing a great pressure on the natural
resources in the basin. It results in the pollution of water sources, exhaustion of fertile soils,
loss of forest areas, damage of natural wetlands, and reduction of biodiversity kinds. A
comprehensive solution for utilization of LMR Basin has not been extended. The available
condition of these resources is being affected severely. If the present rate of exploitation of
them continues and increases, they will be reduced in the not-too-distant future to the levels
which recovery may be impossible (MRC, 2003).
Quantitative evaluation of the real wealth contributions of natural environment to human
economy is necessary for making the exact development strategy. Furthermore, an
additional means for sustainable use of LMR Basin which supplies the benefits for the
whole system is also required. Recently, emergy concept (spelled with an “m”) which
recognizes the available energy that has been already used up through many
transformations from initial environmental production to later economic process is capable
of representing both the environmental and economic values with a common measure
(Odum, 1996). Closely, energy modeling which is often used for selection of the best
management and technology solutions for the problems related human with nature also
allows seeking this means (Mitsch et al., 1989). It is consistent when both emergy analysis
-1-
and energy modeling originate from the viewpoint of systems ecology.
In the recent years, researches using emergy evaluation have been carried out
increasingly, including national or regional emergy analyses of environmental, economic,
and public policy (Choi, 2003; Higgins, 2003; Huang et al., 1995; Lee et al., 1994; Qin et al.,
2000) as well as emergy evaluations for comparison of alternative utilizations of rivers such
as emergy evaluation perspectives of a multipurpose dam proposal in Korea (Kang et al.,
2002) and emergy evaluation of diversions of river water to marshes in the Mississippi
River Delta (Martin, 2002). They are very good references for emergy analysis about
methods, transformities, and indices. In LMR Basin, emergy analysis was used for
evaluating benefits and costs of two proposed dams on the Mekong River in Thailand
(Brown et al., 1996). An emergy analysis overview of Thailand in 1985 was also included.
The emergy use per capita was 2.98E+15 sej/capita/yr. The emergy money ratio of
3.46E+12 sej/$ was near the world average, indicating the position of Thailand at the
boundary between developing and developed countries. The renewable carrying capacity
was about 50% of population. These emergy indices are very useful in comparison with
emergy studies later to see the change of Thailand.
Odum and his co-workers have been constructed many fundamental minimodels in
many kinds of systems (Odum et al., 2000). Each minimodel contains verbal description,
network diagram, change equation, simulation program in BASIC, and graphs of functions.
These mimimodels include mathematical relationships found in a lot of fields such as
biochemistry, ecology, economy, geology, and population. Based on these basic
relationships, more complex systems are researched and developed. By chance,
ECONUSE, the model of economic use of renewable resources (Odum et al., 2000), is
rather close to the situation of LMR Basin. Simulation the future of Korea’ natural
environment and economic development (Lee et al., 2001) provides a well-illustrated
example about energy modeling for sustainable development. Some scenarios with selling
the native enterprise to abroad, increasing the price of purchased inputs, and increasing the
export of produced outputs were performed. Over 75% of total economic production was
suggested to invest to natural resource management. Transferring from the present
industrial structure to the social-economic structure based on ecological-recycling is the
policy for the sustainable development of Korea.
-2-
Ecological engineering may be the choice for the sustainable use of LMR Basin.
Projects in this field operate at the interface between human and nature, and are created to
provide societal and environmental benefits at the same time. Ecological engineering has
been applied significantly in the world, especially for the last decades. Dafeng county at the
southern part of Jiangsu province in China is a good case study. In 1998, about 22
demonstration sites for ecological engineering were organized in the county by application
of ecological agriculture, ecological industry, ecosystem conservation, and community
development. GDP of the county in 1996 was eight times higher than that in 1986 before
applying eco-technology, while the environmental quality was improved or maintained at the
same level as that in 1980 when there were few industries (Wang et al., 1998). Some ecotechnologies have been applied in LMR Basin but their application is still disconnected and
unsystematic. Eco-industrial parks in Thailand and eco-agricultural types as the
combination of rice paddy or fruit garden, fish pond, and pigsty farm in Vietnam have been
representative case studies. Ecotourism is also being introduced and encouraged to apply
in all LMR Countries (Leksakundilok, 2004).
Although LMR Basin system has been evaluated nationally and qualitatively, little
quantitative information is available about the whole system, particularly in regard to how
changes in policy of environment and economic are affecting the system. The purpose of
this thesis is to supply the insight and give the way for sustainable use of LMR Basin. In the
first step, emergy analysis is performed to represent the important contribution of the
environment to the society as well as the current status of LMR Basin. In the second step,
the additional means for sustainable use is determined by energy modeling. Finally, based
on the results in the first and second steps, the thesis recommends the approaches that
could be applied for the sustainable use of LMR Basin. The methodology of the thesis is
shown in Figure 1.1. Systems ecology is the background for emergy analysis and energy
modeling. It results in the sustainable use of LMR Basin which supplies benefits both to
human society and natural environment.
-3-
Fig. 1.1 Methodology of Thesis
-4-
II. Study Site and Research Methods
1. Study Site
1.1. Study area
The Mekong River is the dominant geo-hydrological structure in mainland Southeast
Asia. It originates from China and flows through, or border, Myanmar, Laos, Thailand,
Cambodia, and Vietnam. Compared with the other river systems globally, the Mekong ranks
8th in terms of discharge (15,000 m3 / sec), 12th in terms of length (4,800 km), and 21st in
terms of basin (795,000 km2). The Mekong River Basin comprises around 795,000 km2 and
stretches about 2,600 km across Southeast Asia from the Tibetan Plateau in China to the
South China Sea in Vietnam. It is divided into two parts, the Upper (24% of the area) and
the Lower (76% of the area). The Lower Mekong River Basin (LMR Basin) is the part of
watershed area lying within Laos, Thailand, Cambodia, and Vietnam. These countries are
the Lower Mekong River Countries (LMR Countries). All of them are the members of
Association of Southeast Asian Nations (ASEAN). The areas and the populations of
Cambodia, Laos, Thailand, and Vietnam are given in Table 2.1. Maps of these countries are
given in Figures 2.1, 2.2, 2.3, and 2.4.
Table 2.1 Areas and Populations of LMR Countries (Source: ASEAN, 2003)
Country
Area
2
(km )
Population in 2003
(million people)
Cambodia
181,035
13.798
Laos
236,800
5.618
Thailand
513,254
63.950
Vietnam
330,363
81.185
-5-
Fig. 2.1 Map of Cambodia
Source: ASEAN, 2003
-6-
Fig. 2.2 Map of Laos
Source: ASEAN, 2003
-7-
Fig. 2.3 Map of Thailand
Source: ASEAN, 2003
-8-
Fig. 2.4 Map of Vietnam
Source: ASEAN, 2003
-9-
Cambodia, Laos, Thailand, and Vietnam signed the Agreement on Cooperation for
Sustainable Development of Lower Mekong River Basin and Mekong River Commission
(MRC) was born in 1995. LMR Basin has an area of approximately 606,000 km2 (Figure
2.5). The population is about 57.160 million people. It comprises almost all Laos and
Cambodia, more than one-third of Thailand (its Northeastern Region and part of Northern
Region), and one-fifth of Vietnam (the Central Highlands and Mekong Delta) (Table 2.2).
The Mekong Delta is the most downstream part of LMR Basin. Most of the Mekong Delta
lies in the southern part of Vietnam. The flow of the Mekong and its tributaries is closely
related to the rainfall pattern affected by monsoon. Each year about 475,000 million m3 of
water runs into the South China Sea off the Mekong Delta.
Table 2.2 Parts of area and population of LMR Countries in LMR Basin (Source: MRC,
2003)
Country
Area in LMR Basin
Part of national
Population in LMR Basin
Part of national
(km )
area (%)
(million people)
population (%)
Cambodia
155,000
86
10.476
76
Laos
202,000
85
5.282
94
Thailand
184,000
36
23.793
37
Vietnam
65,000
20
17.609
22
2
- 10 -
Fig. 2.5 Location of LMR Basin
Source: MRC, 2003
- 11 -
1.2. Current situation
1.2.1 Social situation
The basin is the home to more than 70 ethnic groups. Over 55 million people live in
LMR Basin. The population is growing fast with annual growth rate of over 1.5%. Labor
force is very young and abundant but LMR Basin has been faced by serious problems of
human resource although manpower is extremely important for the development of the
basin. Unemployment in rural areas and lack of skilled labor forces are still the big
problems. In addition, education and health conditions are inadequate, particularly for
children and women in less developed areas of the basin. By the standards of the UNDP’s
Human Development Index, Thailand and Vietnam are middle-income countries, while
Cambodia and Laos are low-income countries. The people of LMR Basin remained, in
terms of per capita income, among the poorest in the world. Nearly 40% of the populations
of Cambodia, Laos, and Vietnam live below the poverty line. In Northeast Thailand, 19% of
the population is poor (MRC, 2003).
1.2.2 Economic situation
Agriculture is the single most important economic activity in LMR Basin. In order to
overcome poverty in rural areas, commercial agriculture is being promoted. In 1998, the
ratio of the irrigated land to total cultivated area was only 7-10%, much lower than 45%
ratio for Asia as a whole. Now, irrigation is increasing not only to enable a second and even
a third rice crop but also to expand wet season production. Rice production has increased
greatly in the last years: in Cambodia, by 23% between 1993 and 2000; in Laos, by 38%
between 1990 and 1999; in the Northeast Region of Thailand, by 33% between 1994 and
2001; and in the Mekong Delta and Central Highlands of Vietnam, by 27% between 1995
and 1999. Rice cropping areas in LMR Basin were about 11.7 million ha in 1999-2000. In
2000, the average yield for LMR Basin was 2.7 tonnes/ha, compared with 3.9 tonnes/ha for
the Asia-Pacific Region (Table 2.3). Utilization of fertilizers and pesticides is likely to
expand as agriculture becomes more commercial (MRC, 2003).
- 12 -
Table 2.3 Rice yield of LMR Basin in 2000 (Source: MRC, 2003)
Country
Region
rd
Wet Season
Dry Season
3 Season
Average
(tonnes/ha)
(tonnes/ha)
(tonnes/ha)
(tonnes/ha)
Cambodia
Whole
1.8
3.0
-
1.9
Laos
Upland
1.5
-
-
1.5
Lowland
3.1
4.1
-
2.9
Thailand
Northeast
1.9
3.3
-
2.0
Vietnam
Central Highlands
3.0
4.6
-
3.1
Mekong Delta
2.6
5.0
3.7
4.1
Most of the 12 million rural households in LMR Basin fish as well as farm. Fish is the
main source of animal protein in the diets of the people living in the basin. The annual catch
is an estimated 1,500,000 tonnes, with another 500,000 tonnes from aquaculture and
reservoirs (Table 2.4). The largest amounts of fish are cultured in the Mekong Delta of
Vietnam and the Northeast Region of Thailand. Growth in aquaculture production has been
steady over the past 10 years, from 60,000 tonnes in 1990 to 260,000 tonnes in 2001
(MRC, 2003). Especially, shrimp and catfish culture have been the important income and
foreign currency in the Mekong Delta. The rapid expansion of shrimp and catfish intensive
farming systems is resulting in the widespread loss of mangrove forests existing along the
coast. The Mekong Basin’s aquatic ecosystem is still in good condition, but there are a
number of possible threats to the wild fisheries such as water resource utilization, habitat
loss, fishing pressure, wetland deterioration, and pollution of water body.
Table 2.4 Fisheries production of LMR Basin in 2001 (Source: MRC, 2002)
Fish and Aquatic Products
Capture
Quantity (tonnes)
Price (US$ per kg)
Value (US$ millions)
1,042
1,533,000
0.68
Aquaculture
260,000
1.05
273
Reservoirs
240,000
0.68
163
TOTAL
2,033,000
-
- 13 -
1,478