Impact of changing population structure on economic growth of Vietnam
Bạn đang xem bản rút gọn của tài liệu. Xem và tải ngay bản đầy đủ của tài liệu tại đây (1005.85 KB, 46 trang )
<span class='text_page_counter'>(1)</span><div class='page_container' data-page=1>
VIETNAM NATIONAL UNIVERSITY, HANOI
<b>VIETNAM JAPAN UNIVERSITY </b>
<b>TRAN NGOC HAI LINH </b>
<b>IMPACT OF CHANGING POPULATION </b>
<b>STRUCTURES ON ECONOMIC GROWTH </b>
<b>OF VIETNAM </b>
<b>MASTER'S THESIS </b>
</div>
<span class='text_page_counter'>(2)</span><div class='page_container' data-page=2>
VIETNAM NATIONAL UNIVERSITY, HANOI
<b>VIETNAM JAPAN UNIVERSITY </b>
<b>TRAN NGOC HAI LINH </b>
<b>IMPACT OF CHANGING POPULATION </b>
<b>STRUCTURES ON ECONOMIC GROWTH </b>
<b>OF VIETNAM </b>
<b>MAJOR: PUBLIC POLICY </b>
<b>CODE: 8340402.01 </b>
<b>RESEARCH SUPERVISOR: </b>
<b>Dr. VU HOANG LINH </b>
<b>Associate Prof. MOGES ABU GIRMA </b>
</div>
<span class='text_page_counter'>(3)</span><div class='page_container' data-page=3>
i
<b>TABLE OF CONTENT </b>
<b>LIST OF FIGURES ... i </b>
<b>LIST OF TABLES ... ii </b>
<b>LIST OF ABBREVIATIONS... iii </b>
<b>ACKNOWLEDGEMENTS ... iv </b>
<b>CHAPTER 1: INTRODUCTION ...1 </b>
<b>1.1. </b> <b>Research background ...1 </b>
<b>1.2. </b> <b>Problem statement ...6 </b>
<b>1.3. </b> <b>Purpose of the study ...6 </b>
<b>1.4. </b> <b>Research questions ...6 </b>
<b>1.5. </b> <b>Research method ...7 </b>
<b>1.6. </b> <b>Significance of the study ...7 </b>
<b>1.7. </b> <b>Thesis’ structure: ...7 </b>
<b>CHAPTER 2: LITERATURE REVIEW ...9 </b>
<b>2.1. </b> <b>International literature on the impacts of changing population </b>
<b>structures on economic growth: ...9 </b>
<b>2.2. </b> <b>Vietnamese literature on the impacts of changing population </b>
<b>structures on economic growth in Vietnam: ...13 </b>
<b>2.3. </b> <b>Research gap ...15 </b>
<b>2.4. </b> <b>Conclusion ...17 </b>
<b>CHAPTER 3: METHODOLOGY ...18 </b>
<b>3.1. </b> <b>Overall Quantitative Analysis and the Econometrics ...18 </b>
<b>3.2. </b> <b>Regression Model ...19 </b>
<b>3.3. </b> <b>Index calculation ...24 </b>
<b>3.4. </b> <b>Expected signs of Variables ...24 </b>
<b>3.5. </b> <b>Hypothesis ...25 </b>
<b>3.6. </b> <b>Conclusion ...25 </b>
<b>CHAPTER 4 DATA ...27 </b>
<b>4.1. </b> <b>Data collection ...27 </b>
<b>4.2. </b> <b>Data Descriptive ...27 </b>
<b>4.3. </b> <b>Conclusion ...28 </b>
<b>CHAPTER 5: ESTIMATION RESULT ...29 </b>
<b>5.1. </b> <b>Impact of changing on working-age population on GRDP per </b>
</div>
<span class='text_page_counter'>(4)</span><div class='page_container' data-page=4>
ii
<b>5.2. </b> <b>Impact of other factors on GRDP per capita: ...31 </b>
<b>5.3. </b> <b>Conclusion: ...32 </b>
<b>CHAPTER 6: POLICY RECOMMENDATIONS ...34 </b>
<b>6.1. </b> <b>Policy recommendations: ...34 </b>
<b>6.2. </b> <b>Limitations: ...35 </b>
<b>6.3. </b> <b>Conclusion ...36 </b>
</div>
<span class='text_page_counter'>(5)</span><div class='page_container' data-page=5>
i
<b>LIST OF FIGURES </b>
Page
<b>Figure 2.1: An example of life-cycle surplus </b> 14
<b>Figure 3.1: The LM test result </b> 18
</div>
<span class='text_page_counter'>(6)</span><div class='page_container' data-page=6>
ii
<b>LIST OF TABLES </b>
Page
<b>Table 1.1. Total population and 15-64-year-old population’s growth rate </b>
from 1990 to 2050
1
<b>Table 1.2. TFR and Percentage of youth people to total population from </b>
1989 to 2018
2
<b>Table 1.3. Global population aging trend </b> 3
<b>Table 2.1. Bloom and Williamson (1998)’s variables </b> 10
<b>Table 2.2. Mikiko (2015)’s variables </b> 11
<b>Table 2.3. Compare and contrast to previous research papers </b> 16
<b>Table 3.1. Independent and Dependent Variables’ definition and source </b> 20
<b>Table 3.2. Dummy Variables for Areas </b> 23
<b>Table 3.3. Expected signs of Variables </b> 25
<b>Table 4.1. Descriptive statistics of variables </b> 27
</div>
<span class='text_page_counter'>(7)</span><div class='page_container' data-page=7>
iii
<b>LIST OF ABBREVIATIONS </b>
Order Abbreviations Full word
1. CH Central Highlands
2. FDI Foreign direct investment
3. FE Fixed Effect
4. GDP Gross Domestic Product
5. GOV Government of the Socialist Republic of Viet
Nam
6. GRDP Gross Regional Domestic Product
7. GSO General Statistics Office of Vietnam
8. LM The Breusch and Pagan Lagrangian
multiplier
9. MRD Mekong River Delta
10. NCC North Central and Central coastal
11. NMM Northern midlands and mountain
12. NTA National Transfer Accounts
13. PCI Provincial Competitiveness Index
14. RE Random Effect
15. RRD Red River Delta
16. SE South East
17. VCCI Vietnam Chamber of Commerce and
Industry
</div>
<span class='text_page_counter'>(8)</span><div class='page_container' data-page=8>
iv
<b>ACKNOWLEDGEMENTS </b>
After two years of hard-studying in Vietnam Japan University, finally, I could finish
my thesis successfully. Firstly, I would like to give the sincerest thanks to my
supervisors, Prof. Moges Abu Girma and Dr. Vu Hoang Linh. Moges-sensei had
supported me when I was an internship in Japan, while Dr. Linh has helped me a lot
when I went back Hanoi to continue writing my thesis. The most difficulty I have to
deal with is that I have no experience in doing academic research, especially
quantitative methods, how and where to collect the data, as well as testing the
model. But Dr. Linh has guided me step by step to overcome these challenges.
Without both supervisor's guidance and their support, I could not do my thesis
successfully.
Secondly, I would like to say thanks to Dr. Nguyen Thuy Anh, Dr. Dang Quang
Vinh, Prof. Naohisa Okamoto, Ms. Nguyen Thu Ha, and Ms. Pham Lan Huong,
who from the office of MPP of VJU. They always support and encourage me when
I study in VJU.
Last but not least, I would like to thank all the staffs of Tsukuba University who
supported MPP 3rd intake students during the internship in Japan. They were
willing to help us in every situation from the first day we came until the last minute
we left Japan. They bring us a lot of joyful moments and unforgettable memories,
not only in term of studying experience but also the lifestyle and discovering the
culture of Japan.
</div>
<span class='text_page_counter'>(9)</span><div class='page_container' data-page=9>
1
<b>CHAPTER 1: INTRODUCTION </b>
<b>1.1. </b> <b>Research background </b>
<i><b>1.1.1. Vietnamese population’s overview </b></i>
Vietnam is a developing country with 94,6 million people, and around 55,3 million
people in working-age1. This number accounted for 58,5% of the total population.
<i><b>Table 1.1. Total population and 15-64-year-old population’s growth rate from 1990 </b></i>
to 2050
<b>1990</b>
<b>2000</b>
<b>2010</b>
<b>2020</b>
<b>2030</b>
<b>2040</b>
<b>2050</b>
<b>Total </b>
<b>population</b>
67,9
79,9
88,8
96,2
104,16
107,7
109,6
<b>Growth </b>
<b>rate</b>
9%
18%
11%
10%
7%
3%
2%
<b>Population </b>
<b>15-64yo</b>
38,7
49,5
61,4
61,1
69,6
70,8
68,3
<b>Growth </b>
<b>rate</b>
12%
28%
24%
-0.5%
14%
2%
-4%
<i>Source: WDI and UN </i>
Table 1.1 above illustrates the total population and the population aged 15 to
64-year-old and their growth rate from 1990 to 2050 in Vietnam. According to
Probabilistic Population Projections of United Nations (UN), the growth rate of the
total population of Vietnam will slow down. It will decline gradually from 10% in
1
</div>
<span class='text_page_counter'>(10)</span><div class='page_container' data-page=10>
2
2020 to 3% in 2040 and reach only 2% in 2050. The growth rate of the population
aged 15 to 65-year-old have rapidly decreased from 14% to minus 4% in 2050. It
means that the people of Vietnam will experience growth slowly while the number
of the labor force is falling in the next 30 years.
There are three critical points in the population policies during the past 40 years,
which lead to the dynamic change in the population structure in Vietnam: reducing
birth rate and death rate, and focusing on improving people's quality of life. These
policies had led to the decrease in the Total Fertility Rate while the life expectancy
was increasing.
<b>Table 1.2. TFR and Percentage of youth people to total population from 1989 to </b>
2018
1989 1999 2009 2018
Total Fertility rate 3.8 2.33 1.93 2.04
Population aged
0-14 (% of total
population)
39.2 33.0 24.5 23.1
<i>Sourse: Collected from Vietnam Population and Housing census year 1989, 1999, </i>
<i>2009, 2018 </i>
Table 1.2 above shows that in 1989, a female in the child-bearing ages gave birth to
3.8 children, but in 2018 this figure was only 2.04 children. This fall in TFR
resulted in a rapidly decreasing percentage of youth population, down from 39.2%
in 1989 to 23.1% in 2018.
</div>
<span class='text_page_counter'>(11)</span><div class='page_container' data-page=11>
3
<b>Table 1.3. Global population aging trend </b>
Country Population Aged 65 and Above (% of Total)
7% 10% 14% 20% Years
Taiwan 1993 2006 2018 2026 33
Japan 1970 1984 1994 2005 35
South
Korea
1999 2007 2017 2026 27
Singapore 1999 2012 2018 2026 27
China 2000 2016 2025 2035 35
France 1864 1943 1990 2019 155
Germany 1932 1951 1971 2008 76
UK 1929 1946 1975 2026 97
US 1942 1972 2013 2029 87
Vietnam 2016 2025 2035 2050 34
<i>Source: World Population Prospects </i>
“Year” column in Table 1.3 shows the entire year of a country transforms from an
aging population to an aged population country. According to UNFPA, the
so-called “aging population” period is when the proposition of people aged 65+ to the
total population accounts for 7% or more. And “aged population” period happened
when the proposition of 65-year-old or more population reaches 20% to the total
population.
</div>
<span class='text_page_counter'>(12)</span><div class='page_container' data-page=12>
4
which the old-age dependency ratio reach 20%. Based on the data shown in Table
1.3, Asian countries such as Taiwan, Japan, Singapore, and Vietnam has a quicker
process of aging than American and European countries. The rapidly aging process
will bring an additional burden to the working-age population, which is the primary
resource for economic growth.
<i><b>1.1.2. Population policies in Vietnam: </b></i>
Population policies are legislations, management programs, and other government
activities that aim to change or adjust current population trends for the growth and
prosperity of the Nation. Depending on specific objectives and situation, the
Government will issue policies and laws to guide and regulate the process of
population development.
The Vietnamese Government has soon realized the vital role of the population to
the social-economic growth. Council of Ministers (now is called Government of the
Socialist Republic of Viet Nam - GOV) issued the first population policy of
Vietnam – The Decision No. 216/CP on 26th December 1961; guiding the
childbearing with the aim of mothers' maternal health, for the welfare and harmony
of the family, so that the parenting can be thoughtful, the female procreation is
appropriately instructed.
Later on, the seventh National Party Congress (from 1991 to 1996) - The Central
Committee of the Communist Party of Vietnam considers population activities and
family planning are an essential part of National development strategies, as well as
a critical factor in enhancing the life quality of each Vietnamese people, family, and
community as a whole.
</div>
<span class='text_page_counter'>(13)</span><div class='page_container' data-page=13>
5
Population Strategy to 2030". The Strategy was issued on 22nd November 2019 in
the Decision No. 1679/QD-TTg, signed by Prime Minister Nguyen Xuan Phuc.
The overall goal of this Strategy is maintaining the replacement fertility rate;
controlling the sex ratio at birth to natural equilibrium; taking advantage of the
golden age population effectively; adapting to population aging; reasonably
distributing the population density and improving the quality of population to
contribute to rapid and sustainable national development.
For effective implementation, the Strategy clarifies eight objectives to be done until
2030, which are:
- Objective 1: Maintain a replacement fertility rate firmly, reducing fertility
disparities between regions and entities.
- Objective 2: Protect and develop the population of ethnic minorities with less
than 10 thousand people, especially these ethnic minorities that are at a high
risk of rapidly declining their population.
- Objective 3: Control the sex ratio at birth to the natural balance, strive to
maintain the age structure at a reasonable level.
- Objective 4: Improve the quality of the population.
- Objective 5: Distribute the community reasonably and ensure National
defense and security.
- Objective 6: Complete the construction and operation of the national
database on population, accelerate the integration of population factors into
the formulation and implementation of socio-economic development plans.
- Objective 7: Maximize the golden-age population structure's advantages,
creating a strong motivation for the country's rapid and sustainable
development.
</div>
<span class='text_page_counter'>(14)</span><div class='page_container' data-page=14>
6
<b>1.2. </b> <b>Problem statement </b>
In the previous part, an introduction to the current status of the population, the
Vietnamese population’s policies, and the Strategy to 2030 of Vietnam are shown.
It can be seen that, in the context of Vietnam in the near future, the decline of
working-age population combines with the rapidly aging process will make the
working-age population will become the limited resource and get additional burden.
In addition, although Vietnam has transformed from an emerging country to a
low-middle-income country recently, Vietnam needs to use the labor workforce in an
effective and wise way in order to grow faster and to avoid the middle-income trap.
Therefore, deeply understanding the relations between the changing economically
active population structure and economic growth is needed.
In this thesis, the correlation between population, dependent population, and the
Vietnamese economy will be examined with the more updated longitudinal data by
utilizing quantitative methods.
<b>1.3. </b> <b>Purpose of the study </b>
There are two major purposes of this study.
The first purpose is to estimate the impact of population structures’ change on
economic growth using quantitative method with provincial data.
The second purpose is to propose appropriate policies to utilize human resources
effectively, as well as to promote sustainable economic growth in Vietnam.
<b>1.4. </b> <b>Research questions </b>
This research is going to answer the two major questions:
</div>
<span class='text_page_counter'>(15)</span><div class='page_container' data-page=15>
7
2) What should the Vietnamese government do to utilize the population
resource effectively?
<b>1.5. </b> <b> Research method </b>
The thesis uses the quantitative approach with provincial data. The time scope is
from 2011 to 2017. Data of all variables are collected from GSO, except PCI, which
is obtained from VCCI.
The secondary data obtained from GSO and VCCI is analyzed by applying the
Random Effect model, the relations between GRDP and the change in the
working-age population's structure will be explored. Inside the model, the working-working-age
population and dependent population were considered as the primary explanatory
variable, while other factors such as PCI, life expectance at birth, working hour,
FDI, and vice versa are considered as the control variables. There are dummy
variables in the model to explore the difference between the six areas of Vietnam.
<b>1.6. </b> <b>Significance of the study </b>
This thesis contributes two significant points:
Firstly, the thesis uses the most updated database available that were collected from
the GSO – a trustworthy Vietnamese data source. Hence, the estimation result of
this thesis illustrates the most updated situation of the population and the economic
growth of Vietnam.
Secondly, the previous Vietnamese papers mostly use national-scales data to
estimate the population's impact on economic growth, while this thesis uses
provincial-scales data for analysis.
<b>1.7. </b> <b>Thesis’ structure: </b>
</div>
<span class='text_page_counter'>(16)</span><div class='page_container' data-page=16>
8
Chapter 01: Introduction – in this chapter, an overview of the population in
Vietnam, population policy, and the necessary information of this thesis, such as
research purposes, research questions, research methods, and study’s contributions
are introduced briefly.
Chapter 02: The literature review concentrates on showing the previous academic
works on this topic in the past. This chapter is divided into three central parts. At
first, the international papers in the related subject are briefly described and then
move on to Vietnamese papers, which is exploring the relationship between
population and economic growth. After reviewing the previous documents, both
internationally and domestically, I discuss the research gap.
Chapter 03: Research Methodology – This chapter discusses the methodology and
introduces the model used in the thesis. Moreover, the reason for choosing the
model and variables, and the explanation of some variables will be described in
more details. The two hypotheses of this thesis are also discussed.
Chapter 04: Data – this chapter focusses on the description of the data collection
step by step. The data used for analyzing will be described in details.
Chapter 05: Estimation result – in which the Random Effect model is used. The
discussion of the result is divided into two main parts. In the first part, the impact of
the change in the working-age population on the economic growth based on the
correlation coefficient of the primary explanatory variable on the dependent
variable after running the model. In the second part, I discuss the impact of other
factors in the economic growth model.
</div>
<span class='text_page_counter'>(17)</span><div class='page_container' data-page=17>
9
<b>CHAPTER 2: LITERATURE REVIEW </b>
This chapter includes three major parts: reviewing the literature from
Vietnamese papers and literature from international articles, which focuses the links
between population and economic growth. In the 3rd part of this chapter, the
research gaps are shown.
<b>2.1. </b> <b>International literature on the impacts of changing population </b>
<b>structures on economic growth: </b>
Throughout the world, the question of whether or not population growth affects
economic growth is raised by both demographers and economists. In the past,
various points of view regarding the impacts of population growth on development
have appeared. Coale & Hoover (1958) believe that an increase in the population
harms growth. While Simon (1981) – one of the optimists, believes that a
population increase leads to positive economic growth.
However, the change in the population age structure due to demographic transition
has various social and economic implications. Several studies explore the vital role
of changing population structure on economic growth by cross-country data. The
first paper that should be mentioned is the paper of David E. Bloom and Jeffrey G.
Williamson (1998). The paper estimates the impact of demographic variables on
economic growth, and the results show that future demographic change will tend to
depress growth rates in East Asia, while it will promote more rapid economic
growth in Southeast and South Asia. This model is considered the first model, in
which the demographic variables was taken into account.
̃ ( )
</div>
<span class='text_page_counter'>(18)</span><div class='page_container' data-page=18>
10
<b>Table 2.1. Bloom and Williamson (1998)’s variables </b>
<b>Order </b> <b>Variable </b> <b>Calculation method </b>
1 <sub> ̃</sub> Growth rate of real GDP per capita in 1965-90
̃
N: total population, L: the number of workers, y:
output per worker and ̃ : output per capita
2 ( ) Income per worker at time
3 <sub> </sub> Growth rate of economically active population,
1965-90
4 <sub> </sub> Population growth rate, 1965-90
5 - Population:
+ Growth rate of population under age 15
+ Growth rate of population over age 64
+ Growth rate of the dependent population
+ Average birth rate, 1967-87
+ Average death rate, 1967-87
+ Average infant death rate, 1967-87
+ Average noninfant death rate, 1967-87
+ Log life expectancy, 1960
- Education:
+ Log years of secondary schooling, 1965
(average years of secondary school for population
age 25 or older)
- Economy:
</div>
<span class='text_page_counter'>(19)</span><div class='page_container' data-page=19>
11
<b>Order </b> <b>Variable </b> <b>Calculation method </b>
capita, 1965
+ Government savings as a share of GDP, 1970-90
- Other:
+ Natural resource abundance (share of primary
product exports in GDP in 1971)
+ Access to ports dummy (indicating if the
country is landlocked)
+ Openness
+ Tropics dummy (indicating if country is located
between the tropics)
+ Ratio of coastline to land area
+ Quality of institutions (index of quality of
governmental institutions)
The model proposed by Bloom & Williamson (1998) is considered as guidance for
identifying the primary relationship between population composition and economic
change. Based on this model, Mikiko (2015) develops a regression equation to
explore how the population composition by age group related to real GDP per
capita in Japan and to explore how the dependency ratio related to economic
change. In her equation is:
( ) = ( <sub> </sub>) + ( <sub> </sub>) + ( <sub> </sub>) +
<i>t: the time index </i>
<i>j: a lag value of 0 or 1 </i>
<b>Table 2.2. Mikiko (2015)’s variables </b>
<b>Order </b> <b>Variable </b> <b>Calculation method </b>
</div>
<span class='text_page_counter'>(20)</span><div class='page_container' data-page=20>
12
<b>Order </b> <b>Variable </b> <b>Calculation method </b>
̃
N: total population, L: the number of workers, and
̃ : output per capita
2 Population by age group (15-24, 25-34, 35-44,
45-54, 55-59, 60-64, 65-69, 70-74, 75+) or Youth and
elderly dependency ratios.
3 , Control variable:
- Level of schooling,
- Density
- Working hours
- Manufacturing share
- Female labour
- Employment labour
- Employment
Mikiko (2015) applied the data from Japan for the period 1975-2011. The results
are impressive. She divides the elderly population into three groups, ages 65-69,
70-74, 75+. The coefficients between these groups and real GDP per capita are
negative. However, the results illustrate that the 70-74 population age groups have a
negative link to economic growth, while the 75+ age group has a positive relation
with Japanese economic change.
</div>
<span class='text_page_counter'>(21)</span><div class='page_container' data-page=21>
13
In some aging and aged countries such as Taiwan, China, Japan, and the U.S., there
are various ways that economists consider the impact of population aging on the
economy. Houang, Lin & Lee (2019) prove that although the aging workforce in
Taiwan has influenced economic growth positively, the elderly dependency ratio
still poses a significantly negative impact on economic change. In another paper
focusing on the impact of the aging process on trade balance, Fu (2013) finds that
population aging affects the trade balance in a certain extent. However, “the
influence is conditional and especially different between developed and developing
countries.” Besides, Maestas, Mullen & Powell (2016) use the U.S. States data from
1980 to 2010 to calculate the influence of aging population on national output per
capita. Their estimation result is that “a 10% increase in the fraction of the
population ages 60+ decreases the growth rate of GDP per capita by 5.5%”. In these
papers mentioned above, the data of the population is divided into several age
groups for analysis. For instance, the elderly population is divided into 60-69,
70-79, 80-89 and the working-age population is divided into 5-7 age groups. This is
important because each age-group would contribute to the economic growth in
different magnitude and different ways. In Vietnam, there is still a limitation for
collecting data in this way, especially on the provincial scale.
<b>2.2. </b> <b>Vietnamese literature on the impacts of changing population structures </b>
<b>on economic growth in Vietnam: </b>
</div>
<span class='text_page_counter'>(22)</span><div class='page_container' data-page=22>
14
capita was higher in the provinces with higher human capital levels. Nguyen & Ha
(2010) had a more specific result. They used data on population growth rate and the
proportion of working-age population to total population to estimate the advantage
of the so-called “golden population period” in Vietnam. They pointed out that an
increase in the working-age population has a significant impact on economic
growth. From 1999-2009, change in the population’s age structure has contributed
2.29% to the economic growth rate.
There are three Vietnamese papers used another method, so-called National
Transfer Accounts (NTA) method, to estimate the influences of changing
population age structure on Vietnamese economic growth. These papers using NTA
method are “Effects of population age structure changes on economic growth in
Vietnam” of Bui (2012); “Estimating NTA for urban and rural areas in Vietnam” of
Giang and Pham (2012) and “Impact of population’s age structure changes on
economic growth in Vietnam and policy recommendations” of Giang et. al. (2015).
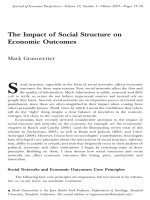
<b>Figure 2.1. An example of life-cycle surplus </b>
</div>
<span class='text_page_counter'>(23)</span><div class='page_container' data-page=23>
15
The NTA is different from other methods because it focuses on a life-cycle surplus
of a person. Figure 2.1 shows an example of a life-cycle surplus in Giang (2015)’s
paper. The life-cycle surplus of typical Vietnamese starts from age 23 to 53. It
means that the population aged 23-53 had income higher than consumption, and
they created savings, which in turn could stimulate economic growth. Therefore,
this age group has a positive relation with economic growth. These results are
similar among three papers, although these papers using different time scales
(VHLSS 2008 and VHLSS 2012) and different area scales (the whole country and
urban/rural area). In addition, Bui (2012) finds that population aged 20-54
contributes 2,91% to the growth rate of GDP per capita from 1989-1999, and this
figure falls to 2,75% in the period from 1999-2000.
In NTA method, the IO table should be in the same year or closest to the VHLSS
data. There is an updated data for VHLSS which is VHLSS 2016, but there is no
update on I/O Table. Therefore, there is no room for applying this method.
<b>2.3. </b> <b>Research gap </b>
</div>
<span class='text_page_counter'>(24)</span><div class='page_container' data-page=24>
16
<i><b>Table 2.3. Compare and contrast to previous research papers </b></i>
My research Mikiko Oliver (2015) Nguyen (2012)
Time of the
data
2011-2017 1975-2011 1979-2009
Scale Province (Vietnam) National scale (Japan) National scale
(Vietnam)
Model ( )
( )
( )<sub> </sub>
( <sub> </sub>)
(
) = ( )
+ ( <sub> </sub> ) +
( <sub> </sub>) +
̃ -
Estimate
method
RE OLS Model life table
Result Expected result:
estimate changing in
working-age
population and
changing in the
dependent
population affect
economic growth
through GRDP per
capita.
An increase in the 70-74
population age group is
associated with a
decrease in economic
growth, while an increase
in the 75 and over
population age group is
associated with an
increase in economic
growth in Japan.
From 1979-1999,
decreasing in growth
rate of population
combined with rising
in growth rate of
working-age
</div>
<span class='text_page_counter'>(25)</span><div class='page_container' data-page=25>
17
My research Mikiko Oliver (2015) Nguyen (2012)
the period
1999-2009 was 1,19%.
<b>2.4. </b> <b>Conclusion </b>
</div>
<span class='text_page_counter'>(26)</span><div class='page_container' data-page=26>
18
<b>CHAPTER 3: METHODOLOGY </b>
<b>3.1. </b> <b>Overall Quantitative Analysis and the Econometrics </b>
Only a quantitative method is used in this thesis, longitudinal data analysis using
STATA application version 16.0. For the testing model, starting with simple OLS
regression. After that, more advanced panel data methods are tested, which are
Fixed Effect (FE) and Random Effect (RE).
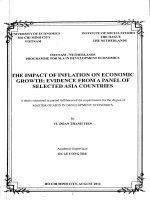
For testing the model, the author utilizes two tests. Firstly, in order to decide
between a random-effects regression and a simple OLS regression, The Breusch and
Pagan Lagrangian multiplier (LM) test is used. The LM test’s null hypothesis is that
there is no significant difference across units. After running the RE model, type
“xttest0” command in STATA, the result of LM test is shown below:
<b>Figure 3.1. The LM test result </b>
</div>
<span class='text_page_counter'>(27)</span><div class='page_container' data-page=27>
19
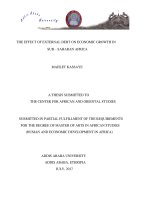
Secondly, the Hausman test is used to test which model FE or RE is better. There
are three steps to do this test. Step 1: Run the FE model, save the estimation result.
Step 2: Run the RE model and save the estimation result. Last step: Run the
“hausman fixed random” command in STATA. The results of running Hausman test
is below:
<b>Figure 3.2. The Hausman test result </b>
The P-value of both the Breusch & Pagan Lagrangian multiplier test and Hausman
test is 0.0000, very significant. It means that the RE model is more appropriate than
the FE model and the simple OLS model for the collected panel data. Therefore, the
Random-effect model is chosen to employ in this thesis.
</div>
<span class='text_page_counter'>(28)</span><div class='page_container' data-page=28>
20
The regression used in this thesis is shown as bellow:
( <sub> </sub>)
( )<sub> </sub> ( )<sub> </sub> ( <sub> </sub>)
( )<sub> </sub>: is working-age population in year t and province i;
( )<sub> </sub>: is dependent population in year t and province i;
X: contain nine control variables which are (i) Population density; (ii) Share of
Industry and Construction to GRDP, (iii) Share of Agriculture, Forestry and Fishing
to GRDP; (iv) PCI; (v) Life Expectancy; (vi) Foreign Direct Investment; (vii) The
percentage of female labour age 15+; (viii) working hours; (ix) trained employed
and five dummy variables.
The nine control variables are chosen based on previous papers mentioned in the
Literature review. Except the PCI, which is represented for governance efficiency,
is added to check whether or not the governance of the provincial government
involves improving the outcome per capita, which is calculated by GRDP divided to
total population. These variables’ descriptions are shown in Table 3.1 and Table
3.2.
The name of Dependent Variable, Explanatory Variables, Control Variables, and
the sources are described in the following table. The definition of variables which
was collected from GSO will be quoted directly from Statistical Yearbook of
Vietnam:
<i><b>Table 3.1. Independent and Dependent Variables’ definition and source </b></i>
<b>Variables </b> <b>Source </b> <b>Definition </b>
GRDP per capita Calculated
based on raw data
</div>
<span class='text_page_counter'>(29)</span><div class='page_container' data-page=29>
21
<b>Variables </b> <b>Source </b> <b>Definition </b>
from the GSO
Working-age
population
GSO The working-age population is
Labour force which includes the
employed and unemployed person
at 15 years of age and above by
province.
Dependent
population
Calculated
based on raw data
from the GSO
Since the total population and
labour force at 15-year-old can be
collected from GSO. Dependent
population is calculated by Total
population minus Labour force.
Fomular (2) part 3.3 Index
Calculation
Population density GSO The average number of people
per square kilometer of the
terriorial area, calculated by
dividing the population (time point
or average) of a certain residential
area to the area of that territory.
Share of Industry and
Construction to
Calculated
based on raw data
</div>
<span class='text_page_counter'>(30)</span><div class='page_container' data-page=30>
22
<b>Variables </b> <b>Source </b> <b>Definition </b>
GRDP (%) from the GSO
Share of Agricuture,
Forestry and Fishing
to GRDP (%)
Calculated
based on raw data
from the GSO
Fomular (4) part 3.3 Index
Calculation
PCI VCCI The Provincial Competitiveness
Index is used for ranking the
performance, capacity and
willingness of provicial
governments to business-friendly
regulatory environments for private
sector development.
Life Expectancy at
birth (years)
GSO Reflects the prospect of a newborn
could live for how many years if
the current mortality model is
maintained, this is the key
statistical indicator of the Life
table.
FDI (Mill. USD) GSO Foreign direct investment projects
licensed in year t by province.
Female labour force
participation rate (%)
</div>
<span class='text_page_counter'>(31)</span><div class='page_container' data-page=31>
23
<b>Variables </b> <b>Source </b> <b>Definition </b>
15 and above by province.
Working hours GSO This is the average of
working-hours per week of 15-year-old and
older employees by province.
Trained employed
population (%)
GSO This is the percentage of trained
employed population at 15 years of
age and above by province
There are six areas in Vietnam, namely Red River Delta (RRD), Northern midlands
and mountain (NMM), North Central and Central coastal (NCC), Central Highlands
(CH), South East (SE), and Mekong River Delta (MRD). Each area has its
characteristics of Geography, Area, Population density, Culture as well as Climate.
These differences in characteristics will lead to the difference in the development of
the social-economic of each area. Therefore, to get a better estimation, there are five
dummy variables for each area are created and shown in the following table:
<b>Table 3.2. Dummy Variables for Areas </b>
dum_Mekong_River_Delta 1 0 0 0 0 0
</div>
<span class='text_page_counter'>(32)</span><div class='page_container' data-page=32>
24
<b>3.3. </b> <b>Index calculation </b>
(1)
<sub> </sub> <sub> </sub> <sub> </sub> (2)
(3)
<sub> </sub>
(4)
<b>3.4. </b> <b>Expected signs of Variables </b>
Based on the Economic Theory and the results of previous paper mentioned in
Chapter 2, Literature Review, there are expected signs’ coefficients of variables
between GRDP per capita and independent variables which are shown in the
following table:
dum_North_Center_and_CCA 0 0 1 0 0 0
dum_Red_River_Delta 0 0 0 1 0 0
dum_South_East_Area 0 0 0 0 1 0
Northern midlands and
</div>
<span class='text_page_counter'>(33)</span><div class='page_container' data-page=33>
25
<b>Table 3.3. Expected signs of Variables </b>
<b>Variables </b> <b>Sign </b> <b>Variables </b> <b>Sign </b>
ln_wa_population + lnagri_share +
lndepend_pop - lntrain_employed +
lndensity - pci +
lnindustry_share + FDI +
lifeexpectancy + femalelabour +
Working_Hours +
Note: the variables which have its name start with “ln” are in natural logarithm
forms.
<b>3.5. </b> <b>Hypothesis </b>
In this thesis, there are two alternative hypotheses tested, which are:
H1. The change in the working-age population has positive changes in GRDP per
capita.
Another hand,
H2. The increase in the number of dependent people, including older people and
youth, will lead to a decrease in the GRDP per capita.
<b>3.6. </b> <b>Conclusion </b>
</div>
<span class='text_page_counter'>(34)</span><div class='page_container' data-page=34>
26
</div>
<span class='text_page_counter'>(35)</span><div class='page_container' data-page=35>
27
<b>CHAPTER 4 DATA </b>
<b>4.1. </b> <b>Data collection </b>
There were three steps used to collect the data related to the population as well as
data of GRDP of 63 provinces, cities of Vietnam:
- Step 1: Noted down all the variables could be included in the model
after reviewing all the material such as books, previous papers, articles on
this topic.
- Step 2: Separate the potential variables into two catalogs: The variables
could be downloaded directly from GSO, and other websites and variables
have to be calculated by hand.
- Step 3: All the data was put into an excel file, calculated the needed
variables by using some simple formulas. After that, all the data is imported
to STATA to analyze.
Due to the limited data source, several expected variables could not be found to
include in the model. For example, the labor force data from 15-year-old and above
divided to age group by province, or employed population from 15-year-old and
above by kinds of economic activity by province.
<b>4.2. </b> <b>Data descriptive </b>
<b>Table 4.1. Descriptive statistics of variables </b>
Variable Obs Mean Std.Dev. Min Max
</div>
<span class='text_page_counter'>(36)</span><div class='page_container' data-page=36>
28
The following table illustrates the description of the data which is collected and
used in this thesis. The data included 441 observations; there is no missing
observation. Therefore, the data is a perfect balance. The time scale is seven years,
from 2011 to 2017.
<b>4.3. </b> <b>Conclusion </b>
In this chapter, the process of data collection and description of the data are
explained in detail. All the data comes from the Statistical Yearbook of Vietnam,
Statistical Yearbook of each province and cities, Report on Labour Force Survey
which were published by GSO, exclude the data of PCI which is collected from the
website: owned by Vietnam Chamber of Commerce and
Industry (VCCI). All the data are collected at the provincial level in 7 years from
2011 to 2018. There are 63 provinces and cities in Vietnam. Therefore, the number
<b>of observations is 441. </b>
lnindustry_share 441 -1.214073 0.4605735 -2.14475 -0.1347058
lnagri_share 441 -1.607707 0.8285776 -4.945346 -0.6076715
lntrain_employed 441 2.722177 0.3805621 1.629241 3.758872
pci 441 58.84549 3.88742 45.12 73.53
FDI 441 371.4664 802.1101 -7.4 6745.4
femalelabour 441 76.85578 34.15619 7.8 771
Working_Hours 441 44.07982 2.754076 34 51.9
Province/City 63
</div>
<span class='text_page_counter'>(37)</span><div class='page_container' data-page=37>
29
<b>CHAPTER 5: ESTIMATION RESULT </b>
By using STATA application version 16.0, the estimation result of longitudinal data
by RE method is shown in the following table:
<b>Table 5.1. Estimation Result </b>
VARIABLES Random Effects
Model 1 Model 2
ln_wa_population 0.116** 0.126**
(0.0570) (0.0568)
lndepend_pop -0.0791
(0.0482)
lndensity -0.139** -0.0900
(0.0584) (0.0611)
lnindustry_share 0.215*** 0.223***
(0.0294) (0.0295)
lnagri_share -0.637*** -0.623***
(0.0310) (0.0324)
lntrain_employed 0.120*** 0.117***
(0.0174) (0.0174)
PCI 0.00261***
(0.000799)
lifeexpectancy 0.228*** 0.216***
(0.0144) (0.0145)
FDI 3.32e-06 6.84e-06**
(2.63e-06) (2.82e-06)
femalelabour -2.91e-05 -2.49e-05
(6.19e-05) (6.06e-05)
Working_Hours -0.00221***
(0.000858)
dum_North_Center_and_CCA -0.368*** -0.330***
(0.0921) (0.0919)
dum_Mekong_River_Delta -0.203 -0.189
(0.127) (0.125)
</div>
<span class='text_page_counter'>(38)</span><div class='page_container' data-page=38>
30
VARIABLES Random Effects
(0.141) (0.140)
dum_South_East_Area -0.695*** -0.621***
(0.140) (0.139)
dum_Central_Highlands 0.663*** 0.691***
(0.122) (0.122)
Constant -1.110 0.332
(1.086) (1.137)
R-squared 0.8067 0.8192
Observations 441 441
Number of id_province 63 63
Standard errors in parentheses
*** p<0.01, ** p<0.05, * p<0.1
Table 5.1 shows the result after using RE method for two models. The second
model that uses three additional variables which are dependent population, working
hours, and PCI.
There are reasons to add these variables to the model number 2. Firstly, dependent
population variable is added to check how the coefficient of the economically active
population variable change when the dependent population joins in the regression
and to test the hypothesis H2. Secondly, the PCI is added to see whether or not the
provincial government's governance involves in improving economic growth. Note
that when the three variables are included, the coefficient on FDI becomes very
significant compare to the model 1. Thirdly, the average working hours per week in
Vietnam is high at 44 hours per week (see Table 4.1). In theory, there could be two
opposite points of view. Longer hours worked could lead to higher productivity
(Feldstein, 1967), while (Pencavel, 2015) states that the marginal effect on
productivity start decreasing if workers have to work extra hours. Although in this
research, economic growth is measured by GRDP per capita, not productivity, it
also provides a piece of evidence to support one of the theories mentioned above.
Eventually, the model 2 seems to fit well.
</div>
<span class='text_page_counter'>(39)</span><div class='page_container' data-page=39>
31
Based on the result in Table 5.1: Estimation results, it can be seen that working-age
population has a positive relationship and has a significant impact on economic
growth. In other words, when the population in the working-age increase, the
economy also rises. This result supports the Optimistic Theory, which believes that
population growth has a positive impact on economic growth.
This result is similar to a previous paper of Nguyen & Ha (2010). However, the
correlation coefficient of ln_wa_population reported in Table 5.1 indicates that at a
0.05 significance level, the average effect of ln_wa_population over GRDP per
capita when ln_wa_population changes across year and between area by 1% is
0.126%. In other words, the population's proposition raises 1%, with a 0.126%
increase in the rise of the GRDP per capita. In previous papers, this figure was
0,83% in 1989-1999 – Nguyen (2012) and 2,29% in 1999-2009 - Nguyen & Ha
(2010).
Nguyen (2012) stated that the contribution of the proposition of working-age
population to economic growth would decrease because of aging population.
Hypothesis H1: The change in the working-age population has positive changes in
GRDP per capita is excepted. While the P-value of lndepend_pop variable is very
high, it means that this coefficient is not significant. Therefore, hypothesis H2: The
increase in the number of dependent people, including older people and youth, will
lead to a decrease in the GRDP per capita is rejected.
<b>5.2. </b> <b>Impact of other factors on GRDP per capita: </b>
Averagely, at a 0.01 significant level, six control variables show a significant
impact on the province's output per capita:
</div>
<span class='text_page_counter'>(40)</span><div class='page_container' data-page=40>
32
of -0,62 percentage point in GRDP per capita.
- In terms of FDI and PCI, although the PCI's coefficient shows that it has a positive
effect on economic growth, but the magnitude of its effect is not too large. When
the PCI raises a 0.00261 score, the GRDP per capital increase by 1%. While FDI
increases 1 million USD is associated with an increase of 1% on GRDP per capita.
- In terms of working hours. Working hour is considered as one of the foremost
labor inputs; therefore, the more working hours, the more output will be produced.
However, in this research, the result indicates that working hours negatively affect
the independent variable. In other words, reducing the working hours by 1 hour will
make people's quality of life measured by economic outcome per capita increase by
1%. This result would support the debate of wherever or not, Vietnam government
should reduce the working-hour in order to enhance productivity.
- In terms of dummy variables, the coefficient for areas dummy variables provides a
measure of the difference between the areas identified by the dummy variable
(MRD, CH, NCC, RRD, SE) and the area that serves as a reference (NMM). Here,
the coefficient for NCC, RRD, SE and CH area are -0,33; -0,618; -0,621 and 0,691,
respectively. These results suggest that, after the effects of all explanatory and
control variables are taken into account, only CH area scores 0.691 points higher on
the GRDP per capita than the reference area (NMM). Another area like NCC, RRD,
and SE score 0,33; 0,618; 0,621 points lower on the GRDP per capita than NMM
area, respectively.
However, the other variable, such as lndensity and femalelabour, do not show any
significance concerning the GRDP per capita.
<b>5.3. </b> <b>Conclusion: </b>
</div>
<span class='text_page_counter'>(41)</span><div class='page_container' data-page=41>
33
</div>
<span class='text_page_counter'>(42)</span><div class='page_container' data-page=42>
34
<b>CHAPTER 6: POLICY RECOMMENDATIONS </b>
<b>6.1. </b> <b>Policy recommendations: </b>
The results discussed in Chapter 5 demonstrates that from 2011 to 2017, the average
effect of working-age population over GRDP per capita when it changes across
seven years and between provinces/cities is positive. Some previous papers predict
that the “Golden population structure”2 start in 2006 and will end in 2047 (Nguyen,
2010) or “Demographic dividend”3 of Vietnam will last until 2041 (Giang, 2015).
However, either of “Golden population structure” and “Demographic dividend” do
not bring high economic growth by themself automatically. The Vietnamese central
government as well as local governments should pay attention to develop long-term
policies to utilize the labor force effectively.
Firstly, education plays a vital role in improving labor productivity. Not only
children need to study, but also the young and middle-age population need to learn
to obtain advanced knowledge and skills in their field. The higher skills and the
better qualification they get through training and life long learning, the higher labor
productivity a state would get. Specifically, the estimation results of this research
illustrates that an increase of 1 percentage point in the number of trained employed
population is associated with an increase of 0.117 percentage points in GRDP per
capita.
2
Based on demographics approach, a country is considered to have “Golden
population structure” when the share of children (0-14 years of age) is smaller than
30% and the share of old people (aged 65 and over) is lower than 15%.
3
</div>
<span class='text_page_counter'>(43)</span><div class='page_container' data-page=43>
35
Secondly, the productivity in agroforestry and fisheries is lower than in other
sectors in terms of industrial perspective. Although Vietnam has set goals in
industrialization and modernization and the GDP growth mainly relies on
manufacturing and service sectors, agroforestry and fisheries still have an essential
role not only in the economy but also in the livelihood of residents in rural areas.
Therefore, it is necessary to pay more attention to improve infrastructure, improve
the quality of plant varieties, as well as apply modern equipments with high
technologies. Besides, the government should develop and strengthen disaster
prevention systems for areas that usually suffer from floods and typhoons to
minimize the impacts of natural disasters on agricultural production.
Last but not least, older persons gradually increase, nevertheless it is not a sign of
harm to economic growth. Various papers proved that older persons keep their
contributions to the economy by participating in both formal and informal
workforce (HelpAge International 2016). In Vietnam, the life expectancy has
increased and life qualify also has improved through the last few decades. Older
people nowadays have a long healthy life after retirement at age 55-year-old for
female and 60-year-old male. Therefore, promoting older people’s employment
should be a priority. Raising the retirement age is an appropriate policy when the
pension age of Vietnam is lower than other developing countries. However, creating
job opportunities for the aging workforce and maximizing utilization of the
high-qualifying older human resource are needed. The old-age workforce would
contribute to enhancing workforce productivity in many indirect ways, such as
participating in training, sharing their skills and experience of their working-life to
younger, or working in unpaid care work like taking care of their daughter/son’s
children.
<b>6.2. </b> <b>Limitations: </b>
</div>
<span class='text_page_counter'>(44)</span><div class='page_container' data-page=44>
36
Firstly, this research mainly focuses on the working-age population due to limited
data sources. There was no specific data for each age-group, only data at
provincial-scales for total population and population in the working-age were found. It would
be better if there are separated data for the youth population and the elderly
population by age group and by province.
Secondly, in this research, several variables are not taken into model such as
migration and labor export variable, and urbanization rate variable. For instance,
according to data of the net-migration rate by province provided by GSO, this figure
has fluctuated between cities/provinces. The immigration rate of big cities and
industrial provinces is very high compared to the agricultural provinces. This
movement somehow affects the labor force balance of each province and should be
considered to measure how it affects the economy as a whole.
Thirdly, this thesis employs RE method, therefore one of its limitations is that it
cannot estimate the reverse causality of economic growth to the changes in
population structure. Additionally, the time scales is short, only 7 years. Thus, there
is no lag variables included in the model.
<b>6.3. </b> <b>Conclusion </b>
Chapter 6 is the last chapter; some recommendations for policy implementation are
provided. The Vietnamese government should invest in training for the labor force,
improve the agroforestry sector's productivity, and maximize the utility of the
old-age workforce for economic growth. Besides, the limitations of this thesis are also
included.
</div>
<span class='text_page_counter'>(45)</span><div class='page_container' data-page=45>
37
<b>REFERECES </b>
Bloom, D.E. & Williamson, J.G. (1998), “Demographic transitions and economic
miracles in emerging Asia”, World Bank Economic Review, Vol.12 No.3, pp.
419-455.
Mikko, O. (2015), “Population ageing and economic growth in Japan”, International
Journal of Sociology and Social Policy. Vol.35 No11/12, pp.841-863.
Huang, W. and Lin, Y. and Lee.H. (2019), “Impact of Population and Workforce
Aging on Economic Growth: Case Study of Taiwan. Sustainability, 11, 6301;
doi:10.3390/su11226301.
Jiasha, F. (2013), “The impact of Population Aging on economy: Evidence from
China and Japan”, Dissertation Submitted in Partial Fulfillment of the
Requirements for the Degree of Doctor of Philosophy. Graduate School of
Economics and Management, Tohoku University of Japan.
Nicole, M. & Kathleen, J. M. & David. P (2016), “The effect of Population Aging
on Economic Growth, the Labor Force and Productivity”, RAND Labor &
Population, WR-1063-1.
Bui, T.M.T. (2012). “Effects of population age structure changes on economic
growth in Vietnam. PhD dissertation. National Economics University.
Nguyen, D.C. & Ha, T.A. (2010). “Demographic structure change and forecast of
demographic window of opportunity in Vietnam”. Hanoi: National Economics
University.
</div>
<span class='text_page_counter'>(46)</span><div class='page_container' data-page=46>
38
Giang, T.L. & Pham, N.T. (2012). “Estimating NTA for urban and rural areas in
Vietnam”. Report on NTA study prepared by the Institute of Public Policy and
Management, National Economics University.
UNDP & HelpAge International (2018). “Ageing, older person and the 2030
Agenda for sustainable development.
GSO (1989, 1999, 2009, 2018). Vietnam Population and Housing census year.
GSO (2015). Forecasting Vietnam’s population, 2014-2049.
GSO (2011-2017). Statistical Yearbook Vietnam of Vietnam from 2011-2017
UNFPA, Vietnam’s Ageging population,
</div>
<!--links-->