Factors affecting intention to subscribe SVOD in Vietnam
Bạn đang xem bản rút gọn của tài liệu. Xem và tải ngay bản đầy đủ của tài liệu tại đây (2.14 MB, 96 trang )
<span class='text_page_counter'>(1)</span><div class='page_container' data-page=1>
<b>VIETNAM</b>
<b>x</b>
<b>NATIONAL</b>
<b>x</b>
<b>UNIVERSITY, HANOI </b>
<b>VIETNAM</b>
<b>x</b>
<b>JAPAN</b>
<b>x</b>
<b>UNIVERSITY </b>
<b>--- </b>
<b>LE PHU KHANH </b>
<b>FACTORS AFFECTING INTENTION TO </b>
<b>SUBSCRIBE TO SUBSCRIPTION VIDEO </b>
<b>ON DEMAND SERVICES IN</b>
<b>x</b><b>VIETNAM </b>
<b>MASTER’S THESIS</b>
<b>x </b>
</div>
<span class='text_page_counter'>(2)</span><div class='page_container' data-page=2>
<b>VIETNAM</b>
<b>x</b>
<b>NATIONAL</b>
<b>x</b>
<b>UNIVERSITY, HANOI </b>
<b>VIETNAM</b>
<b>x</b>
<b>JAPAN</b>
<b>x</b>
<b>UNIVERSITY </b>
---
<b>LE PHU KHANH </b>
<b>FACTORS AFFECTING INTENTION TO </b>
<b>SUBSCRIBE TO SUBSCRIPTION VIDEO </b>
<b>ON DEMAND SERVICES IN</b>
<b>x</b><b>VIETNAM </b>
<b>MAJOR:</b>
<b>x</b>
<b>BUSINESS ADMINSTRATION </b>
<b>CODE:</b>
<b>x</b>
<b>8340101.01 </b>
<b>RESEARCH</b>
<b>x</b><b>SUPERVISORS: </b>
<b>Prof. Dr. MOTONARI TANABU </b>
<b> Dr. TRAN HUY PHUONG </b>
</div>
<span class='text_page_counter'>(3)</span><div class='page_container' data-page=3>
<b>ACKNOWLEDGMENT </b>
First of all, I would like to give my thanks to Prof.Dr. Montonari Tanabu and
Doctor Tran Huy Phuong for helping and give me a lot of valuable advice
during the time I was conducting this master thesis.
Second, I would like to thank Prof. Matsui, Hanh sensei, Hino sensei, Tuan
sensei for giving me comments to improve my thesis on internal defense on
20
thMay. Moreover, I would like to thank the reviewers, including Prof.
Matsui, Prof.Morita, Hanh sensei. Tuan sensei, Lien sensei for giving me
comments on final defense on 24
thJune.
In addition, I would like to give many thanks to my family, who has
supported me and motivated me a lot in the time I got difficult in doing the
thesis.
</div>
<span class='text_page_counter'>(4)</span><div class='page_container' data-page=4>
<b>Table of Content </b>
<b>ACKNOWLEDGMENT</b>
<b>LIST OF TABLES</b>
<b>LIST OF FIGURES</b>
<b>LIST OF ABBREVIATION</b>
<b>CHAPTER 1: INTRODUCTION</b> ... 1
1.1 Research Background ... 1
1.2 Research Objective ... 4
1.3 Research Question ... 4
1.3 Research Subjective and Research Scope ... 4
1.4 Research Contribution ... 4
<b>CHAPTER 2: LITERATURE REVIEW AND HYPOTHESIS </b>
<b>DEVELOPMENT</b> ... 6
2.1 Review of related definition and previous research ... 6
<i>2.1.1 Definition of OTT platform</i>... 6
<i>2.1.2 Definition of Streaming</i> ... 6
<i>2.1.3 Definition of Video on demand (VOD)</i> ... 7
<i>2.1.4 Definition of Subscription Video on demand (SVOD)</i> ... 8
<i>2.1.5 Related research & research gap</i> ... 9
2.2 Review of the relevant theoretical model of technology adoption: ... 14
<i>2.2.1 Theory of reasoned action (TRA)</i> ... 14
<i>2.2.2 Theory of planned behavior (TPB)</i> ... 15
<i>2.2.3 Technology acceptance model (TAM)</i> ... 15
<i>2.2.4 Unified theory of acceptance and use of technology (UTAUT)</i> ... 16
<i>2.2.5 Reason why the author choosing UTUAT2 as theoretical framework</i> ... 18
2.3 Hypothesis development and conceptual model ... 18
<i>2.3.1. Performance Expectancy ... 19 </i>
<i>2.3.2. Effort Expectancy</i> ... 20
<i>2.3.3. Social Influences</i> ... 21
</div>
<span class='text_page_counter'>(5)</span><div class='page_container' data-page=5>
<i>2.3.5. Price Value</i> ... 22
<i>2.3.6. Facilitating condition</i> ... 23
<i>2.3.7. Consumer Innovativeness</i> ... 23
<i>2.3.8. Media exposure</i> ... 24
2.4 Research conceptual model ... 27
<b>CHAPTER 3: METHODOLOGY</b> ... 28
3.1. Research process ... 28
3.2. Sampling and data collection ... 29
3.3. Sample Population ... 29
3.4. Variable and Measuring Instrument ... 29
3.5. Analysis Method ... 32
<i>3.5.1 Descriptive analysis</i> ... 32
<i>3.5.2 Inferential analysis</i> ... 33
<b>CHAPTER 4: ANALYSIS RESULTS</b> ... 36
4.1 Data Description ... 36
4.2 Reliability analysis ... 38
4.2. Explanatory Factor Analysis ... 38
<i>4.3.1</i> <i>Explanatory Analysis for independent variable</i> ... 38
<i>4.3.2</i> <i>Explanatory Analysis for dependent variable</i>... 40
<i>4.3.3</i> <i>Explanatory Analysis for moderation variable</i>... 40
4.3. Regression Analysis ... 41
4.4. Moderation Analysis... 42
4.5 Hypothesis tested results ... 44
<b>CHAPTER 5: DISCUSSION AND CONCLUSION</b>... 46
5.1. Finding and Discussion ... 46
5.2. Contribution of the thesis ... 50
5.3. Implications for SVOD service providers ... 50
5.4. Limitation and future research direction... 52
<b>REFERENCES</b> ... 54
</div>
<span class='text_page_counter'>(6)</span><div class='page_container' data-page=6>
<b>APPENDIX 2: Cronbach’s alpha analysis ... 75 </b>
<b>APPENDIX 3: Explanatory Analysis</b> ... 80
<b>APPENDIX 4: Pearson Correlation Analysis</b> ... 84
<b>APPENDIX 5: Regression analysis</b> ... 85
</div>
<span class='text_page_counter'>(7)</span><div class='page_container' data-page=7>
i
<b>LIST OF TABLES</b>
<b>Table 2.1: Construct's definition</b> ... 19
<b>Table 3.1: Measurement Scale of thesis</b> ... 30
<b>Table 4.1: Cronbach’s alpha for all variable</b> ... 38
<b>Table 4.2: EFA Results for Independent variable</b> ... 39
<b>Table 4.3: EFA Results for Dependent Variable</b> ... 40
<b>Table 4.4: EFA Results for Moderator</b> ... 40
<b>Table 4.5: Results of Pearson Analysis</b> ... 41
<b>Table 4.6: Results of regression analysis</b> ... 41
</div>
<span class='text_page_counter'>(8)</span><div class='page_container' data-page=8>
ii
<b>LIST OF FIGURES </b>
<b>Figure 2.1: Results study of Cerbeci et al (2019) ... 9 </b>
<b>Figure 2.2: Results study of Ramírez-Corre et al (2018) ... 10 </b>
<b>Figure 2.3: Research results of Sardanelli et al (2019) ... 11 </b>
<b>Figure 2.4: Theory of reasoned action (Fishbein & Ajzen, 1975) ... 14 </b>
<b>Figure 2.5: Theory of planned behavior (Ajzen, 1991) ... 15 </b>
<b>Figure 2.6: Technology acceptance model (Davis, 1989) ... 16 </b>
<b>Figure 2.7: Unified theory of acceptance and use of technology UTAUT </b>
(Venkatesh et al., 2003) ... 17
<b>Figure 2.8: Unified theory of acceptance and use of technology UTAUT2 </b>
(Venkatesh et al., 2012) ... 18
<b>Figure 3.1: Research Model Proposed by Author ... 27</b>
<b>Figure 4.1: Age group of respondences ... 27</b>
<b>Figure 4.2: Descriptive data of current users ... 37 </b>
</div>
<span class='text_page_counter'>(9)</span><div class='page_container' data-page=9>
iii
<b>LIST OF ABBREVIATION </b>
OTT
Over-the-top
SVOD
Subscription Video on demand
TAM
Technology Acceptance Model
TPB
Theory of Planned Behavior
TRA
Theory of Reasoned Action
UTAUT
Unified Theory of acceptance and use
of technology
UTAUT2
Extended Unified Theory of
acceptance and use of technology
</div>
<span class='text_page_counter'>(10)</span><div class='page_container' data-page=10>
1
<b>CHAPTER 1: INTRODUCTION</b>
<b>1.1 Research Background </b>
Today, thanks to the advancement of technology, people have changed the way
they consume media (Shim & Kim, 2018). The development of Broadband Internet
paved the way for the multimedia industry to shift from traditional Cable TV to
OTT Streaming (Over-the-top Streaming). OTT is superior to the traditional Cable
TV because of 2 characteristics: mobility and internet (Kim et al., 2016). Thus, OTT
streaming has become the technology preferred by consumers to entertain (Shim et
al., 2018). OTT streaming is well-known for its service called Subscription video on
demand (SVOD).
During 2010, the SVOD market was still in the early stage, with the domination
of Netflix. However, in 2019, there were a lot of big players joining the SVOD
industry, such as Apple, Disney, and WarnerMedia, which pave a new era for the
SVOD market known as the name “Streaming Wars” (Ben, 2019). The predict of
Pwc Global Entertainment and Media Outlook report showed that the size of this
market will be doubling up to $72.8 billion. Other results showed that in 2018,
traditional cable TV firms had less than 3 million users, while SVOD services
revenue increased from 30 billion USD by 2016 to 68 billion USD by 2018 (Yen,
2019).
</div>
<span class='text_page_counter'>(11)</span><div class='page_container' data-page=11>
2
level, there still positive evidence showing that this industry has the potential to
grow in Vietnam. By the analysis of Statista.com in 7/2019, there are more than
54% of Vietnamese frequently using the Internet, and these people will increase by
38% in 2023. Also, another figure showed that Vietnam users spend 6-7 hours each
day using the Internet, mainly for entertaining (Statista, 2020). In Vietnam, there are
36 SVOD firms. The foreign firms in this industry are Netflix, Apple TV,.. and the
most famous Vietnamese firms in this industry are ClipTV, FPT play. VTVcab ON,
VTC Now, My K+ NOW,… .The revenue growth of the SVOD industry in
Vietnam is predicted by up to 113% by 2023 (Statista, 2020). Many foreign SVOD
companies are interested in this market. For example, the leader of Netflix – one of
the big firms in the SVOD industry had a meeting with the Head of the Government
Office to make an agreement about entering Vietnam in November 2019 officially
(Luu, 2019). This evidence shows that Vietnam is a potential as well as high
competition for exploit such online entertainment services like SVOD.
For an industry that started to grow like SVOD in Vietnam, since the number of
SVOD users in Vietnam was still limited, the finding of consumer insight and user’s
psychology in subscription intention to SVOD is necessary.
</div>
<span class='text_page_counter'>(12)</span><div class='page_container' data-page=12>
3
subscription intention of movie streaming service by using TPB as a based model
(Sardanelli et al., 2019). Although studies about SVOD investigated the
subscription intention from different angles, there still theoretical gaps that needs to
be filled. First, to the best of the author’s knowledge, most studies were looking at
one company (in this case, Netflix) rather than identify factors affecting behavior
intention for a whole industry like SVOD, especially in Vietnam. Second, there is a
lack of research applied UTAUT2 to the domain-specific case like SVOD industries.
Finally, previous studies were focusing on piracy, technology, finance factors.
There was a lack of factors related to mass media as well as factors related to
consumer’s traits to the behavioral intention of SVOD users.
About UTUAT2, this model was the latest one in technology adoption.
Venkatesh et al. (2012) mentioned adding moderator as the way to expand the
theory of UTAUT2. Following Vankatesh’s suggestion, many tried to test the role
of Age, Gender, Personalization,… as a moderator to UTAUT2. But to the best of
the author, there is no research added Media Exposure to UTAUT2 as a moderator.
There is reason to prove that Media Exposure can have a moderating effect. The
fact that consumers made their decision based on the information they gained. The
amount of information from media exposure can affect the cognitive function of a
person (Christakis et al. 2018). According to DeFleur, Melvin, and Everett Dennis
(1998), enough frequency of media exposure could change one person’s behavior
and belief. Because of that, Media Exposure can be treated as a moderator. The
thesis will test the role of Media Exposure whether it has a moderating effect on the
UTAUT2 construct.
</div>
<span class='text_page_counter'>(13)</span><div class='page_container' data-page=13>
4
<b>1.2 Research Objective </b>
There is a lack of research applied UTAUT2 to understand consumer’s intention
to subscribe to SVOD. Therefore, this thesis will test UTAUT2 in the SVOD
context as empirical evidence contributes to the SVOD studies.
The thesis also tests the role of Consumer Innovativeness and moderating effect
of Media exposure to the UTAUT2 model to expand the approach of Media
exposure as moderators and contribute to the theory of UTAUT2.
<b>1.3 Research Question </b>
Based on the research motivation, both theoretical and practical, this study
answers the following question:
1. What are the factors that significantly influence users’ adoption of Subscription
video on demand in Vietnam?
2. Can Media Exposure moderate the relationship between the independent variable
and subscription intention of SVOD in Vietnam?
<b>1.4 Research Subjective and Research Scope </b>
<i><b>- Research Subjective </b></i>
The subject of the research will be “Factors affecting intention to subscribe to
SVOD of Vietnamese people who already have acknowledged about this service”.
<i><b>- Research Scope </b></i>
The scope of thisxstudyxwillmainly in Hanoi because they have a huge amount
of people in general and have already aware of SVOD service. This study will have
a time range from 2019 to 2020.
<b>1.5.Research Contribution </b>
</div>
<span class='text_page_counter'>(14)</span><div class='page_container' data-page=14>
5
The thesis applied UTUAT2 since there is no literature of SVOD applied
UTAUT2 in the SVOD context, especially in Vietnam there has no study related to
subscription video on demand.
The study also confirmed the previous finding of Consumer Innovativeness on
intention behavior in SVOD context.
The study also found the Moderating effect of Mediaxexposurexon
thexrelationshipbetween Hedonic Motivation and Intention Behaviors. The finding
contributed to the UTAUT2 theory because this is the early study that investigates
the moderating role of media exposure to UTAUT2.
<i><b>- Practical contribution </b></i>
</div>
<span class='text_page_counter'>(15)</span><div class='page_container' data-page=15>
6
<b>CHAPTER </b>
<b>2: </b>
<b>LITERATURE </b>
<b>REVIEW </b>
<b>AND </b>
<b>HYPOTHESIS </b>
<b>DEVELOPMENT </b>
<b>2.1 Review of related definition and previous research </b>
<i><b>2.1.1 Definition of OTT platform </b></i>
According to the Ministry of Information and Communication of Vietnam
(MIC, 2019), Over-the-top (OTT) platform is the media service that uses the
internet to transfer content and added values to consumers. OTT platform provides
content directly to the Internet rather than provides under the management of any
Internet Service Provider. Thus, it paves a way for OTT platform users to access
content on many different devices. Another feature of OTT is the recommendation
system that supports users to find content that they needed easily.
There are three types of OTT services. The first one is OTT television,
usually called streaming video. The example for this type are
subscriptionxvideoxonxdemand (SVOD) firms such as Netflix, Amazon Prime,
Hulu, … The second types of OTT are OTT messaging/voice calling services. OTT
messaging/voice calling can be defined as an instant messaging/ voice calling
service provided by the third party as an alternative to traditional SMS. The most
well-known brand for these types is WeChat, Skype, Viber, Zalo,... The final types
of OTT platform types are OTT music, known as music streaming. Examples of
these types are Spotify and YouTube Music (Technavio, 2019). This study will only
be focusing on the first types of OTT, which is video streaming.
<i><b>2.1.2 Definition of Streaming </b></i>
</div>
<span class='text_page_counter'>(16)</span><div class='page_container' data-page=16>
7
(Austerberry, 2005). In a television broadcast, content is pushed to the user on a
certain schedule.
With streaming, users can choose content, generally through interaction with
the web provider's service. There are three ways to transmit multimedia content,
listed below:
a. Download
Content can be played by users after they have downloaded from the severs.
The multimedia file received will be stored on computer storage media. After
received the multimedia file successfully on the user’s side, the user can
access the content.
b. Progressive Download
Progressive download is defined as the media that can be played a few
seconds after the download process begins. Progressive download is similar
to streaming, but the media in this type still through the process of
downloading, or other terms called pseudo streaming.
c. Streaming
The media can be played directly without going through the download
process. Through this transmission process, parts of the media are received
on the user’s side can be played immediately.
Based on the above definition, it can be concluded that streaming is a method of
transferring content to the user via the web in real-time and can be watched without
having to wait for downloaded.
<i><b>2.1.3 Definition of Video on demand (VOD) </b></i>
</div>
<span class='text_page_counter'>(17)</span><div class='page_container' data-page=17>
8
Until now, there are many videos on-demand services on the internet which
provide free video content such as Youtube, Vimeo, Dailymotion, and others. Users
of the service can enjoy content videos that have been uploaded by creators from
various fields, such as food, beauty, automotive, music, film, technology, and so on.
Based on the above definition, it can be concluded that the video on demand
is a system for watching video shows in a manner interactive where users can freely
choose the content and be able to control the content.
<i><b>2.1.4 Definition of Subscription Video on demand (SVOD) </b></i>
Subscriptionxvideoxonxdemand (SVOD) is defined as a service where users
are charged a subcription fee (generally per month) to be able to choose and enjoy
content freely provided by the SVOD service providers at any time and anywhere as
long as users are connected to the internet (Wayne, 2018). By using OTT
technology, SVOD services can have the ability to help users search for
entertainment content easily with the help of a recommendation system using A.I
and Big Data (Xavier, 2013).
SVOD is also defined as an online entertainment service where users are
charged monthly to access to a streaming library consisting of films, television
shows and other media content (Stastista, 2019a)
In the world such as Netflix, ESPN+, Hulu, and Vietnam such as FPT Play,
K+ Now, Clip TV are some examples of SVOD technology. The number of SVOD
users in the whole world is going up rapidly from around 283 million users a year
by 2018 to 411 million users by 2022. The younger generation is the one who
spends most of the time using SVOD, with users aged 18-24 years spend an average
ofx39 minutesper dayusing SVOD services (Stastista, 2019a)
</div>
<span class='text_page_counter'>(18)</span><div class='page_container' data-page=18>
9
the remarkable features of OTT in general as well as SVOD comes from a
recommendation system that helps users find their entertainment content faster.
<i><b>2.1.5 Related research & research gap </b></i>
<b>Related Research </b>
Recently, there are a few authors have mentioned about subscription
intention of SVOD. The detail of each research is mention at the following:
Cebeci et al. (2019) were one of the pioneer studies in SVOD with the topic
“Understanding the Intention to Use Netflix: An Extended Technology Acceptance
Model Approach”. UsedxTAMxasxa based theoretical framework on Istanbul
context, the study found out Attitude had a direct effect on the intention to use,
Perceived Usefulness influenced attitudes, support by the moderating effect of
technology anxiety, Knowledge affected both PerceivexEasexofxUse
andxPerceivedxUsefulness, Self-efficacy had a positive effect on
PerceivedxEasexofxUse.
<b>Figure 2.1: Results study of Cerbeci et al (2019) </b>
</div>
<span class='text_page_counter'>(19)</span><div class='page_container' data-page=19>
10
Another scholar - Ramírez-Corre with his partners (2018) conducted a topic
name “The acceptance of Netflix: a study using structural equations” to investigate
customer intention of using Netflix in Brazil. The study followed quantitative
analysis using TAM for the hedonic information system suggest by Heijden (2004).
The result found out that Perceived Usefulness, Perceived Ease of Use, Perceived
Enjoyment have a positive relationship with behavior intention, moderating by
Experiences.
<i><b> Figure 2.2: Results study of Ramírez-Corre et al (2018) </b></i>
The study has confirmed one of the major findings of Heijden (2004),
augured the importance of two factors about the perception of useful and easy to use,
which came from the TAM model. Ramirez mentioned that under the context of the
hedonic information system, the role of Perceived Enjoyment is more important
than the remaining factors. The limitation of the research is that Ramirez-Corre just
only focusing on four factors: PerceivedxUsefulness, Perceived EasexofxUse,
Perceived Enjoyment, and Experience.
</div>
<span class='text_page_counter'>(20)</span><div class='page_container' data-page=20>
11
sample of study still had some limitations while the majority of respondence mostly
from young as 18 to older as 34 age range, which the results tend to represent for
young users.
A qualitative analysis study had been conducted by Dasgupta and Grover
(2019) with the topic “Understanding Adoption Factors Of Over-The-Top Video
Services Among Millennial Consumers in India”. The study found the most
important feature which leads to the adoption of OTT video service is Convenience,
Content, Mobility, Cost. The research did not have a high generalizability level
since it was conducted only in two cities of India. Also, OTT service is a nascent
concept in India, so the finding may not fully understand the insight of consumers
toward OTT video services.
Sardanelli et al (2019) investigated the intention to subscribe to movie
streaming services in Italy from the perspective of illegal downloading using TPB.
The study included variables such as Product Involvement (INV), Subjective Norm
(SN), Frequency of Past Behaviour (FNB), Moral Judgement (MORAL), Perceived
Risk (RISK), Attitude (ATT). The study found out that attitude, frequency of past
behavior, and involvement have an important role in explaining the subscription
intention of movie streaming services.
<b>Figure 2.3: Research results of Sardanelli et al (2019) </b>
</div>
<span class='text_page_counter'>(21)</span><div class='page_container' data-page=21>
12
<b>Research Gap </b>
Overall, in terms of SVOD previous study, some factors had been agreed to
have affected intention to subscribe SVOD or video streaming services such as
Perceived Usefulness, Perceived Enjoyment, Perceived Ease of Use, Experience,
Knowledge, Content, Cost, Mobility, Convenience, Attitude, Moral Judgement,
Perceived Risk, Media Option and Social Trend. However, those factors were only
focusing on technology and finance aspects. There is a lack of concern about factors
in the aspect of media promotion and the factors related to consumer trait to the
intention to subscribe to SVOD. Moreover, to the best of the researcher’s
knowledge, there is no research applied UTUAT2 to the context of SVOD.
Therefore, the following study will add Media Exposure to Advertising
SVOD message as media promotion aspect and Consumer Innovativeness as
consumer trait aspect to have a deep understanding of factors affecting the intention
to subscribe to SVOD.
<b>Media exposure to SVOD advertisement as moderator: </b>
</div>
<span class='text_page_counter'>(22)</span><div class='page_container' data-page=22>
13
value price of the services. Or in another word, media exposure to SVOD
advertising can strengthenxthexrelationship between the dependent variables and
behavioral intention in UTAUT2.
In academic aspects, Media exposure had been tested in many different
approaches. A. Qader (2011) proved that media exposure can have a direct impact
on behavioral intention. Other scholars also had the same results (Lee, Koo, &
Chung, 2019; Khofanda & Fajarindra Belgiawan, 2018). Some scholars found the
media exposure can have a direct impact on human perception (Li X., 2018; Wang,
Guo, & Shen, 2011). Media exposure in some case can help to influent brand-recall
and purchasing intention (Turley & Shannon, 2000; Sohail & Sana, 2011;
Muhammad & Tanveer, 2015) as well as can be initial preparation for the stage of
the consumer’s decision-making process (Burton et al, 2019). However, recently,
there is a lack of study that tested the moderating role of Media Exposure to the
relationship between human perception and behavioral intention, although some
researchers have suggested this approach. Reynaldo A.Baustista Jr (2017) in the
research of the generic drug, suggested the role of media exposure in strengthening
the relationship between TPB construct and behavioral intention. Another study also
suggested about moderating role of Media Exposure, in this case, Media Exposure
can strengthen the relationship between buying attitude and perception of value (Jan,
Ji, & Yeo, 2019). Therefore, it is a good opportunity to test whether media exposure
can strengthen the relationship between UTAUT2 constructs and behavioral
intention.
<b>Consumer Innovativeness as additional variables related to consumer’s trait. </b>
</div>
<span class='text_page_counter'>(23)</span><div class='page_container' data-page=23>
14
explored by previous researchers, some of them were still not been explored
carefully. One of them was Consumer Innovative which proposed by Roger (1983)
in his book called “Diffusion of Innovation”. Some scholars in the domain of
marketing also mentioned this factor (Migley & Downling, 1978; Agarwal &
Prasad, 1988; Flynn & Goldsmith, 1993). Consumer Innovative was defined as “the
willingness of an individual to try out any new information technology.” (Agarwal
& Prasad, 1988). In other words, a person who has open-minded to newness has a
high possibility to accept a technology faster than others as well as more likely to
influent others to adopt new technology (Roger, 1983).
On many studies about Consumer Innovativeness, there had been
inconsistent in the results of Consumer Innovativeness to Intention Behaviour.
Some studies proved there was a relationship between these 2 variables (Goldsmith,
2000; Ho & Wu, 2011; Foxall & Bhate, 1991; Paswan & Hirunyawipada, 2006).
However, some showed no relationship between them (Im et al., 2003; Chao et al.,
2012). Therefore, this study will investigate to what extent Consumer
Innovativeness impact Behaviour Intention in the context of SVOD in Vietnam.
<b>2.2 Review of the relevant theoretical model of technology adoption: </b>
<i><b>2.2.1 Theory of reasoned action (TRA) </b></i>
This theory explains the behavioral intention byxattitudextowardxbehavior
and subjective norm. The attitudes toward behavior is “the positive or negative of
an individual toward conducting a behavior to the subject” (Fishbein & Ajzen,
1975), and the subjective norm was defined as the feeling of others when we
conducting a behavior.
</div>
<span class='text_page_counter'>(24)</span><div class='page_container' data-page=24>
15
The limitation of the Theory of Reason behaviors (TRA) is that this model
assumes a person’s cognitive decided his/her behaviors. Therefore, the theory of
Ajzen cannot explain consumer behaviors if an individual behaves based on his/her
habit or behaves unconsciously. Moreover, Ajzen just considered the relationship
between attitudes and behaviors of an individual itself rather than concerning the
social factors. In the reality, in some cases, social factors do have affect intention
behavior of an individual (Shiau et al., 2012; Rieke et al., 2016)
<i><b>2.2.2 Theory of planned behavior (TPB) </b></i>
The theory of plannedxbehavior is an expansion of TRA to enhance the
ability to explain behavior which not under control (Ajzen, 1991). The added
determinant in TRA is Perceived Behavioral Control.
<b>Figure 2.5: Theory of planned behavior (Ajzen, 1991) </b>
According to Aizen (1991): “The Perceived Behavioral control can trigger from
each person’s internal (Ability, Determination...) or external (Time, chance,…)”.
TPB model was considered as more complete than TRA in explaining consumer
behavior.
<i><b>2.2.3 Technology acceptance model (TAM) </b></i>
In the studies about technology adoption, some scholars have emphasized the
relationshipxbetweenxattitudexandxintention behavior. Davis (1989) developed TAM
</div>
<span class='text_page_counter'>(25)</span><div class='page_container' data-page=25>
16
behavior. TAM was adapted and developed based on the theoretical background of
TRA in constructing relationships among factors to explain human behaviors to
accept and use an Information System (Davis, 1989).
<b>Figure 2.6: Technology acceptance model (Davis, 1989) </b>
TAM explained usersxacceptance through 2 determinants, which were (1)
Perceived Usefulness and (2) Perceived ease of Use. In addition, in TAM, the
perception of a person who using Information technology can be influenced by
environmental factors such as experiences, knowledge, training level, and IT
process. Different from TRA, this theory emphasized the role of the self-making
decision of consumers during the time they consume products.
<i><b>2.2.4 Unified theory of acceptance and use of technology (UTAUT) </b></i>
To unify all factors relating to the adoption of technology in the field of
information system, UTAUT was proposed. The intention behaviors can be
explained by 4 key elements in this theory.
</div>
<span class='text_page_counter'>(26)</span><div class='page_container' data-page=26>
17
<b>Figure 2.7: Unified theory of acceptance and use of technology UTAUT </b>
<b>(Venkatesh et al., 2003) </b>
UTAUT was used in many studies. There are three kinds of UTAUT
application has been made by scholars. First, some scholars applied UTAUT in
contemporary contexts such as the Internet of Things (IoT) (Sung & Jo, 2018),
Mobile Banking (Yu, 2012). Second, some scholars applied Modified UTAUT2
which added other constructs such as culture (Sriwindono & Yahya, 2012), Risk
(Eneizan et al., 2019). Third, some studies integrated UTAUT with other models
such as Task Technology Fit (TTF) (Zhou et al., 2010). Many studies of UTAUT
showed that different contexts will bring different results. According to Venkatesh
et al (2003) suggestion, there could be another construct that can be added to the
model.
</div>
<span class='text_page_counter'>(27)</span><div class='page_container' data-page=27>
18
UTAUT2 has applied the previous construct with 3 new constructs added:
HedonicxMotivation, Price Valuexand Habit.
<i><b>Figure 2.8: Unified theory of acceptance and use of technology UTAUT2 </b></i>
<i><b>(Venkatesh et al., 2012) </b></i>
<i><b>2.2.5 Reason why the author choosing UTUAT2 as theoretical framework </b></i>
In the past, many previous studies applied TAM, TPB, … in explaining
human behavior. Each model has its strength and limitation, the next model tends to
enhance or explained the previous model. As Venkatesh concluded, the UTAUT2 is
the model that inherited almost all of the elements of the previous models (TPB,
TRA, TAM, UTAUT). Therefore, to explain individual consumers' intention to
subscribe to SVOD, UTAUT2 is suitable for this research.
<b>2.3 Hypothesis development and conceptual model </b>
The researchxmodel applies six constructs of UTAUT2. Moreover, because
</div>
<span class='text_page_counter'>(28)</span><div class='page_container' data-page=28>
19
<b>Table 2.1: Construct's definition </b>
<b>Construct </b> <b>Definition </b>
Performance expectancy The degree to which using technology will provide
benefits to consumers in performingxcertainxactivities
(Venkatesh et al., 2012)
Effort Expectancy How easy the users can interact with SVOD
(Venkatesh et al., 2012)
Social Influences The extent to which user of SVOD services consider
their behavior associatedxwith otherxpeople’sxbelief
(Venkatesh et al., 2012)
Facilitating condition The extent to which SVOD users believe that with the
availability of stable internet connection and devices
can support using SVOD services (Venkatesh et al.,
2012)
Hedonic Motivation The fun or pleasure derived from using SVOD
(Venkatesh et al., 2012)
Price Value The trade-offxbetween the cost paid for using the
technology and the perceived benefits received
(Venkatesh et al., 2012)
Consumer Innovativeness The tendency of a consumer to buy a new product and
enjoy the uniqueness of the product (Steenkamp et al.,
1999)
Media Exposure Media coverage on SVOD advertising (Reynaldo A.
Bautisca, Jr. et al, 2017)
<i><b>2.3.1. Performance Expectancy </b></i>
</div>
<span class='text_page_counter'>(29)</span><div class='page_container' data-page=29>
20
using technology will provide benefits to consumers in performing certain activities”
(Venkatesh, 2012). Since one of the remarkable features of SVOD and the OTT
platform is film recommendation feature and personalization feature, SVOD can
help users searching movies that they want more quickly compared with previous
media technology.
In previous researches, almost all scholars found a positive relationship
between performance expectancy and behavioral intention. For example, Van der
Heijden (2003) stated that Perceived Usefulness (which similar meaning with
Performance Expectancy) has a positive impact on Information systems which
focuses on entertainment purposes. Performance Expectancy also proved to have a
positive impact on behavioral intention in several studies (Baabdullah, 2018; Cebeci
et al., 2019; Yu & Ting, 2011).
Thus, this research hypothesizes that:
<i>H1: PerformancexExpectancy will have a positive impact on intention to subscribe </i>
<i>to SVOD in Vietnam. </i>
<i><b>2.3.2. Effort Expectancy </b></i>
In UTAUT2, effort expectancy was<i>x</i>defined<i>x</i>asxhow<i>x</i>easy the users can
operate the system. Davis (1989) foundxthatxanxinformation system which people
think it easier to use is more likely to be adopted. There are many scholars agreed
that effort expectancy can explain the user’s intention. Bautista et al. (2016)
concluded that user’s intention to use social TV system had a high correlation with
how they think that system is easy or not. Lee (2018) also agreed that there is an
impact of online streaming adoption and effort expectancy.
Because of that, it is crucial to examine the role of effort expectancy in the
context of SVOD in Vietnam.
</div>
<span class='text_page_counter'>(30)</span><div class='page_container' data-page=30>
21
<i><b>2.3.3. Social Influences </b></i>
Social influence is the degree to which an individual is influenced by the
recommendation of other people (Diaz & Loraas, 2010). It is similar to the factor
“subjective norm” defined in TPB by Aijzen (1991)
As in the context of Vietnam, people have a close relationship, and they tend
to live in a closed group society. Therefore, the impact of family and friends can be
considered as important factors to evoke potential users to have curious about
services as well as accept the services.
Social influence has been proved to be significant in many different media
and entertainment contexts. The influence of users’ closest peers will associate with
the intention to use music streaming (Dörr et al., 2013). Leong et al (2013) found
the recommendation of the user’s peer has a positive impact on intention to use
mobile entertainment in Malaysia.
Thus:
<i>H3: Social Influences will have a positive impact on intention to subscribe to SVOD </i>
<i>in Vietnam. </i>
<i><b>2.3.4. Hedonic Motivation </b></i>
Hedonic motivation is defined as “the fun or pleasure derived from using a
technology”, and it hadxbeenxshownxtoxplayxanximportant role in determining
technology acceptance and use behavior (Brown & Venkatesh, 2005). In studies of
information system, results showed that a technology that derives fun and pleasure
to a person will be likely to be accepted (Van der Heijden 2004; Thong et al. 2006).
This statement was also proved in consumer contexts (Brown and Venkatesh 2005;
Childers et al., 2001).
</div>
<span class='text_page_counter'>(31)</span><div class='page_container' data-page=31>
22
the SVOD services are attractive enough, they may tend to adopt SVOD. Wong
(2014), in the case of mobile-TV, hedonic motivation is one of the most important
factors in choosing mobile-TV. In the hedonic information system context, the role
of Hedonic Information also proved to have an impact on the intention to use a
hedonic information system (Heijden, 2004). Based on this review, the author stated
that:
<i>H4: Hedonic Motivation will have a positive impact on intention to subscribe to </i>
<i>SVOD in Vietnam. </i>
<i><b>2.3.5. Price Value </b></i>
An important difference between thexconsumerxusexsetting and the
organizational use setting, when UTAUT2 was developed, is the role of price to the
users’ behavior. The cost and pricing structure may have a significant impact on
consumers’ technology use. Price Value is defined as “thextrade-off between the
cost paid for using thextechnology and the perceived benefits received” (Dodds et
al., 1991). As by Venkatesh et al. (2003), an important difference between the
consumer setting and the organizational setting is that the consumers need to
concern about the cost use while employees do not. The relationship between price
value and subscription intention will be positive if users think that the value of
technology is greaterxthanxthexcostxtheyxhave to pay.
Price value had been proved to have a positive impact on intention to adopt a
technology. For example, Prata, Moraes and Quaresma (2012) found that person
who tends to think the application has a reasonable price will tend to have a high
purchasing intention of mobile application.
</div>
<span class='text_page_counter'>(32)</span><div class='page_container' data-page=32>
23
high in comparison with the average income of users, it will be a huge barrier for
users to access SVOD. Thus:
<i>H5: Price Value</i>x<i>will</i>x<i>have a positive</i>x<i>impact</i>x<i>on intention to subscribe to SVOD in </i>
<i>Vietnam. </i>
<i><b>2.3.6. Facilitating condition </b></i>
Venkatesh et al. (2003) demonstrated this term as “the beliefs of a person on
the availability of the infrastructure when using technology”. In the context of
SVOD, the term facilitating condition is considered as the extent to which SVOD
users believe that the availability of stable internet connection and devices that can
be accessed to the internet can support them using SVOD services.
The facilitating condition was proved to have a positive impactto behavioral
intention in the study of Internet banking (Emad & Michael, 2009). Support for the
hypothesis is Wong et al. (2014) in the study on the behavioral intention of
mobile-TV.
Thus, the study will follow the hypothesis:
<i>H5: Facilitating Condition will have a positive impact on intention to subscribe to </i>
<i>SVOD in Vietnam </i>
<i><b>2.3.7. Consumer Innovativeness </b></i>
Consumer Innovative (CI) is a factor that will be tested in the context of
SVOD in Vietnam. Consumer innovativeness refers to “the degree to which the
individual willing to try out new ideas” (Midgley and Dowling, 1978). Based on
Dabholkar and Bagozzi (2002), personal innovativeness can change individuals’
perceptions of technology. The more innovative a person is, the more he/she will
want to use new technology.
</div>
<span class='text_page_counter'>(33)</span><div class='page_container' data-page=33>
24
Edumall and Sport channels, Netflix provided an option for consumers to download
the movie on the computer. The variety of services may bring curious to the
Vietnamese users, especially the one who has consumer innovativeness. Therefore,
consumer innovativeness can be a potential factor to explain the intention to
subscribe to SVOD in Vietnam.
In previous research, some scholar has developed and applied to support the
influence of the user’s innovativeness in a different context related to different kind
of technology from purchasing online behavior (Donthu & García, 1999; Goldsmith,
2000), Mobile App Adoption (Sari et al., 2019; Okumus, 2018). Internet of Things
(Sung & Jo, 2018). Subscription Based-Online Service (Ramkumar & Woo, 2018)
With the evidence from the literature, consistent with the fact that SVOD is
an Innovation in Media (Christensen et al., 2015), the author expects that the
subscription intention of SVOD is positively influenced by Consumer
Innovativeness.
<i>H7: Consumer Innovativeness will have a positive impact on intention to subscribe </i>
<i>to SVOD in Vietnam </i>
<i><b>2.3.8. Media exposure </b></i>
In many years, media exposure had shown its important role in changing the
way people think and behave on new services/products. Some scholars showed
media exposure had a direct effect not only on human perception but also on
behavioral intention. Media exposure in this thesis is defined as media coverage for
SVOD advertising. Since a lot of scholars has found media exposure can have a
direct effect to consumer’s perception (Li X., 2018; Wang, Guo, & Shen, 2011) and
direct effect to consumer intention (Lwin et al., 2014; A- Qader & Zainuddin, 2011),
it is possible that media exposure may have a moderating effect between UTAUT2
constructs and consumer intention to subscribe to SVOD as many constructs of
UTAUT2 related to the perception of a person. It is likelyxthat thexmore a person is
</div>
<span class='text_page_counter'>(34)</span><div class='page_container' data-page=34>
25
toward SVOD, and that change in perception can lead to subscribe intention. Or in
other words, the expectation of performance, easy to use, price value, hedonic, and
facilitating condition will be strengthened under the effect of media exposure.
Hence,
<i>H8: The greater the media exposure to SVOD advertisement, the effect of </i>
<i>performance expectancy on the subscription intention will be reinforced </i>
<i>H9: The greater the media exposure to SVOD advertisement, the effect of effort </i>
<i>expectancy on the subscription intention will be reinforced </i>
<i>H10: The greater the media exposure to SVOD advertisement, the effect of social </i>
<i>influence on the subscription intention will be reinforced </i>
<i>H11: The greater media exposure to SVOD advertisement, the effect of facilitating </i>
<i>conditions on the subscription intention will be reinforced. </i>
<i>H12: The greater media exposure to SVOD advertisement, the effect of hedonic </i>
<i>motivation on the subscription intention will be reinforced. </i>
<i>H13: The greater media exposure to SVOD advertisement, the effect of price value </i>
<i>on the subscription intention will be reinforced. </i>
In the study on diffusion of innovation, Consumer Innovativeness was
widely accepted as the factor affecting the intention to adopt a new product.
However, understand what factors can accelerate the speed rate of adoption among
these types of consumers can help better to expand the knowledge of diffusion
(Roger, 1983). Robertson (1967) claimed that there could be variables that can
switch the rate of adoption. In the field of diffusion research, Media exposure had
been agreed as an importantxdriverxofxinnovation diffusion and has a significant
</div>
<span class='text_page_counter'>(35)</span><div class='page_container' data-page=35>
26
with consumer innovative trait tend to actively seek for new information and idea
about the product, thus make them easier to be early adopters (Migley & Downling,
1978). Therefore, when these two requirements (the information push of media and
information gained when users actively seeking) are met, an innovative person will
have a large amount of information compared to non-innovative persons, thus
accelerating the adoption speed rate of SVOD product. In another word, the study
proposed a hypothesis:
</div>
<span class='text_page_counter'>(36)</span><div class='page_container' data-page=36>
27
<b>2.4 Research conceptual model </b>
The following model is the research model of the thesis proposed by the author:
<b>Figure 2.9: Research Model Proposed by Author </b>
H12
H8 H9 H10 H11 H13 H14
Media Exposure
PerformancexExpectancy
EffortxExpectancy
Social Influences
Facilitating Condition
HedonicxMotivation
PricexValue
Consumer Innovativeness
Subscription Intention
H1
H2
H3
H4
</div>
<span class='text_page_counter'>(37)</span><div class='page_container' data-page=37>
28
<b>CHAPTER 3: METHODOLOGY </b>
<b>3.1. Research process </b>
The study will follow the steps shown in the figure below:
<b>Figure 3.1: Research process proposed by author </b>
Review previous study to
finalize research objective
Identifyxresearch
objective, research
scope, research model
and methodology
Identifyxresearch
population, sample and
scale and measurement
Develop questionnaire
basedxonxpreviousxstudy
Plot test questionnaire
Data collection
Analyze and interpret
the results with SPSS
</div>
<span class='text_page_counter'>(38)</span><div class='page_container' data-page=38>
29
<b>3.2. Sampling and data collection </b>
<i><b>Sample size </b></i>
The minimum amount of sample required for research is equal to the number of
observable items in the questionnaire multiple by 5 (Hair et al., 2013). This study
will follow this formula for deciding the sample size.
This study has 30 construct items, which means the total sample size is 30 * 5 = 150
in minimum.
<b>3.3. Sample Population </b>
The survey questionnaire has been sent in Google From Online and delivered to
people who acknowledged SVOD services and are user’s SVOD services to give a
better sample to the research objective. To make sure that requirement is met, a
majority of the sample came from the author’s network on Facebook as well as the
questionnaire was delivered to some Movie/ TV show/ Live sport Hobby Group to
make sure it matched with the potential users. Also, the term of SVOD was
explained carefully in the questionnaire. The survey was conducted from 25th March
to 15th April. The author has collected 250 surveys, 38 answers had been eliminated
from data analysis due to 15 respondents answering the same answer, and 23
respondents not aware of SVOD. In another word, there are 212 responses were
valid to process in data analysis.
<b>3.4. Variable and Measuring Instrument </b>
The measures of this research were applied from the previous study and modified to
be suitable for the research object: Subscription Video-on-demand. In which the
questionnaire was based on the UTAUT2 model (Venkatesh et al., 2012). The
questionnaire will follow Likert 5-point scale.
</div>
<span class='text_page_counter'>(39)</span><div class='page_container' data-page=39>
30
new information technology, I would look for ways to experiment with it” The
questionnaire will follow Likert 5-point scale.
Another construct added name “Media exposure to Advertisement for SVOD” was
adopted by Stroup and Brandstetter (2018). There are 3 items included in this study,
for example: “During the past 30 days when you watch TV, how often do you see
an advertisement for SVOD?”. The questionnaire will follow verbal frequency
5-point scale, ranging from 1 = “Never”, 2 = “Rarely”, 3 = “Sometime”, 4 =
“Frequently”, 5 = “Very Frequently” respectively.
The final construct Behavioural intention is adopted by Venkatesh et al. (2003). The
questionnaire will follow Likert 5-point scale.The pilot test had been conducted
with 20 people who already had a certain knowledge of SVOD and users of SVOD
to check the questionnaire in Vietnamese was confusing or not. After the pilot test,
some items were removed due to the participant’s feedback on confusion meaning.
The final observation elements are presents as follows:
<b>Table 3.1: Measurement Scale of thesis </b>
<b>Factor </b> <b>Code </b> <b>Item </b> <b>Source </b>
Performance
Expectancy
PE1 1. I expect using SVOD improves my
productivity in searching film/TV show.
Venkatesh
et al. (2012)
PE2 2. I expect using SVOD help me searched
film/TV show quickly.
PE3 3. I expect that I can save time using SVOD
service when searching for film/TV
show.
PE4 4. I expect that SVOD service is very useful
to my life in general.
Effort EE1 1. Learningxhowxto use SVOD is easy for
me.
</div>
<span class='text_page_counter'>(40)</span><div class='page_container' data-page=40>
31
Expectancy EE2 2. I find SVOD easyxtoxuse. et al. (2012)
Davis
(1989)
EE3 3. Itxisxeasyxforxmextoxbecomexskillfulxat
using SVOD
EE4 4. My Interaction with SVOD is clear and
understandable
Social
Influence
SI1 1. Peoplexwhoxare importantxtoxmexthink
thatxIxshouldxusexSVOD.
Venkatesh
et al. (2012)
SI2 2. People whoxinfluence my behavior think
that I should use SVOD.
SI3 3. People whosexopinions that I value prefer
that I use SVOD.
Hedonic
Motivation
HM1 1. UsingxSVODxisxfun. Venkatesh
et al. (2012)
HM2 2. UsingxSVODxisxenjoyable.
HM3 3. UsingxSVODxisxveryxentertaining.
Price Value PV1 1. SVOD is reasonably priced. Venkatesh
et al. (2012)
PV2 2. SVOD is a good value for money.
PV3 3. At the current price, SVOD provide a
good value
Facilitating
condition
FC1 1. I have enough resourced to use SVOD
(Internet/ smart TV / card credit / online
payment method)
Venkatesh
et al. (2012)
FC2 2. I have enough knowledge to use SVOD
FC3 3. SVOD compatible with other technology
I used (Smartphone/ Smart TV / laptop)
FC4 4. I can get help from other if I’m having
</div>
<span class='text_page_counter'>(41)</span><div class='page_container' data-page=41>
32
Consumer
Innovativeness
CI1 1. If I heardxaboutxaxnewxinformation
technology, Ixwould look for ways to
experiment with it
Agarwal &
Prasad
(1988).
CI2 2. Amongxmyxpeers, xIxamxusuallyxthe first
to try out new information technology
CI3 3. In general, I like to try out new
information technology
Media
exposure to
SVOD
advertisement.
ME1 1. During thexpast 30 days when you watch
TV, howxoftenxdoxyouxsee advertisement
for SVOD?
Stroup &
Brandstetter,
(2018)
ME2 2. During thexpast 30 days, how often do
you see advertisement for SVOD in the
e-newspapers or e-magazines?
ME3 3. Duringxthexpastx30xdays,whenxyou
accessxtoxthe social media, how often do
you see advertisement for SVOD?
Behavioral
Intention
BI1 1. I intend to subscribe SVOD in future Venkatesh
et al (2003)
BI2 2. I predict I would subscribe to SVOD in
future.
BI3 3. I plan to subscribe to SVOD in future.
<b>3.5. Analysis Method </b>
<i><b>3.5.1 Descriptive analysis </b></i>
</div>
<span class='text_page_counter'>(42)</span><div class='page_container' data-page=42>
33
<i><b>3.5.2 Inferential analysis </b></i>
The data collected from the survey will be cleaned first. After that, the author will
use SPSS 20 and Process Macro addon developed by Hayes. The detailed
processing data method showed below:
<i>a. Reliability</i>x<i>analysis</i>x<i>by</i>x<i>Cronbach’s</i>x<i>alpha: </i>
Testing Cronbach’s alpha will make sure the scale is reliable or not. It is vital to
determine Cronbach’s alpha in a study that applied Likert question. The best value
of alpha should be more than 0.9 and the value lower than 0.5 can be considered
inappropriate (Geogre & Mallery, 2010).
The ideals item for each construct should be at leastxthree. According to Nunnally
and Bernstein (1994), item-total correlations need to be larger than 0.3 to be
accepted.
<i>b. Exploratory</i>x<i>Factor</i>x<i>Analysis</i>x<i>–</i>x<i>EFA: </i>
EFA is used to shorten a set of many interdependent observation variables into a
smaller set of variables but more meaningful and most of the information content
still remains the information of the initial set of variables, which ensures mutual
interdependence.
In Exploratory Factor Analysis, there are some requirements need to be satisfied:
Factor loading > 0.5 (The larger the value, the closer relationship between
observable item and variables)
KMO value between 0.5 and 1
Bartlett’sxtestxofxsphericity has Sig < 0.05 (The observed items
arexcorrelatedxwith each other in the population)
</div>
<span class='text_page_counter'>(43)</span><div class='page_container' data-page=43>
34
<i>c. Pearson Correlation </i>
The measurement item which meets the evaluation requirement in Cronbach alpha
and EFA willxbextestedxusingxPearsonxCorrelationxanalysis. Pearson. Correlation.
analysiswas conducted between dependent and independent variable to test if there
has multicollinearity between independent variables. The rate of correlation for not
having the multi-collinearity need to be lower than 0.9 (Hair et al., 2013)
<i>d. Regression analysis: </i>
Regression analysis is an analysis method to check the relationship between
dependent variable Y and independent variable X<sub>1</sub>,X<sub>2</sub>,…. The outcome is a
regression equation which has a following the function:
<b>Y = </b> <b><sub> </sub>+ </b> <b><sub> </sub>X1 + </b> <b>X2 + ,……+ </b> <b><sub> </sub>Xn + ε </b>
Where:
- Y = Score for subscription intention behavior for SVOD
- X<sub>1</sub>, X<sub>2 </sub>,… X<sub>n</sub> = Score for the variables of this study’s model
- , , …. = Regression co-efficient of independent variable
- = intercept
- ε = error term
The step of regression analysis is shown below:
- Evaluate the regression equation through R2 and adjusted R2
- Test hypothesis of each constructs’ regression co-efficient.
- Test the hypothesis of normal distribution of residuals: based on the
frequency chart of standardized residuals; see mean value = 0 and standard
deviation = 1.
</div>
<span class='text_page_counter'>(44)</span><div class='page_container' data-page=44>
35
<i>e. Moderation analysis </i>
</div>
<span class='text_page_counter'>(45)</span><div class='page_container' data-page=45>
36
<b>CHAPTER 4: ANALYSIS RESULTS </b>
<b>4.1 . Data Description </b>
The data below represented for descriptive statistics of the candidate participating in
the survey:
Gender: Among 212 respondents, there are 94 males account for 44% of
respondents, 119 females account for 56% of respondents.
<b>Figure 4.1: Age group of respondents (Source calculation from survey data) </b>
Age: According to the age group by Chart 4.1, the largest percentage of the age
group from 25-30 is 55% of the respondents, followed by a group of 18-24 with
40%. The group of 31-40 has the lowest number account for 5%.
Monthly Income: 34 respondents account for 16% have a salary lower than 5
million VND. 47 respondents account for 22% are 5-10 million VND, 123
respondents respondence account for 58% are 11-20 million VND and 8
respondents have a salary higher than 20 million VND, account for 4%
Occupation: 93 respondents (44%) are students, 88 respondents (41%) are office
staff, 4 respondents (4%) are leader/manager and remain 27 respondents answer
other (13%)
<b>18-24 </b>
<b>40% </b>
<b>25-30 </b>
<b>55% </b>
<b>31-40 </b>
<b>5% </b>
<b>Above 40 </b>
<b>0% </b>
<b>Age </b>
</div>
<span class='text_page_counter'>(46)</span><div class='page_container' data-page=46>
37
With the question “Are you currently use SVOD”, there are 59% (126 people) have
not currently users, 86 people are currently users account for 41% of respondents.
<b>Figure 4.2: Descriptive data of current users </b>
For the question “How do you know about SVOD?”, 183 known from friend and
Co-worker, 98 known from family, and 48 known via advertisement.
<b>Figure 4.3: Descriptive data of SVOD references channel </b>
<b>59% </b>
<b>41% </b>
<b>CURRENTS USERS OF SVOD </b>
Not currently user Currently user
86.32%
46.23%
22.64%
0.00%
20.00%
40.00%
60.00%
80.00%
100.00%
Channel
How you know SVOD?
</div>
<span class='text_page_counter'>(47)</span><div class='page_container' data-page=47>
38
<b>4.2 . Reliability analysis </b>
Cronbach’sxalphaxwasxused to test the reliability of scales. The acceptable value of
Cronbachxalpha is higher than 0.7. The corrected total correlation of all Items is
satisfied with value > 0.3. The brief analysis represented as follows:
<b>Table 4.1: Cronbach’s alpha for all variable </b>
<b>Variable </b> <b>Number of items </b> <b>Cronbach alpha’s value </b>
PerformancexExpectancy
(PE)
4 0.908
EffortxExpectancy (EE) 4 0.809
SocialxInfluence (SI) 3 0.868
FacilitatingxCondition (FC) 4 0.749
HedonicxMotivation (HM) 3 0.799
PricexValue (PV) 3 0.903
Consumer Innovativeness
(CI)
3 0.869
Behavioral Intention (BI) 3 0.784
Media Exposure (ME) 3 0.793
<b>4.2. </b> <b>Explanatory Factor Analysis </b>
<i><b>4.3.1 Explanatory Analysis for independent variable </b></i>
The value of 24 observing items has good Eigenvalue (>1). The 7th factor has the
lowest Eigenvalue at 1.301. The KMO value is valid with value = 0.798 between
0.5 and 1, also the significantxofxBartlett’sxTestxofxSphericity is .000 < 0.05. This
result accepts the validity of data in the explanatory analysis.
</div>
<span class='text_page_counter'>(48)</span><div class='page_container' data-page=48>
39
<b>Table 2.2: EFA Results for independent variable </b>
<b>Rotated Component Matrixa</b>
Component
1 2 3 4 5 6 7
PE4 <sub>.879 </sub>
PE2 <sub>.872 </sub>
PE3 <sub>.858 </sub>
PE1 <sub>.822 </sub>
EE3 <sub>.844 </sub>
EE1 <sub>.794 </sub>
EE2 <sub>.754 </sub>
EE4 <sub>.731 </sub>
PV3 <sub>.888 </sub>
PV2 <sub>.854 </sub>
PV1 <sub>.847 </sub>
CI3 <sub>.878 </sub>
CI1 <sub>.867 </sub>
CI2 <sub>.827 </sub>
SI2 <sub>.864 </sub>
SI3 <sub>.859 </sub>
SI1 <sub>.855 </sub>
FC1 <sub>.810 </sub>
FC3 <sub>.780 </sub>
FC4 <sub>.770 </sub>
FC2 <sub>.645 </sub>
HM2 <sub>.821 </sub>
HM1 <sub>.788 </sub>
HM3 <sub>.783 </sub>
</div>
<span class='text_page_counter'>(49)</span><div class='page_container' data-page=49>
40
<i><b>4.3.2 Explanatory Analysis for dependent variable </b></i>
<b>Table 4.3: EFA Results for Dependent Variable </b>
<b>Component Matrixa</b>
Component
1
BI1 .865
BI2 .835
BI3 .808
Behavioral intention scale consists of 3 items, The KMO value is valid with value =
0.694 between 0.5 and 1, also the significantxofxBartlett’sxTestxofxSphericity is .000
< 0.05. This result accepts the validity of data in the explanatory analysis.
Eigenvalue is more than 1 (2.099) with cumulative 69.953% > 50%, explaining
69,953% of behavioral intention.
To sum up, Behavioral intention (BI) scale remain with 3 item BI1, BI2, BI3,
exacted to 1 component – Behavioral intention (BI)
<i><b>4.3.3 Explanatory Analysis for moderation variable </b></i>
<b>Table 4.4: EFA Results for Moderator </b>
<b>Component Matrixa</b>
Component
1
ME3 .852
ME2 .836
ME1 .835
Media exposure scale consists of 3 items, The KMO value is valid with value
= 0.716 between 0.5 and 1, also the significantxofxBartlett’sxTestxofxSphericity
is .000 < 0.05. This result accepts the validity of data in the explanatory analysis.
Eigenvalue is more than 1 (2.186) with cumulative 72.866% > 50%,
explaining 72,866% of behavioral intention.
</div>
<span class='text_page_counter'>(50)</span><div class='page_container' data-page=50>
41
<b>4.3. </b> <b>Regression Analysis </b>
<b>Table 4.5: Results of Pearson Analysis</b>
According to Person Correlation table, Effort Expectancy (EE), Social Influence
(SI), Price Value (PV), Hedonic Motivation (HM), Performance Expectancy (PE),
Consumer Innovativeness (CI) have significant relationship with Behavioral
Intention (BI) since the Pearson Correlation is high (0.268; 0.506; 0.574; 0.469;
0.346; 0.451 respectively) and Sig <0.05. Also, the correlation coefficient between
the independent variables is lower than 0.9, therefore there was no multicollinearity
in the regression model. However, we still need to pay attention to multicollinearity
in the next step.
<b>Table 4.6: Results of regression analysis </b>
<b>Variable </b> <b>Path coefficient </b> <b>Sig (1 tailed) </b> <b>VIF </b>
Effort expectancy 0.63 .110 1.161
Social Influence 0.267 .000 1.217
Price Value 0.305 .000 1.370
Hedonic Motivation 0.174 .001 1.351
Performance Expectancy 0.113 .019 1.273
Consumer Innovativeness 0.183 .0005 1.280
Facilitating condition 0.08 .4355 1.017
</div>
<span class='text_page_counter'>(51)</span><div class='page_container' data-page=51>
42
adjusted R Square = 0.515, which means that 51.5% of the variation of subscription
intention can be explained by the independent variable.
Testing the overall fit of the model by the ANOVA table, the value of sig is .000 <
0.05, therefore, the regression model is suitable with the data set.
All independent variables have VIF <10, which means that there is no
multicollinearity between independent variables.
Table 8 show Facilitating Condition and Effort Expectancy is not having significant
statistics meaning due to the value of significant > 0.05 (FC Sig one-tailed =
0.4355; EE Sig one-tailed = 0.110).
The relationship between dependent and independent variable are shown in the
following
Consumer Innovativeness (CI) (Beta = 0.183 > 0; Sig one-tailed = 0.0005 < 0.05)
hasxsignificant positive relationshipxwithxSubscriptionxIntention
Performance Expectancy (PE) (Beta = 0.113 > 0; Sig one-tailed = 0.019 <0.05)
hasxsignificant positive relationship with Subscription Intention
Social Influence (SI) (Beta = 0.267 > 0; sig one-tailed = 0.000 < 0.05)
hasxsignificant positive xrelationshipxwith Subscription Intention.
Price Value (PV) (Beta = 0.305 > 0; sig one-tailed = 0.000 < 0.05) hasxsignificant
positiverelationshipxwith Subscription Intention
Hedonic Motivation (SI) (Beta = 0.174 > 0; sig one-tailed = 0.001 <0.05)
hasxsignificant positiverelationship with Subscription Intention
<b>4.4. </b> <b>Moderation Analysis </b>
Based on the outcome of regression analysis, the author will test the relationship
between CI and IB, PE and IB, HM and IB, PV and IB, SI and IB because the
remaining has not had any significant to independent variable so there will be no
need for moderation analysis (Hayes, 2018)
</div>
<span class='text_page_counter'>(52)</span><div class='page_container' data-page=52>
43
<b>Table 4.7: Moderation analysis by Hayes </b>
Model
Summary
Coefficient Standard
Error
t-value p-value Conclusion
H8
Performance
Expectancy
(PE)
.2754 .0578 4.7614 .000 Reject
because
p-value
= .751 > .05
Media
Exposure
(ME)
-.0148 .0438 -.3371 .7364
PE*ME .1146 0.641 1.7888 .0751
Model
Summary
Coefficient Standard
Error
t-value p-value Conclusion
H10
Social
Influence
(SI)
.3259 .0388 8.4063 .0000 Reject
because
p-value
= .2158
> .05
Media
Exposure
(ME)
.0897 .0446 2.0097 .0458
SI*ME .0585 .0471 1.2414 .2158
Model
Summary
Coefficient Standard
Error
t-value p-value Conclusion
H12
Hedonic
Motivation
(HM)
.4816 .0630 7.6397 .0000 Accept
because
p-value
= .0482
< .05
Media
Exposure
(ME)
-.0259 .0410 -.6303 .5292
HM*ME .1683 .0847 1.9869 .0482
Model
Summary
Coefficient Standard
Error
t-value p-value Conclusion
H13
Price Value
(PV)
.3054 .0302 10.1172 .0000 Reject
because
p-value
= .2408
> .05
Media
Exposure
(ME)
.0439 .0400 1.0957 .2745
</div>
<span class='text_page_counter'>(53)</span><div class='page_container' data-page=53>
44
Model
Summary
Coefficient Standard
Error
t-value p-value Conclusion
H14
Consumer
Innovativeness
(CI)
.3026 .0417 7.2491 .0000 Reject
because
p-value
= .7489
> .05
Media
Exposure
(ME)
-.0259 .0419 -.6189 .5367
CI*ME .0200 .0624 .3206 .7489
<b>4.5 Hypothesis tested results </b>
The thesis showed that there are five hypotheses are supported to have an impact on
subscription intention, describe as follow:
<b>Hypothesis H<sub>1</sub>: Performance Expectancy</b>xhas a positive impact on intention to
<b>subscribe to SVOD in Vietnam. </b>
The regression result of Performance Expectancy was significant, which means that
hypothesis H<sub>1</sub> is accepted.
<b>Hypothesis H2: Effort</b>xExpectancyxhasxpositiveimpactxon intention to subscribe to
<b>SVOD in Vietnam. </b>
The regression result of Effort Expectancy was insignificant, which means that
hypothesis H2 is rejected.
<b>Hypothesis H<sub>3</sub>: Social Influences has a</b>xpositive impact on intention to subscribe to
<b>SVOD in Vietnam. </b>
The regression result of Social Influence was significant, which means that
hypothesis H<sub>3</sub> is accepted.
<b>Hypothesis H<sub>4</sub>: Facilitating Condition has a positive impact on intention to </b>
<b>subscribe to SVOD in Vietnam. </b>
</div>
<span class='text_page_counter'>(54)</span><div class='page_container' data-page=54>
45
<b>Hypothesis H<sub>5</sub>: Hedonic</b>xMotivation hasxa positive impactxon intention to subscribe
<b>to SVOD in Vietnam. </b>
The regression result of Hedonic Motivation was significant, which means that
hypothesis H5 is accepted.
<b>Hypothesis H6: Price Value has a positive impact on intention to subscribe to </b>
<b>SVOD in Vietnam. </b>
The regression result of Price Value was significant, which means that hypothesis
H<sub>6</sub> is accepted.
<b>Hypothesis H<sub>7</sub>: Consumer Innovative has a positive impact on intention to </b>
<b>subscribe to SVOD in Vietnam. </b>
The regression result of Consumer Innovativeness was significant, which means
that hypothesis H7 is accepted.
</div>
<span class='text_page_counter'>(55)</span><div class='page_container' data-page=55>
46
<b>CHAPTER 5: DISCUSSION AND CONCLUSION </b>
<b>5.1. Finding and Discussion </b>
The thesis based on UTUAT2 proposed by Venkatesh et al. (2012). It also
incorporates consumer innovativeness as an additional variable and Media Exposure
as a moderator to check the role of both variables in the context of SVOD.
With 212 samples, the results of the thesis have verified as well as argued
some factors listed in the following:
First, Price Value have positive impact on intention to subscribe to SVOD.
This result is consistent with other results related to technology adoption
(Munnukka, 2008; Venkatesh et al., 2012). In the research of mobile internet,
Venkatesh mentioned that the concept of cost and benefit usually go along together
in any consumer contexts. The result of the thesis showed that in SVOD industry,
consumers tend to have a high price sensitivity level. This because the consumers
have a lot of free alternative options such as illegal free websites, or some of the
providers of AVOD such as YouTube.
</div>
<span class='text_page_counter'>(56)</span><div class='page_container' data-page=56>
47
providers in Vietnam (FPT Play, ClipTV,.) also spend 2-3% of their revenues to
produce original content. Or in another example of Vietnam SVOD’s firm, My K+
NOW instead of producing original content, they take advantage of licensed many
different sports video/ film as exclusive content of these services.
Social Influences also found to have a positive impact on intention to
subscribe to SVOD. The references from friends and family are important factors
affecting purchase intention in most research (Ajzen, 1991; Venkatesh et al., 2012).
This result was understandable in terms of consumer behavior psychology. Vietnam
is the society that has a higher level of collectivism rather than individualism
according to Hofstede’s cultural dimension theory (Ana et al, 2007). Therefore,
Marketing Word of Mouth still has its role in the context of Vietnam since the voice
from family and friend is an important aspect which can enhance the behavior
intention.
The hypothesis between Consumer Innovative trait and Intention Behavior
also accepted in this study. This supports the results of Goldsmith (2000), Ho & Wu
(2011), Foxall & Bhate (1991), Paswan & Hirunyawipada (2006). Besides, Vietnam
is a country with a young population. The young people usually have a high level of
innovativeness. Currently, with the effort of listening to consumers, the multimedia
industry has changed a lot to satisfy the curiosity of innovative people, from adding
the downloading feature to the personalization feature.
</div>
<span class='text_page_counter'>(57)</span><div class='page_container' data-page=57>
48
Effort expectancy is a factor that does not have an impact on intention to
subscribe to SVOD. This construct was also shown in another research that it did
not have any impact on behavior intention (Singh & Matsui, 2017). This can be
explained because the sample of this study is mainly young people from 18 to 30,
therefore they already have a certain knowledge of using this type of technology,
which leads to the fact that they do not care much about whether the technology has
easy to use or not. In addition, the Facilitating Condition showed no effect on
behavioral intention, some studies had already proved that this construct is not
inconsistent (Dörr et al. 2013, Wagner and Hess 2013). Because the sample mainly
adopted in the urban area (in this case, Hanoi) where the internet facility is good
and each people have at least one device that can be connected to the internet, the
facilitating condition is not a big problem.
Media Exposure was found to have strengthened the
relationshipxbetweenxHedonic Motivationxand Subscription Intention. The results
suggest that the frequency of media exposure will stimulate the perception of
enjoyment of SVOD toward consumers.
</div>
<span class='text_page_counter'>(58)</span><div class='page_container' data-page=58>
49
advertising types of SVOD recently in Vietnam heavily tend to be Emotional, which
focusing on showing SVOD provider’s appealing contents rather than deeply
representing its feature. For instance, some providers (e.g. Netflix) use its
advertising budget to promote its trendy content as an indirect way to attract
consumers to have a positive perception of their SVOD service. Finally, some
features of SVOD (e.g. Recommendation,..) need to be trial used to change the
perception of the potential consumer as advertising cannot express fully its idea to
change consumer’s mind.
<b>Compared with the research of Reynaldo et al (2017) </b>
Recently, studies of the moderating role of Media Exposure is not many.
There is the only research of Reynaldo (2017) tried to investigate whether Media
Exposure can strengthen the relationship between TPB construct and behavioral
intention. The results of the study showed that Media Exposure did not strengthen
the relationship between TPB constructs (Subjective norm, Perceived Behavioural
Control, and Attitudes) and behavioral intention. However, this thesis showed that
Media Exposure can enhance the relationship between Hedonic Motivation and
Behavioural Intention. The difference in results can be explained because of
different contexts. The study of Reynaldo et al (2017) investigated a product
(generic drug), while SVOD is an entertainment service. People may need more
time to trust an advertisement for the generic drug because using that drug can be
risky, since it may affect health. In contrast, using SVOD provided no risk because
it just an entertainment service, so people will easier to trust advertisements for
SVOD service. Another explained for the differences in 2 study could be due to the
difference in culture, demographic and types of respondents, therefore there needs a
further study which applied in a different region to have a clear answer.
<b>The effect of COVID-19 </b>
</div>
<span class='text_page_counter'>(59)</span><div class='page_container' data-page=59>
50
SVOD and enjoy its content at home seems to be an interesting way to entertain at
that time. A recent study of Neilsen showed that in 500 Vietnamese, 60% of
respondents said that they had changed their way of entertain during COVID-19
(Nielsen Corporation, 2020). Note that during social distancing, all movie theatres
(one of the direct competitors of SVOD) had to be closed. Because of that, people
who usually go to the movie theater have no choice but to choose SVOD as an
alternative. Second, there was an increase in the time of using the internet during
COVID-19. Because people spend more time on the internet, they will have more
exposure to advertising. In consequence, the perceptions toward SVOD can be
easily affected.
<b>5.2. Contribution of the thesis </b>
Currently, the SVOD industry in Vietnam and the world was in the emerging
stage. By using the latest technology acceptance model, the thesis provides an early
framework for SVOD providers in finding factors affecting SVOD subscription
intention in Vietnam. The thesis also contributed two major findings to the literature.
First, since previous studies of SVOD mainly explained subscription
intention by using TAM or TPB, this study provides early empirical evidence
applying UTAUT2 to SVOD context to enrich the knowledge of the UTAUT2
model as well as studies of SVOD.
Second, the thesis found Media Exposure can strengthen Hedonic Motivation
and Behavioral Intention. This study is early research which adds Media exposure
as the moderating variable to the UTAUT2 model. Further research can try to test
media exposure as a moderating variable in different contexts.
<b>5.3. Implications for SVOD service providers </b>
</div>
<span class='text_page_counter'>(60)</span><div class='page_container' data-page=60>
51
<b>Price Value: The SVOD service providers need to have an appropriate </b>
pricing strategy to attract consumers to purchase their products. One of the
strategies they could think about is Profile Package. Currently, an SVOD account
can share up to four small accounts (known as Profile Package) at the same time.
Because it is cheaper when purchasing Profile Package, people tend to buy it from
the one who already has an account instead of buying an account from SVOD
providers. Therefore, SVOD providers can make an official group on social media
to gather people who have a demand to buy the Profile package of SVOD. By doing
so, providers of SVOD can gain a win-win situation: The consumers can acquire
and experiences SVOD at a reasonable price as well as SVOD providers can gain
more users, which is very important since the early stage of innovation is to attract
as many potential loyal users as possible before the market reaching a mature stage.
<b>Hedonic Motivation: The result of the study showed that people will have </b>
the intention to subscribe if they think SVOD service interesting. Therefore, SVOD
service providers should generate more content options to meet consumer’s tastes.
Besides, according to the recent research of Q&Me – a local market research
company, one of the factors which trigger the consumers to sign up for SVOD
services is Content features their favorite celebrities, so when producing original
content SVOD providers can think about inviting suitable celebrities for acting in
SVOD service provider’s movie. (Q&Me, 2020). Moreover, SVOD publisher
should provide other option which brings added value to consumers such as film
review article with comment or virtual reality film, …
<b>Social Influence: Because thesis results showed the recommendation of </b>
</div>
<span class='text_page_counter'>(61)</span><div class='page_container' data-page=61>
52
content. This method has already done by Netflix with the campaign promoting its
movie Money Heist, Itaewon Class,…
<b>Performance Expectancy: This factor has a small impact on subscription </b>
intention compared to other factors in the thesis. However, it still has its role since
the recommendation feature of SVOD is one of the features that make this service
unique compared with another illegal movie watching website. The service
providers need to enhance the recommendation/personalization algorithm in order
to make these features become a unique selling point for their services.
<b>Consumer Innovativeness: To increase the intention of SVOD service, </b>
SVOD providers need to introduce the service to this group of consumers. As a
result, when individuals with innovative trait have already experienced the service,
the information of SVOD service can spread quickly through word of mouth from
this person. According to Agarwal and Prasad (1988), the person who has consumer
innovative trait can change the perception of users who hesitate to change, so the
rate of SVOD adoption will be increased if there is enough people have innovative
trait satisfy with SVOD services. SVOD services providers could find this type of
consumer in the group fan of new products/ technology reviewers/streamers, which
consists of people who are curious about new products.
<b>Media Exposure: The results study shows that advertisements still an </b>
important part of the business activity of SVOD services providers. Although ads
cannot transfer into sales in the short-term, the result proves that it can enhance the
perception of consumers. SVOD needs to invest more in Media Advertising since it
was a good tool to gain awareness as well as attracting a consumer to have intention
toward SVOD services.
<b>5.4. Limitation and future research direction </b>
</div>
<span class='text_page_counter'>(62)</span><div class='page_container' data-page=62>
53
- The research had investigated 212 samples, still a small sample size in terms
of the quantitative analysis. Moreover, almost all sample are young people in
Hanoi, which mean that the representative is not quite. The sample is not
enough to generalize the current situation in Vietnam fully. Further study
needs to conduct on a different sample with more representative. Moreover,
there may be some problems related to the common method bias which
partly lead to some unwanted results.
- The study has found an interactive approach of Media Exposure to SVOD
advertisement to the relationship between Hedonic Motivation and
Subscription Intention. However, future studies need to investigate deeply
which types of advertisements have an impact on this phenomenon. Also,
some other media such as E-Word-of-mouth need to be concerned to have a
better result of the moderating effect of Media Exposure. Moreover, different
settings and contexts need to be tested since media exposure to advertising
can be different in other settings.
</div>
<span class='text_page_counter'>(63)</span><div class='page_container' data-page=63>
54
<b>REFERENCES </b>
A- Qader, I., & Zainuddin, Y. (2011). The Impact of Media Exposure on Intention
<i>to Purchase Green Electronic Products amongst Lecturers. International </i>
<i>Journal </i> <i>of </i> <i>Business </i> <i>and </i> <i>Management., </i> <i>6(3), </i> 240 - 248.
doi:
Agarwal, R., & Prasad, J. (1988). A conceptual and operational definition of
personal innovativeness in the domain of information technology.
<i>Information </i> <i>Systems </i> <i>Research, </i> <i>9(2), </i> 204-215.
doi:
<i>Ajzen, I. (1991). The theory of planned behavior. Organizational Behavior and </i>
<i>Human </i> <i>Decision </i> <i>Processes, </i> <i>50(2), </i> 179-221.
doi:
Ana, S., Minoo, F., & Aviv, S. (2007). Hofstede's dimensions of culture in
<i>international marketing studies. Journal of Business Research, 60(3), </i>
277-284. doi:
<i>Austerberry, D. (2005). The technology of Video and Audio Streaming. New York: </i>
Routledge. doi:
Baabdullah, A. (2018). Consumer adoption of mobile social network games
(M-SNGs) in Saudi Arabia: the role of social influence, hedonic motivation and
trust. <i>Technology </i> <i>in </i> <i>Society, </i> <i>53, </i> 91-102.
doi:
Bass, F. (1969). A New Product Growth Model for Consumer Durables.
<i>Management </i> <i>Science, </i> <i>15(5), </i> 215-227.
doi:
Bautista, J., Lin, T., & Leng, T. (2016). How and Why Users Use Social TV
<i>Systems? A Systematic Review of User Studies . Proceedings of the 49th </i>
<i>Hawaii International Conference on System Sciences (HICSS49), (pp. </i>
3868-3877). Singapore.
<i>Ben, M. (2019, Jun 6). “Global OTT video market to be worth $72.8B by 2023, </i>
<i>report </i> <i>says”. </i> Retrieved from FierceVideo:
<i>BGR. (2020, January 16). Netflix is going to spend more than $17 billion on </i>
</div>
<span class='text_page_counter'>(64)</span><div class='page_container' data-page=64>
55
Brown, S., & Venkatesh, V. (2005). A Model of Adoption of Technology in the
Household: A Baseline Model Test and Extension Incorporating Household
Life Cycle. <i>MIS </i> <i>Quarterly, </i> <i>29(3), </i> 399-426.
doi:
Burton , J., Gollins, J., McNeely, L., & Walls, D. (2019). Revisiting the
Relationship between Ad Frequency and Purchase Intentions: How Affect
and Cognition Mediate Outcomes At Different Levels of Advertising
Frequency. <i>Journal </i> <i>of </i> <i>Advertising </i> <i>Research, </i> <i>59(1), </i> 1-13.
doi:
Cebeci, U., Ince, O., & Turkcan, H. (2019). Understanding the Intention to Use
Netflix: An Extended Technology Acceptance Model Approach.
<i>International Review of Management and Marketing, 9(6), 152-157. </i>
doi:
Chao, C., Mike, R., & Felix, T. (2012). Consumer innovativeness influence on
<i>really new product adoption. Austrailian Marketing Journal, 20(3), 211-217. </i>
doi:
Chen, L., Zhou, Y., & Chiu, D. (2014). A Study of User Behavior in Online VoD
Services. <i>Computer </i> <i>Communications, </i> <i>46, </i> 66-75.
doi:
Childers, T., Carr, C., & Peck, J. (2001). Hedonic and Utilitarian Motivations for
<i>Online Retail Shopping Behavior. Journal of Retailing, 77(4), 511-535. </i>
doi:
Christakis, D., Ramirez, J., Ferguson, S., Ravinder, S., & Ramirez , J. (2018). How
early media exposure may affect cognitive function: A review of results from
<i>observations in humans and experiments in mice. Proceedings of the </i>
<i>National </i> <i>Academy </i> <i>of </i> <i>Sciences, </i> <i>115, </i> 9851-9858.
doi:
Christensen, C., Michael , R., & Rory, M. (2015). What Is Disruptive Innovation?
<i>Harvard Business Review, 44-53. </i>
Chu, C., & Lu, H. (2007). Factors influencing online music purchase intention in
Taiwan: An empirical study based on the value-intention framework. .
<i>Internet </i> <i>Research, </i> <i>17(2), </i> 139-155.
</div>
<span class='text_page_counter'>(65)</span><div class='page_container' data-page=65>
56
Dabholkar, P., & Bagozzi, R. (2002). An Attitudinal Model of Technology-Based
Self-Service: Moderating Effects of Consumer Traits and Situational Factors.
<i>30(3), 184-201. doi: </i>
Dardas, L., & Ahmad, M. (2015). Coping strategies as mediators and moderators
between stress and quality of life among parents of children with autistic
<i>disorder. Stress and Health: Journal of the International Society for the </i>
<i>Investigation of Stress, 31(1), 5-12. doi: </i>
Dasgupta, S., & Grover, P. (2019). Understanding Adoption Factors of
<i>Over-the-Top Video Services Among Millennial Consumers (2019). International </i>
<i>Journal of Computer Engineering and Technology, 10(1), 61-71. Retrieved </i>
from
Davis, F. (1989). Perceived usefulness, perceived ease of use, and user acceptance
of information technology. <i>MIS </i> <i>Quarterly, </i> <i>13(3), </i> 319-340.
doi:
Davis, F. (1993). User acceptance of information technology: system characteristics,
<i>user perceptions and behavioral impacts. International Journal of </i>
<i>Man-Machine </i> <i>Studies, </i> <i>38(3), </i> 475-487.
doi:
<i>DeFleur, M., & Everette, D. (1988). Understand Mass Media. Boston: Houghton </i>
Mifflin; 2 r.e. edition.
Diaz, M., & Loraas, T. (2010). Learning new uses of technology while on an audit
engagement: Contextualizing general models to advance pragmatic
<i>understanding. International Journal of Accounting Information Systems, </i>
<i>11(1), 61-77. doi: </i>
Dodds, W., Monroe, K., & Grewal, D. (1991). Effects of Price, Brand, and Store
<i>Information on Buyers' Product Evaluations. Journal of Marketing Research, </i>
<i>28(3), 307-319. doi: </i>
Doney, P., Cannon, J., & Mullen, M. (1998). Understanding the influence of
<i>national culture on the development of trust. Academy of Management </i>
<i>Review, 23(3), 601-620. doi: </i>
<i>Donthu, N., & Garcia, A. (1999). The Internet Shopper. Journal of Advertising </i>
<i>Research, 39(2), 52-58. </i>
Dörr, J., Wagner, T., Benlian, A., & Hess, T. (2013). Music as a service as an
<i>alternative to music piracy? Business & Information Systems Engineering, </i>
</div>
<span class='text_page_counter'>(66)</span><div class='page_container' data-page=66>
57
Emad, A., & Michael, P. (2009). Internet Banking in Jordan: An Arabic Instrument
<i>Validation Process. The International Arab Journal of Information </i>
<i>Technology, 6(3), 235-247. </i>
Eneizan, B., Mohammed, A., & Alnoor, A. (2019). Customer acceptance of mobile
marketing in Jordan: An extended UTAUT2 model with trust and risk factors.
<i>International Journal of Engineering Business Management., 11(1), 1-10. </i>
doi:
<i>Fishbein, M., & Ajzen, I. (1975). Belief, Attitudes, Intention and Behaviour: An </i>
<i>Introduction to theory and Research. Reading, MA: Addison-Wesley. </i>
Flynn, L., & Goldsmith, R. (1993). A Validation of the Goldsmith and Hofacker
<i>Innovativeness Scale. Educational and Psychological Measurement, 53(4), </i>
1105-1116. doi:
Foxall, & Bhate. (1991). Cognitive style, personal invlolvement and situation as
determinants of computer use. <i>Technovation, </i> <i>11(4), </i> 183-200.
doi:
<i>Geogre, D., & Mallery, P. (2010). SPSS for Windows Step by Step: A Simple Guide. </i>
NJ: Prentice Hall: Upper Saddle River.
Goldsmith, R. (2000). How innovativeness differentiates online buyers. Quarterly
<i>Journal of Electronic Commerce, 1(4), 323e333. Quarterly Journal of </i>
<i>Electronic Commerce, 1(4), 323-333. </i>
<i>Hair, J., Black, W., Babin, B., & Anderson, R. (2013). Multivariate Data Analysis. </i>
<i>Hayes, A. (2013). Introduction to Mediation, Moderation, and Conditional. New </i>
York: NY: Guilford.
<i>Heijden, H. v. (2004). User Acceptance of Hedonic Information Systems. MIS </i>
<i>Quarterly, 28(4), 695-704. doi: </i>
Hirschman,, E. (1980). Innovativeness, novelty seeking, and consumer creativity.
<i>Journal </i> <i>of </i> <i>Consumer </i> <i>Research, </i> <i>7(3), </i> 283-295.
doi:
Ho, & Wu. (2011). Role of innovativeness of consumer in relationsship between
<i>perceived attributes of new products and intention to adopt. International </i>
<i>Journal of Electronic Business Management, 9(3), 258-266. </i>
Im, S., Bayus, B., & Mason, C. (2003). An empirical study of innate consumer
innovativeness, personal characteristics, and new product adoption behaviour.
<i>Journal of the Academy of Marketing Science, 31(1), 61-73. </i>
</div>
<span class='text_page_counter'>(67)</span><div class='page_container' data-page=67>
58
Indrawati, & Kusumoaji, S. (2015). The use of modified theory of acceptance and
use of technology 2 to predict propecstive users' intention in adopting TV
<i>Streaming. Proceedings of the 5th International Conference on Computing </i>
<i>and Informatics, ICOCI 2015 (pp. 206-215). Istanbul: Universiti Utara </i>
Malaysia.
Jan, I., Ji, S., & Yeo, C. (2019). Values and Green Product Purchase Behavior: The
Moderating Effects of the Role of Government and Media Exposure.
<i>Sustainability, 11(23), 6642. doi: </i>
Khofanda, M., & Fajarindra Belgiawan, P. (2018). Sweetened Packaged Beverage
Purchase Intention and Behavior based on Subjective Norm, Perceived Risk,
and Perceived Value. <i>KnE </i> <i>Social </i> <i>Sciences, </i> <i>3(10), </i> 884–902.
doi:
Kim, J., Kim, S., & Nam, C. (2016). Competitive dynamics in the Korean video
<i>platform market: Traditional Pay TV platform vs. OTT platforms. Telematics </i>
<i>and </i> <i>Informatics, </i> <i>33(2), </i> 711-721.
doi:
Lee, C., Nagpal, P., Ruane, S., & Lim, H. (2018). Factors Affecting Online
<i>Streaming Subscriptions. Communications of the IIMA, 16(2). Retrieved </i>
from
Lee, J., & Hong, I. (2016). Predicting positive user responses to social media
advertising: The roles of emotional appeal, informativeness, and creativity.
<i>International Journal of Information Management, 36(3), 360-373. </i>
doi:
Lee, P., Koo, C., & Chung, N. (2019). The Threats of North Korea’s Missile and
<i>Visitors’International Conference Choice Behaviour. Sustainability, 11(18), </i>
5097. doi:
Leong, L., Ooi, K., Chong, A., & Lin, B. (2013). Modelling the stimulators of the
behavioral intention to use mobile entertainment: does gender really matter? .
<i>Computers </i> <i>in </i> <i>Human </i> <i>Behavior, </i> <i>29(5), </i> 2109-2121.
doi:
Li, J., & Kishore, R. (2006). How robust is the UTAUT instrument? A multigroup
invariance analysis in the context of acceptance and use of online community
<i>weblog systems. SIGMIS CPR '06: Proceedings of the 2006 (pp. 183-189). </i>
DBLP.
</div>
<span class='text_page_counter'>(68)</span><div class='page_container' data-page=68>
59
<i>Llamas, R., & Stofega, W. (2009). Worldwide Converged Mobile Device 2009-2013 </i>
<i>Forecast Update: September 2009. Framingham: IDC. </i>
<i>Louis, B. (2018, Oct 12). How Netflix Expanded to 190 Countries in 7 Years. </i>
Retrieved from Harvard Business Review:
<i>Luu, N. (2019, November 25). "Head of the Gorvernment Office Mai Tien Dung </i>
<i>asking Netflix to producing firm in Vietnam". Retrieved from </i>
VietnamFinance:
/>
nghi-netflix-san-xuat-phim-quay-canh-tai-viet-nam-20180504224231804.htm
Lwin, M., Lee, E., & Ho, S. (2014). The role of media exposure, attitude toward
exercise and exercise belief on boys’ and girls’ intention to exercise.
<i>Conference of Communication, Medicine and Ethics. Switzerland: At </i>
Lugano.
<i>MIC. (2019, 12 25). OTT TV - A service trend in international intergration. </i>
Retrieved from Authority of Broadcasting and Information system:
/>tren-mang-internet-xu-the-cung-cap-dich-vu-trong-thoi-ky-hoi-nhap-quoc-te/107046
Migley, D., & Downling, G. (1978). Innovativeness: The Concept and Its
Measurement. <i>Journal </i> <i>of </i> <i>Consumer </i> <i>Research, </i> <i>4(4), </i> 229-242.
doi:
<i>Minh, L. (2019, February 23). Netflix cannot find grip on Vietnam. Retrieved from </i>
Vietnam Investment Review:
Muhammad, A., & Tanveer, A. (2015). The Impact of Advertisement on
Consumer's Purchase Intentions. <i>SSRN </i> <i>Electronic </i> <i>Journal. </i> doi:
Munnukka, J. (2008). Customers' purchase intentions as a reflection of price
<i>perception. Journal of Product & Brand Management. . Journal of Product & </i>
<i>Brand Management, 17(3), 188-196. doi:10.1108/10610420810875106. </i>
<i>Nielsen Corporation. (2020, March 7). Nielsen Report: How COVID19 affecting </i>
<i>Vietnam. </i> Retrieved from Brand Vietnam:
</div>
<span class='text_page_counter'>(69)</span><div class='page_container' data-page=69>
60
<i>Nunnally, J., & Bernstein, I. (1994). Psychometric theory. New York: McGraw-Hill </i>
Humanities.
Okumus, B., Ali, F., Bilgihan, A., & Ozturk, A. (2018). Psychological factors
influencing customers’ acceptance of smartphone diet apps when ordering
<i>food at restaurants. International Journal of Hospitality Management, 72(1), </i>
67-77. doi:
<i>Oxford University Press. (2019, October 20). Definition of streaming in English. </i>
Retrieved from Oxford Dictionaries:
Paswan, & Hirunyawipada. (2006). Consumer innovativeness and perceived risk:
<i>implication for high technology product adoption. Journal of Consumer </i>
<i>Marketing, 23(4), 182-198. doi: </i>
Prata, W., de Moraes, A., & Quaresma, M. (2012). User’s demography and
expectation regarding search, purchase and evaluation in mobile application
<i>store. A Journal of Prevention, Assessment and Rehabilitation, 41, </i>
1124-1131. doi:
<i>Q&Me. (2020). Vietnam video streaming market study. Hanoi: Q&Me. </i>
Qing, P., Lobo, A., & Chongguang, L. (2012). The impact of lifestyle and
ethnocentrism on consumers' purchase intentions of fresh fruit in China.
<i>Journal </i> <i>of </i> <i>Consumer </i> <i>Marketing, </i> <i>29, </i> 43-51.
doi:
Ramíez-Correa, P., Mariano-Mello, T., & Mariano, A. (2017). Factors explaining
the acceptance of Netflix in Brazil: the role moderator of the experience.
<i>14th INTERNATIONAL CONFERENCE ON INFORMATION SYSTEMS & </i>
<i>TECHNOLOGY MANAGEMENT - CONTECSI - 2017, (pp. 497-505). doi: </i>
Ramkumar, B., & Woo, H. (2018). Modeling consumers’ intention to use fashion
<i>and beauty subscription-based online services (SOS). Fashion and Textiles, </i>
<i>5(1), 22. doi: </i>
</div>
<span class='text_page_counter'>(70)</span><div class='page_container' data-page=70>
61
Rieke, S., Fowler, D., Chang, H., & Velikova, N. (2016). Exploration of factors
influencing body image satisfaction and purchase intent: Millennial females.
<i>Journal of Fashion Marketing and Management, 20(2), 208-229. doi: </i>
Robertson, T. (1967). The process of innovation and the diffusion of innovation.
<i>Journal of Marketing, 31, 14-19. doi:10.2307/1249295 </i>
<i>Roger, E. (1983). Diffusion of innovation. New York: The Free Press. </i>
<i>Roger, E. (2003). Diffusion of Innovation. New York: Free Press. </i>
Sardanelli, D., Vollero, A., Siano, A., & Bottoni, G. (2019). Lowering the pirate
flag: a TPB study of the factors influencing the intention to pay for movie
<i>streaming services. Electronic Commerce Research, 19, 549-574. </i>
doi:
Sari, H., Othman, M., & Al-Ghaili, A. (2019). A Proposed Conceptual Framework
for Mobile Health Technology Adoption Among Employees at Workplaces
<i>in Malaysia. Proceedings of the 3rd International Conference of Reliable </i>
<i>Information and Communication (IRICT 2018) (pp. 736-748). Kuala </i>
Lumpur: Springer Verlag.
doi:
Shiau, Wen-Lung, & Luo, M. (2012). Factors affecting online group buying
intention and satisfaction: A social exchange theory perspective. Computers
<i>in Human Behavior. Computers in Human Behavior, 28(6), 2431–2444. </i>
doi:
Shim, H., & Kim, K. (2018). An exploration of the motivations for binge-watching
<i>and the role of individual differences. Computers in Human Behavior, 82(2), </i>
94-100. doi:
Shim, H., Lim, S., Jung, E., & Shin, E. (2018). I hate binge-watching but I can’t
<i>help doing it: The moderating effect of immediate gratification. Telematics </i>
<i>and </i> <i>Informatics, </i> <i>35(7), </i> 1971-1979. doi:
Shin, D. (2009). Towards an understanding of the consumer acceptance of mobile
wallet. . <i>Computers </i> <i>in </i> <i>Human </i> <i>Behavior, </i> <i>25(6), </i> 1343-1354.
doi:
Singh, M., & Matsui, Y. (2017). How Long Tail and Trust Affect Online Shopping
<i>Behavior: An Extension to UTAUT2 Framework. . Pacific Asia Journal of </i>
<i>the </i> <i>Association </i> <i>for </i> <i>Information </i> <i>Systems, </i> <i>9(4), </i> 1-24.
</div>
<span class='text_page_counter'>(71)</span><div class='page_container' data-page=71>
62
Sohail, M., & Sana, R. (2011). The Impact of Television Advertisement Repetition,
Celebrity Endorsement and Perceived Quality on Consumer Purchase
<i>Decision. Australian Journal of Basic and Applied Sciences, 5(12), </i>
3044-3051.
Sriwindono, H., & Yahya, S. (2012). Toward Modeling the Effects of Cultural
<i>Dimension on ICT Acceptance in Indonesia. Procedia - Social and </i>
<i>Behavioral </i> <i>Sciences, </i> <i>65, </i> 833 - 838.
doi:
<i>Stastista. (2019a, October 20). Subscription Video On Demand. Retrieved from </i>
Stastista:
<i>Statista. (2020, May 3). Video Streaming (SvoD) Vietnam. Retrieved from Statista: </i>
<i>Statista. (2020, May 3). Vietnam: number of internet users 2017-2023. Statista. </i>
Retrieved from Statista:
Steenkamp, J., Hofstede, F., & Wedel, M. (1999). A Cross-National Investigation
into the Individual and National Cultural Antecedents of Consumer
<i>Innovativeness. 63. 55. 10.2307/1251945. Journal of Marketing(63), 55. </i>
doi:
Stroup, A., & Brandstetter, S. (2018). Effect of e-cigarette advertisement exposure
<i>on intention to use e-cigarettes. Addictive Behaviors, 82, 1-6. </i>
doi:
Sung, J., & Jo, J. (2018). The influence of perceived risk and consumer
<i>innovativeness on intention to use of internet of things service. Journal of </i>
<i>Theoretical and Applied Information Technology, 96(4), 1008-1017 . </i>
<i>Technavio. (2019). Over the Top (OTT) Market by Content Type and Geography - </i>
<i>Global Forecast & Analysis 2019-2023. Chicago: Technavio. </i>
Thong, J., Hong, S., & Tam, K. (2006). The Effects of Post-Adoption Beliefs on the
Expectation-Confirmation Model for Information Technology Continuance.
<i>International Journal of Human-Computer Studies, 64(9), 779-810. </i>
doi:
</div>
<span class='text_page_counter'>(72)</span><div class='page_container' data-page=72>
63
Venkatesh, V., Morris, M., Davis, G., & Davis, F. (2003). User Acceptance of
<i>Information Technology: Toward a Unified View. MIS Quarterly, 27(3), </i>
425-478. doi:
Venkatesh, V., Thong, J., & Xu, X. (2012). Consumer Acceptance and Use of
Information Technology: Extending the Unified Theory of Acceptance and
Use of Technology. <i>MIS </i> <i>Quarterly, </i> <i>36(1), </i> 157-178.
doi:
<i>VTV. (2020, Ferbruary 29). "10% users in VIetnam using SVOD". Retrieved from </i>
VTV:
Wagner, T., & Hess, T. (2013). What Drives Users to Pay for Freemium Services?
<i>Examining People’s Willingness to Pay for Music Services. Proceedings of </i>
<i>the 19th Americas Conference of Information Systems (AMCIS 2013) (pp. </i>
1-8). Chicago: Illinois, USA.
Wang, M., Guo, Z., & Shen, F. (2011). Message, Perception, and the Beijing
Olympics: Impact of Differential Media Exposure on Perceived Opinion
Diversity. . <i>Communication </i> <i>Research, </i> <i>38(3), </i> 422-445.
doi:
Wayne, M. (2018). Netflix, Amazon, and branded television content inon-demand
<i>video subscriptions. Media, Culture & Society, 40(5), 725-741. </i>
doi:
Wong , C., Garry, W., Loke, S., & Ooi, K. (2014). Mobile TV: a new form of
<i>entertainment. Industrial Management & Data Systems, 114(7), 1050 - 1067. </i>
doi:
Wong, C., & Hiew, P. (2005). Drivers and barriers of mobile entertainment:
<i>empirical study from a Malaysian survey. Proceedings of 2005 International </i>
<i>Conference on Services Systems and Services Management, ICSSSM 2005 </i>
(pp. 1325-1330). IEEE.
Xavier, A. (2013). Big & personal: Data and models behind Netflix
<i>recommendations. 1-6. 10.1145/2501221.2501222. Proceedings of the 2nd </i>
<i>International Workshop on Big Data, Streams and Heterogeneous Source </i>
<i>Mining: Algorithms, Systems, Programming Models and Applications (pp. </i>
1-6). BigMine '13 2013. doi:
<i>Yen, N. (2019, Dec 27). The new television industry or the battle of online </i>
<i>streaming giants. Retrieved from Authority of Broadcasting and Electronic </i>
</div>
<span class='text_page_counter'>(73)</span><div class='page_container' data-page=73>
truyen-hi%CC%80nh-moi-hay-cuoc-chien-cua-nhung-ga-khong-lo-streaming-truc-tuyen/107153
Yu, C. (2012). Factors affecting individuals to adopt mobile banking: Empirical
<i>evidence from the utaut model. Journal of Electronic Commerce Research, </i>
<i>2(13), 104-121. </i>
Yu, V., & Ting, H. (2011). Identifying key factors affecting consumers’ choice of
<i>wealth management services: An AHP Approach. Service Industries Journal, </i>
<i>31(6), 929–939. doi: </i>
</div>
<span class='text_page_counter'>(74)</span><div class='page_container' data-page=74>
65
<b>APPENDIX 1: Questionnaire </b>
<b>Vietnamese Version </b>
XinxchàoxAnh, xChị!
TôixtênxlàxLê Phú Khánh, họcxviênxcaoxhọcxngànhxQuảnxtrịxkinhxdoanh của
Đại học Việt Nhật – Đại học Quốc gia Hà Nội.
Tôixđangxthựcxhiệnxđềxtàixnghiênxcứuxvềx<i>Các</i>x<i>nhân tố</i>x<i>ảnh</i>x<i>hưởng</i>x<i>đến</i>x<i>ý</i>x<i>định đăng </i>
<i>kí sử dụng dịch vụ truyền hình trực tuyến trả phí của</i>x<i>khách hàng</i>x<i>cá</i>x<i>nhân</i>x<i>tại</i>x<i>Việt </i>
<i>Nam. Để</i>xhồnxthànhxđềxtài, xtơixrất mong nhận được sự quan tâm giúp đỡ của Anh
(Chị) trong việc tham gia trả lời bản câu hỏi này. Tất cảxnhữngxthôngxtin màxAnh
(Chị) cung cấp trong bản câu hỏi, chúng tơi chỉ sử dụng cho mục đích nghiên cứu
của đề tài.
<i>Dịch vụ thuê bao video theo nhu cầu hay cịn gọi là dịch vụ truyền hình trực tuyến </i>
<i>trả phí (Subcription Video-on-demand) là dịch vụ cung cấp kho nội dung bản quyền </i>
<i>giải trí đến người dùng. </i>
<i>Khách hàng sẽ phải đăng kí trả phí theo hình thức thuê bao từng tháng, </i>
<i>sau</i>x<i>khi</i>x<i>đăng</i>x<i>kí dịch</i>x<i>vụ, khách</i>x<i>hàng có thể tiếp cận những bộ phim/ chương trình </i>
<i>truyền hình đặc sắc trong nước và quốc tế cùng với các tính năng ưu việt khi sử </i>
<i>dụng dịch vụ: Xem truyền hình nội dung khơng giới hạn với chất lượng 4K, Ultra </i>
<i>HD; khơng quảng cáo; có thể xem phim trên bất cứ thiết bị nào có kết nối internet </i>
<i>(Smart TV, Android TV, Smartphone, Tablet,..) ở bất cứ thời gian và địa điểm nào. </i>
<i>Tìm kiếm phim dễ dàng với tính năng cá nhân hóa,.. </i>
<i>Hiện nay tại Việt Nam, các nhà cung cấp dịch vụ này là Netflix, CLIPTV, My K+ </i>
<i>NOW, gói VIP của những dịch vụ như FPT PLAY VIP, Zing VIP,.. </i>
Anh/Chị từng nghe/ biết đến dịch vụxtruyền hình trực tuyến trảx<i>phí (Netflix, FPT </i>
<i>Play VIP, CLIPTV, My K+ NOW,..) chưa? </i>
□ Đã nghe qua (Tiếp tục khảo sát)
□ Chưa nghe qua (Dừng khảo sát)
</div>
<span class='text_page_counter'>(75)</span><div class='page_container' data-page=75>
66
Xin vui lòng cho biết ý kiến của Anh (Chị) với mỗi câu hỏi dưới đây :
1. Giớixtính:
Nam Nữ
2. Nhóm tuổi:
Dưới 18 - 24 Từ 25 – 30 Từ 31 – 40 Trên 40
3. Nghềxnghiệpxhiệnxtại :
Học sinh/ sinh viên Nhân viên văn phòng
Doanh nhân/ lãnh đạo/ quản lý Khác
4. Mức lương hiện tại của Anh (Chị):
Dưới 5 triệu Từ 5 – 10 triệu
Từ 11 – 20 triệu Từ 20 triệu trở lên
5. Anh/chị có đang sử dụngxdịchxvụxtruyềnxhìnhxtrựcx<i>tuyến trả phí (Netflix, FPT </i>
<i>Play VIP, CLIPTV, My K+ NOW..) khơng : </i>
□ Có
□ Khơng
<i>6. Anh/chị biết đến dịch vụ truyền hình trực tuyến trả phí qua kênh thông tin nào </i>
(có thể chọn nhiều hơn 1 đáp án) :
□ Bạn bè
□ Người thân gia đình
□ Quảng cáo trên các phương tiện truyền thông
<i><b>PHẦN B : CÁC NHÂN TỐ ẢNH HƢỞNG ĐẾN DỊCH VỤ TRUYỀN </b></i>
<i><b>HÌNH TRỰC TUYẾN </b></i>
Xin vui lòng cho biết ý kiến của các Anh (Chị) về mức độ đồng ý với từng câu nhận
định dưới đây
1 2 3 4 5
Hồn tồn
khơng đồng ý
</div>
<span class='text_page_counter'>(76)</span><div class='page_container' data-page=76>
67
<b>Nhóm A : Cảm nhận sự hữu ích </b> <b>Mức độ đồng ý </b>
1. Sửxdụngxdịchxvụxtruyềnxhìnhxtrựcxtuyến trả phí có thể giúp
tơi tìm kiếm phim/chươngxtrìnhxtruyền hình hiệu quả
1 2 3 4 5
2. Sửxdụngxdịchxvụxtruyềnxhìnhxtrựcxtuyến trả phí có thể giúp
tơi tìmxkiếmxnhữngxbộxphim/chươngxtrìnhxtruyền hình một
cách nhanh chóng
1 2 3 4 5
3. Sửxdụngxdịchxvụxtruyềnxhìnhxtrựcxtuyếnxtrảxphíxcóxthể
giúpxtơi tiếtxkiệmxthờixgianxtìmxkiếmxnhữngxbộxphim/
chươngxtrình truyềnxhình.
1 2 3 4 5
4. Tơi nghĩ nhìn chung dịch vụ truyền hình trực tuyến trả phí rất
hữu íchxchoxcuộcxsống của tơi
1 2 3 4 5
<b>Nhóm B : Cảm nhận dễ sử dụng </b> <b>Mức độ đồng ý </b>
5. Học cách sửxdụngxdịchxvụxtruyềnxhìnhxtrựcxtuyến trả phí khá
dễ dàng 1 2 3 4 5
6. Tơi cảm thấy dịchxvụxtruyềnxhình trực tuyến trả phí dễ sử
dụng 1 2 3 4 5
7. Tơi có thể sửxdụng thành thạo dịchxvụ truyền hình trực tuyến
<i>trả phí một</i>xcáchxdễxdàng
1 2 3 4 5
8. Các chức năng của dịch vụ truyền hình trực tuyến trả phí đơn
giản và dễ hiểu 1 2 3 4 5
<b>Nhóm C : Ảnh hưởng xã hội </b> <b>Mức độ đồng ý </b>
9. Nhữngxngườixquanxtrọngxvớixtơi (giaxđình, bạnxbè,…)
choxrằng
tơixnênxsửxdụngxdịchxvụxtruyềnxhìnhxtrựcxtuyếnxtrảxphí
1 2 3 4 5
10. Nhữngxngườixảnhxhưởngxđếnxhànhxvixcủaxtôi (sếp, giáo
viên,…)
choxrằngxtơixnênxsửxdụngxdịchxvụxtruyềnxhìnhxtrựcxtuyến trả
phí
</div>
<span class='text_page_counter'>(77)</span><div class='page_container' data-page=77>
68
11. Nói chung, những người tơi quen khun tơi nên sử dụng
dịch vụ truyền hình trực tuyến trả phí 1 2 3 4 5
<b>Nhóm D : Cảm nhận sự thích thú </b> <b>Mức độ đồng ý </b>
12. Tơixcảmxthấyxsửxdụngxdịchxvụ truyền hình trực tuyến trả phí
rất vui 1 2 3 4 5
13. Tôi cảm thấy sửxdụngxdịch vụ truyền hình trựcxtuyếnxtrả phí
hấp dẫn 1 2 3 4 5
14. Tơi cảm thấy sử dụngxdịch vụ truyền hình trực tuyến trả phi
rất giải trí 1 2 3 4 5
<b>Nhóm E : Giá trị giá cả </b> <b>Mức độ đồng ý </b>
15. Dịch vụ truyềnxhình trực tuyến trả phí có mức giá hợp lý 1 2 3 4 5
16. Sử dụngxdịch vụ truyền hình trựcxtuyếntrả phí rất đáng đồng
tiền 1 2 3 4 5
17. Dịchxvụxtruyềnx<i>hình trực tuyến trả phi mang lại nhiều giá trị </i>
hơn so với chixphí bỏ ra.
1 2 3 4 5
<b>Nhóm F : Điều kiện vật chất </b> <b>Mức độ đồng ý </b>
18. Tơi nghĩ tơi có đủ nguồn lực cần thiết đểxsửxdụngxdịch vụ
truyền hình trực tuyến trả phí (đường truyền mạng, thiết bị
xem phim, thẻ thanh toán,.. )
1 2 3 4 5
19. Tơi nghĩ tơi có đủ kiến thức cần thiết để sử
dụngxdịchxvụxtruyền hình trực tuyến trả phí
1 2 3 4 5
20. Nhìn chung các dịch vụxtruyền hình trực tuyến trả phí có thể
tươngxthích với tất cácxthiết bị tơi có (Smartphone, laptop,
Android TV,..)
1 2 3 4 5
21. Tơixcó thểxnhận được sự trợ giúp của người khác nếu như có
vấn đề trong việc sử dụngxdịch vụxtruyền hìnhxtrực tuyến trả
phí.
</div>
<span class='text_page_counter'>(78)</span><div class='page_container' data-page=78>
69
<b>Nhóm G : Tính đổi mới </b> <b>Mức độ đồng ý </b>
22. Nếu tôi nghe về sản phẩm/dịch vụxcơngxnghệxmới, tơi sẽ tìm
cách để trải nghiệm nó 1 2 3 4 5
23. Trong số bạn bè, tôixthườngxlàxngườixđầu tiên thử nghiệm
cácxsản phẩm/dịch vụ công nghệ mới ra mắt
1 2 3 4 5
24. Nhìn chung tơi thích thú với việc thử dùng các
sảnxphẩm/dịchxvụ công nghệ mới
1 2 3 4 5
<b>Nhóm H : Ý</b>x<b>định</b>x<b>sử</b>x<b>dụng </b> <b>Mức độ đồng ý </b>
25. Tơi có ý định đăng kíxdịch vụ truyền hình trực tuyến trả phí
trong thời gian tới 1 2 3 4 5
26. Tơi nghĩ rằng mình sẽ đăng kí dịchxvụxtruyềnxhìnhxtrực tuyến
<i>trả phí trong thời gian tới </i> 1 2 3 4 5
27. Tơi có kế hoạch đăng kí dịch vụ truyềnxhìnhxtrựcxtuyến trả
phí trongxthờixgianxtới
1 2 3 4 5
<i><b>PHẦN C : Ý KIẾN VỀ PHƢƠNG TIỆN TRUYỀN THƠNG </b></i>
Xinxvuixlịngxchoxbiếtxýxkiếnxcủa Anh/chị dưới đây
1 2 3 4 5
Không bao giờ Hiếm khi Thỉnh thoảng Thường xuyên Rất thường
xuyên
<b>Nhóm K: Tiếp xúc với phương tiện truyền thông </b> <b>Tần suất </b>
1. Trong 30 ngày qua khi xem TV, bao lâu thì bạn thấy
quảng cáo về dịch vụ truyền hình trực tuyến trả phí trên
TV ?
1 2 3 4 5
2. Trong 30 ngày qua, bao lâu thì bạn thấy quảng cáo về dịch
vụ truyền hình trực tuyến trả phí trên báo và tạp chí mạng
?
</div>
<span class='text_page_counter'>(79)</span><div class='page_container' data-page=79>
70
3. Trong 30 ngày qua khi bạn truy cập mạng xã hội, bao lâu
thì bạn thấy quảng cáo về dịch vụ truyền hình trực tuyến
trả phí?
1 2 3 4 5
<i><b>Xin chân thành cám ơn sự giúp đỡ của Quý Anh (Chị). </b></i>
<i><b>English Version </b></i>
My name is Le Phu Khanh, MBA students at Vietnam Japan University.
<i>Now I am conducting research topic name Factor affecting intention to subscribe </i>
<i>SVOD in Vietnam. Hope I can gain support from you guy to finish the questionnaire. </i>
All of your information will be using only for research purposes. Thank you so
much !
SVOD is a service that provides unlimited entertainment content. To using service,
users need to register per month (subscribe) to access service. Some of the
remarkable feature of SVOD was : Watching content anytime, anywhere with video
quality up to 4K, no advertisement, can watching in any devices which have an
internet connection, find entertainment content easily with personalization/ content
recommendation feature,..
In Vietnam, some of the famous SVOD services are Netflix, ClipTV, My K+
NOW,.. as well as premium version of some services such as FPT Play VIP, Zing
VIP,…
<i>Have you heard about SVOD (Netflix, FPT Play VIP, CLIPTV, My K+ NOW,..) ? </i>
□ Yes (Continues the survey)
□ No (End the survey)
<i><b>PART A : BASIC INFORMATION </b></i>
Please choose information which suitable with you :
1. Gender:
</div>
<span class='text_page_counter'>(80)</span><div class='page_container' data-page=80>
71
From 18 - 24 From 25 – 30 From 31 – 40 Above 40
3. Current Job :
Student Officers staff
Entrepreneur/ leader/ manager Other
4. Salary
Below 5 million From 5 – 10 million
From 11 – 20 million Above 20 million
5.Are you currently use SVOD:
□ Yes
□ No
6. From which channel you know about SVOD (you can choose more than 1
answer):
□ Friend & Colleague
□ Family
□ Media Advertisement
<i><b>PART B : RESPONDENCE OPINION </b></i>
From what extent you agreed/ disagree with this opinion ?
1 2 3 4 5
Totally
disagree
Disagree Neutral Agreed Totally agreed
<b>Group A: Performance Expectancy </b>
<b>Degree of </b>
<b>agree </b>
1. I expect using SVOD improves my productivity in
searching film/ TV show
1 2 3 4 5
2. I expect using SVOD help me searched film/ TV show
</div>
<span class='text_page_counter'>(81)</span><div class='page_container' data-page=81>
72
3. I expect that I can save time using SVOD service when
searching for film/ TV show.
1 2 3 4 5
4. I expect that SVOD service isxveryxusefulxtoxmyxlife in
general.
1 2 3 4 5
<b>Group B: Effort Expectancy </b>
<b>Degree of </b>
<b>agree </b>
5. Learning how to use SVOD is easy for me.
1 2 3 4 5
6. I find SVODxeasyxtoxuse.
1 2 3 4 5
7. It is easy for me to become skillful at using SVOD
1 2 3 4 5
8. My Interaction with SVOD is clear and understandable
1 2 3 4 5
<b>Group C: Social Influences </b>
<b>Degree of </b>
<b>agree </b>
9. Peoplexwhoxareximportantxtoxmexthinkxthat I should use
SVOD.
1 2 3 4 5
10. PeoplexwhoxinfluencexmyxbehaviorxthinkxthatxI should use
SVOD.
1 2 3 4 5
11. People whose opinions that I value prefer that I use
SVOD.
1 2 3 4 5
<b>Group D : Hedonic Motivation </b>
<b>Degree of </b>
<b>agree </b>
12. Using SVOD is fun.
<sub>1 2 3 4 5 </sub>
13. Using SVOD is enjoyable.
<sub>1 2 3 4 5 </sub>
14. Using SVOD is very entertaining.
<sub>1 2 3 4 5 </sub>
<b>Group E : Price Value </b>
<b>Degree of </b>
<b>agree </b>
15. SVOD is reasonably priced.
1 2 3 4 5
</div>
<span class='text_page_counter'>(82)</span><div class='page_container' data-page=82>
73
<b>Group F: Facilitating Condition </b>
<b>Degree of </b>
<b>agree </b>
18. I have enough resourced to use SVOD (Internet/ smart TV
/ card credit / online payment method)
1 2 3 4 5
19. I have enough knowledge to use SVOD
1 2 3 4 5
20. SVOD compatible with other technology I used
(Smartphone/ Smart TV / laptop)
1 2 3 4 5
21. I can get help from other if I’m having trouble using
SVOD
1 2 3 4 5
<b>Group G: Consumer Innovativeness </b>
<b>Degree of </b>
<b>agree </b>
22. IfxIxheardxaboutxaxnewxinformationxtechnology,
Ixwouldxlook for ways to experiment with it.
1 2 3 4 5
23. Amongxmyxpeers, Ixamxusuallyxthexfirstxtoxtry out new
information technology.
1 2 3 4 5
24. In general, I like to try out new information technology.
<sub>1 2 3 4 5 </sub>
<b>Group H: Subscription Intention </b>
<b>Degree of </b>
<b>agree </b>
25. I intend to subscribe SVOD in future
<sub>1 2 3 4 5 </sub>
26.
I
predict I would subscribe SVOD in future1 2 3 4 5
27. I plan to subscribe SVOD in future.
<sub>1 2 3 4 5 </sub>
<i><b>PART C : MEDIA OPTION </b></i>
Please chose your opinion regarding this opinion:
1 2 3 4 5
</div>
<span class='text_page_counter'>(83)</span><div class='page_container' data-page=83>
74
<b>Group K: Media Exposure </b> <b>Degree of </b>
<b>Frequency </b>
4. Duringxthexpastx30xdaysxwhenxyouxwatchxTV,
howxoftenxdo you see advertisement for SVOD?
1 2 3 4 5
5. Duringxthexpastx30xdays, howxoftenxdoxyou see
advertisement for SVOD in the newspapers or
e-magazines?
1 2 3 4 5
6. Duringxthexpastx30 days, whenxyouxaccessxto the social
</div>
<span class='text_page_counter'>(84)</span><div class='page_container' data-page=84>
75
<b>APPENDIX 2: Cronbach’s alpha analysis </b>
<i><b>Performance Expectancy </b></i>
</div>
<span class='text_page_counter'>(85)</span><div class='page_container' data-page=85>
76
<i><b>Social Influence </b></i>
</div>
<span class='text_page_counter'>(86)</span><div class='page_container' data-page=86>
77
<i><b>Facilitating Condition </b></i>
</div>
<span class='text_page_counter'>(87)</span><div class='page_container' data-page=87>
78
<i><b>Consumer Innovativeness </b></i>
</div>
<span class='text_page_counter'>(88)</span><div class='page_container' data-page=88>
79
</div>
<span class='text_page_counter'>(89)</span><div class='page_container' data-page=89>
80
<b>APPENDIX 3: Explanatory Analysis </b>
<i><b>EFA for Independent Variable </b></i>
<b>KMO and Bartlett's Test </b>
Kaiser-Meyer-Olkin Measure of Sampling Adequacy. .789
Bartlett's Test of Sphericity Approx. Chi-Square 2809.456
df 276
Sig. .000
<b>Total Variance Explained </b>
Compon
ent
Initial Eigenvalues
Extraction Sums of Squared
Loadings
Rotation Sums of Squared
Loadings
Total
% of
Variance
Cumulativ
e % Total
% of
Variance
Cumulativ
e % Total
% of
Variance
Cumulativ
e %
1 5.925 24.689 24.689 5.925 24.689 24.689 3.176 13.235 13.235
2 2.840 11.832 36.520 2.840 11.832 36.520 2.616 10.899 24.134
3 2.273 9.470 45.990 2.273 9.470 45.990 2.550 10.623 34.757
4 2.019 8.413 54.403 2.019 8.413 54.403 2.417 10.069 44.827
5 1.787 7.447 61.851 1.787 7.447 61.851 2.409 10.038 54.865
6 1.489 6.203 68.054 1.489 6.203 68.054 2.321 9.669 64.534
7 1.301 5.421 73.475 1.301 5.421 73.475 2.146 8.941 73.475
8 <sub>.768 </sub> <sub>3.200 </sub> <sub>76.675 </sub>
9 <sub>.728 </sub> <sub>3.032 </sub> <sub>79.707 </sub>
10 <sub>.573 </sub> <sub>2.386 </sub> <sub>82.093 </sub>
11 <sub>.541 </sub> <sub>2.255 </sub> <sub>84.348 </sub>
12 <sub>.499 </sub> <sub>2.081 </sub> <sub>86.429 </sub>
13 <sub>.434 </sub> <sub>1.808 </sub> <sub>88.237 </sub>
14 <sub>.396 </sub> <sub>1.650 </sub> <sub>89.887 </sub>
15 <sub>.367 </sub> <sub>1.530 </sub> <sub>91.417 </sub>
16 <sub>.363 </sub> <sub>1.511 </sub> <sub>92.927 </sub>
17 <sub>.333 </sub> <sub>1.388 </sub> <sub>94.315 </sub>
18 <sub>.303 </sub> <sub>1.263 </sub> <sub>95.579 </sub>
19 <sub>.263 </sub> <sub>1.098 </sub> <sub>96.676 </sub>
20 <sub>.236 </sub> <sub>.985 </sub> <sub>97.661 </sub>
</div>
<span class='text_page_counter'>(90)</span><div class='page_container' data-page=90>
81
22 <sub>.183 </sub> <sub>.764 </sub> <sub>99.278 </sub>
23 <sub>.098 </sub> <sub>.408 </sub> <sub>99.686 </sub>
24 <sub>.075 </sub> <sub>.314 </sub> <sub>100.000 </sub>
Extraction Method: Principal Component Analysis.
<b>Rotated Component Matrixa</b>
Component
1 2 3 4 5 6 7
PE4 <sub>.879 </sub>
PE2 <sub>.872 </sub>
PE3 <sub>.858 </sub>
PE1 <sub>.822 </sub>
EE3 <sub>.844 </sub>
EE1 <sub>.794 </sub>
EE2 <sub>.754 </sub>
EE4 <sub>.731 </sub>
PV3 <sub>.888 </sub>
PV2 <sub>.854 </sub>
PV1 <sub>.847 </sub>
CI3 <sub>.878 </sub>
CI1 <sub>.867 </sub>
CI2 <sub>.827 </sub>
SI2 <sub>.864 </sub>
SI3 <sub>.859 </sub>
SI1 <sub>.855 </sub>
FC1 <sub>.810 </sub>
FC3 <sub>.780 </sub>
FC4 <sub>.770 </sub>
FC2 <sub>.645 </sub>
HM2 <sub>.821 </sub>
HM1 <sub>.788 </sub>
</div>
<span class='text_page_counter'>(91)</span><div class='page_container' data-page=91>
82
Extraction Method: Principal Component Analysis.
Rotation Method: Varimax with Kaiser Normalization.
a. Rotation converged in 6 iterations.
<i><b>EFA for Dependent Variable </b></i>
<b>KMO and Bartlett's Test </b>
Kaiser-Meyer-Olkin Measure of Sampling Adequacy. .694
Bartlett's Test of Sphericity Approx. Chi-Square 182.770
df 3
Sig. .000
<b>Total Variance Explained </b>
Component
Initial Eigenvalues Extraction Sums of Squared Loadings
Total % of Variance Cumulative % Total % of Variance Cumulative %
1 2.099 69.953 69.953 2.099 69.953 69.953
2 <sub>.516 </sub> <sub>17.197 </sub> <sub>87.151 </sub>
3 <sub>.385 </sub> <sub>12.849 </sub> <sub>100.000 </sub>
Extraction Method: Principal Component Analysis.
<b>Component Matrixa</b>
Component
1
BI1 .865
BI2 .835
BI3 .808
Extraction Method:
Principal Component
Analysis.
a. 1 components
extracted.
<i><b>EFA for Moderator </b></i>
<b>KMO and Bartlett's Test </b>
Kaiser-Meyer-Olkin Measure of Sampling Adequacy. .708
Bartlett's Test of Sphericity Approx. Chi-Square 187.969
df 3
</div>
<span class='text_page_counter'>(92)</span><div class='page_container' data-page=92>
83
<b>Total Variance Explained </b>
Component
Initial Eigenvalues Extraction Sums of Squared Loadings
Total % of Variance Cumulative % Total % of Variance Cumulative %
1 2.123 70.769 70.769 2.123 70.769 70.769
2 <sub>.461 </sub> <sub>15.357 </sub> <sub>86.126 </sub>
3 <sub>.416 </sub> <sub>13.874 </sub> <sub>100.000 </sub>
Extraction Method: Principal Component Analysis.
<b>Component Matrixa</b>
Component
1
ME3 .852
ME2 .836
ME1 .835
Extraction Method:
Principal Component
Analysis.
</div>
<span class='text_page_counter'>(93)</span><div class='page_container' data-page=93>
84
</div>
<span class='text_page_counter'>(94)</span><div class='page_container' data-page=94>
85
<b>APPENDIX 5: Regression analysis </b>
<b>Model Summaryb</b>
Model R R Square
Adjusted R
Square
Std. Error of the
Estimate Durbin-Watson
1 .729a .531 .515 .36605 1.866
a. Predictors: (Constant), Facilitating_Condition, Social_Influence, Effort_Expectancy,
Consumer_Innovative, Performance_Expectancy, Hedonic_Motivation, Price_Value
b. Dependent Variable: Behaviour_Intention
<b>ANOVAa</b>
Model Sum of Squares df Mean Square F Sig.
1 Regression 30.968 7 4.424 33.017 .000b
Residual <sub>27.335 </sub> <sub>204 </sub> <sub>.134 </sub>
Total <sub>58.303 </sub> <sub>211 </sub>
a. Dependent Variable: Behaviour_Intention
b. Predictors: (Constant), Facilitating_Condition, Social_Influence, Effort_Expectancy,
Consumer_Innovative, Performance_Expectancy, Hedonic_Motivation, Price_Value
<b>Coefficientsa</b>
Model
Unstandardized
Coefficients
Standardized
Coefficients
t Sig.
Collinearity
Statistics
B Std. Error Beta
Toleranc
e VIF
1 (Constant) <sub>1.292 </sub> <sub>.303 </sub> <sub>4.263 </sub> <sub>.000 </sub>
Effort_Expectancy .060 .049 .063 1.229 .220 .862 1.161
Social_Influence .166 .033 .267 5.049 .000 .822 1.217
Price_Value .161 .030 .305 5.437 .000 .730 1.370
Hedonic_Motivation .181 .058 .174 3.128 .002 .740 1.351
Performance_Expecta
ncy .098 .047 .113 2.086 .038 .786 1.273
</div>
<span class='text_page_counter'>(95)</span><div class='page_container' data-page=95>
86
<b>APPENDIX 6: Moderation Analysis </b>
<b>Performance Expectancy </b>
<b>Hedonic Motivation </b>
</div>
<span class='text_page_counter'>(96)</span><div class='page_container' data-page=96>
87
<b>Price Value </b>
</div>
<!--links-->
Music cover, the effects of it and The attitudes of NEU’s students to Music cover in Vietnam
- 23
- 568
- 0


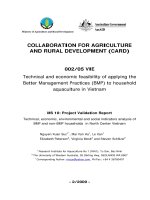
.push({});</script></div><br /> </p><!-- <p class="text-xl pb-40 overlay-read-more absolute bottom-0 left-0 w-full text-center bg-gradient-to-t from-white to-transparent">--><!----><!-- </p>--><!-- </div>--><!-- <a href="javascript:" class="bg-secondary px-6 py-2 rounded text-white absolute bottom-0 left-1/2 mb-4 transform -translate-x-1/2" id="showmore">Xem Thêm</a>--> </div> <div style="position: relative;" class="col-span-3 hidden md:block px-1 text-center"> <div style="position: sticky;top: 10px;width: 300px; height: 600px;"> <ins class="adsbygoogle" style="display:inline-block;width:300px;height:600px" data-ad-client="ca-pub-2979760623205174" data-ad-slot="8377321249"></ins><script defer>(adsbygoogle = window.adsbygoogle || []).push({});</script> </div> </div> </div> <div class="vf_link_relate px-2 my-2"> <h2 class="vf_doc_relate text-2xl font-bold my-4">Tài liệu liên quan</h2> <ul class="grid grid-cols-12 gap-2"> <li class="col-span-6 md:col-span-2"> <div class="card-doc " onclick="actionDocRelated(this)"> <a class="card-doc-img" href="https://text.123docz.com/document/314587-music-cover-the-effects-of-it-and-the-attitudes-of-neu-s-students-to-music-cover-in-vietnam.htm" title="Music cover, the effects of it and The attitudes of NEU’s students to Music cover in Vietnam"> <i class="icon i_type_doc i_type_doc1"></i> <img class="lazy" src="data:image/gif;base64,R0lGODlhAQABAIAAAP///wAAACH5BAEAAAAALAAAAAABAAEAAAICRAEAOw==" data-src="https://media.store123doc.com/images/document/13/ri/jn/medium_ubmLInD2Pj.jpg" width="124" height="179" alt="Music cover, the effects of it and The attitudes of NEU’s students to Music cover in Vietnam" onerror="this.src=)