- Trang chủ >>
- THPT Quốc Gia >>
- Sinh học
Impacts of climate change on the flow in Hong-Thai Binh and Dong Nai river basins
Bạn đang xem bản rút gọn của tài liệu. Xem và tải ngay bản đầy đủ của tài liệu tại đây (1.24 MB, 9 trang )
<span class='text_page_counter'>(1)</span><div class='page_container' data-page=1>
VNU Journal of Science, Earth Sciences 27 (2011) 98-106
98
Impacts of climate change on the flow in Hong-Thai Binh
and Dong Nai river basins
Tran Hong Thai*, Tran Thuc
<i>Vietnam Institute of Meteorology, Hydrology and Environment, </i>
<i>23/62 Nguyen Chi Thanh, Hanoi, Vietnam </i>
Received 15 March 2011; received in revised form 31 March 2011
<b>Abstract. Climate change (CC) is one of the most significant challenges facing human beings in </b>
the 21st century. CC will seriously affect lives, production and environment worldwide. It also
leads to the increasing temperature and one of its consequences is sea level rise, resulting in
unpredicted changes of the river flow. This may cause more severe floods, serious drought and
water shortage, further to continent of the salinity intrusions and negatively effect on the human’s
lives, socio-economic development. In order to assess the changes in flow in Hong - Thai Binh and
Dong Nai river basins under influences of CC, in the article flow from two mentioned basins is
analyzed under condition of CC. This is important basis to evaluate the effect of CC on other fields
relating to water resources. In the article, rainfall-runoff model (MIKE 11 - NAM model) was used
to determine the flow in essential locations in Hong – Thai Binh and Dong Nai river basins in the
three CC scenarios: A2, B2 and B1 [1].
<i>Keywords:</i> Climate change, flow, Hong-Thai Binh, Dong Nai.
<b>1. Introduction</b>∗∗∗∗
Hong-Thai Binh and Dong Nai river basins
are two of the three biggest river basins in
Vietnam. Impacts of CC on these river basins
can be very serious. One of the most effected
factors is the flow on the rivers. To estimate the
changes of flow on two river basins, MIKE
11-NAM was used.
MIKE 11-NAM can simulate flow of basin
based on rainfall and evaporation as input data.
The result of the routing process is the
discharge in the river. Rainfall and evaporation
_______
∗<sub> </sub><sub>Corresponding author. Tel.: 84-4-38359491 </sub>
E-mail:
data from 1980 to 2000 of meteorological
stations in the basins were used for calibration
and verification. NASH and RMSE indexes
were used for evaluating calculation results.
The flow at key stations was simulated
according to three scenarios (A2, B1, and B2)
[1].
</div>
<span class='text_page_counter'>(2)</span><div class='page_container' data-page=2>
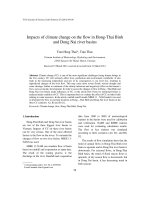
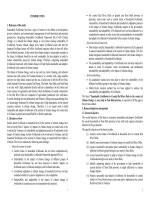
Figure 1. Hong-Thai Binh river basin.
</div>
<span class='text_page_counter'>(3)</span><div class='page_container' data-page=3>
T.H. Thai, T. Thuc / VNU Journal of Science, Earth Sciences 27 (2011) 98-106
100
<b>2. Application of MIKE NAM model for </b>
<b>simulating runoff in Hong-Thai Binh and </b>
<b>Dong Nai basin </b>
<i>2.1. Input data </i>
Meteorological data include potential
evaporation and rainfall data.
Hydrological data: Average daily discharge
data to 2010 at the 10 main hydrological
stations in Hong-Thai Binh river system and the
two ones in Dong Nai basin were collected for
model calibration and verification.
Observation data at 49 rainfall stations and
38 evaporation stations in Hong-Thai Binh river
basin and 27 rainfall stations, 11 evaporation
stations in Dong Nai basin from 1980 to 2000
were collected.
<i>2.2. Outputs </i>
Outputs are daily discharge at the key
hydro-stations in the rivers. These results can
be used for water balance and hydraulic
calculation.
<i>2.3. Calibration and verification </i>
Meteorological and hydrological data from
1980 to 2000 were used for calibration and
verification: Data in the period 1980-1990 were
used for calibration, and remaining data for
verification.
Parameters were estimated by trial-error
method (Table 1&2).
Based on hydrological station network as
well as water use and DEM, Hong-Thai Binh
and Dong Nai basin were divided into 16 and
29 sub-basins.
Table 1. NAM model parameters of some main sub-basins in Hong-Thai Binh basin.
Parameters
No Sub-basin Area (km2)
Umax Lmax CQOF CKIF CK1,2 TOF TIF TG CKBF
1 Lai Chau 33,882 13 102 0.228 200 35.8 0.631 3.54e-005 0.9 2,000
2 Ta Bu KG 10,607 10 221 0.628 200 50 0.533 3.92e-005 4.46e-005 1,243
3 Yen Bai 48,000 10 100 0.261 200 30.1 0.467 0.00978 9.97e-006 1,000
4 Bao Yen 4,960 23.6 165 0.307 498.4 29.4 0.459 0.453 0.7 2,000
5 Dao Duc 8,260 15.4 136 0.246 200 29.2 0.571 0.027 0.08 1,000
6 Chiem Hoa 16,500 6.75 139 0.489 471.6 42.7 0.344 0.528 0.2 1,800
7 Ghenh Ga KG 1,200 10 100 0.436 200 50 0.000429 0.000246 3e-005 1,000
8 Vu Quang KG 1,230 10.2 104 0.459 260.2 45.3 0.107 0.463 0.0282 3,019
9 Thac Buoi 2,220 10 100 0.476 200 26.9 2.77e-005 8.23e-005 0.176 3,219
10 Chu 2,090 10 100 0.697 200 33.2 0.0591 1.4e-005 0.864 1,263
Table 2. NAM model parameters of some main sub-basins in Dong Nai basin.
<b>Parameters </b>
<b>No </b> <b>Sub-basin </b> <b>Area (km2) </b>
<b>Umax Lmax CQOF CKIF CK1,2 TOF </b> <b>TIF </b> <b>TG </b> <b>CKBF </b>
1 Ta Pao 2,004.17 10 119 0.486 948.8 42.9 0.78 0.8 0.1 1,000
</div>
<span class='text_page_counter'>(4)</span><div class='page_container' data-page=4>
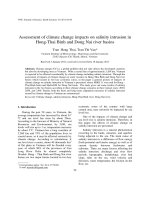
Figure 3. Observation discharge and Calculation discharge at some hydrostations in Hong-Thai Binh river basin.
<b>Flow duration curve at Ta PaoStation </b>
<b>(Calibration) </b>
0
50
100
150
200
250
300
350
400
450
500
0 20 40 60 80 100
<b>(%)</b>
<b>fl</b>
<b>o</b>
<b>w</b>
<b> (</b>
<b>m</b>
<b>^</b>
<b>3</b>
<b>/s</b>
<b>)</b> <b>Cal</b> <b>Obs</b>
<b>Flow duration curve at Ta PaoStation </b>
<b>(Verification) </b>
0
50
100
150
200
250
300
350
0 20 40 60 80 100
<b>(%)</b>
<b>fl</b>
<b>o</b>
<b>w</b>
<b> (</b>
<b>m</b>
<b>^</b>
<b>3</b>
<b>/s</b>
<b>)</b> <b>Cal</b> <b>Obs</b>
</div>
<span class='text_page_counter'>(5)</span><div class='page_container' data-page=5>
T.H. Thai, T. Thuc / VNU Journal of Science, Earth Sciences 27 (2011) 98-106
102
<b>3. Assessing impacts of climate change on </b>
<b>flow in Hong-Thai Binh and Dong Nai river </b>
<b>basin </b>
The flow at hydro-stations and sub-basins
was simulated according to three climate
change scenarios (A1, B1, B2). The period
from 1980 to 2000 is baseline one; the flow was
simulated in five periods: 2020 - 2039, 2040 -
2059, 2060 - 2079 and 2080 – 2099 for climate
change scenarios.
<i>3.1. Annual flow </i>
The total annual flow in the Hong-Thai
Bình river basin has an increasing tendency in
all three scenarios. While flow of the Dong Nai
river basin has a decreasing in the period from
2020 to 2100.
In Hong-Thai Binh river basin: There are
many large tributaries in the system. Variation
of simulated flow in the sub-basins is different
in each climate change scenario. However, it
can be seen that the trend of average annual
flow is upwards in comparison with baseline
period, and period by period. In accordance to
the changes of precipitation and potential
evaporation. In particular, the difference is
evident in the period 2080-2099.
In Dong Nai river: although both rainfall
and potential evaporation are increased, but the
increase in rainfall is not considered, while
there is a rapid increase in evaporation, thus it
lead to a strong decrease in flow in some
sub-basins. Among the three scenarios, the rates of
change are different; the decreasing rate of
annual flow in B1 scenarios is the highest and
in A2 scenario is the slowest.
<i>3.2. Flood season flow </i>
According to three climate change
scenarios, there are increasing trends of flood
season flow in Hong-Thai Binh basin. In
general, the increase in flood flow in the A2
scenario is the highest in comparison with the
baseline period and in the B1 scenario the
lowest. Meanwhile, the flow in the months of
flood season in Dong Nai basin has decreasing
tendency. The trend of change in monthly flow
changing during the flood season is similar to
that in flood season flow.
<i>3.2.1. For Hong – Thai Binh river basin </i>
In the period 2020-2039: Compared with
the baseline period, calculated flood flow at the
stations increase from 1 to approximately 2%.
Flood season discharge at Yen Bai station in
scenario A2is 1327m3/s increasing by 1.7%
compared with the baseline period; at Ta Bu
station is 2881m3/s increasing by 1.57%; at Vu
Quang station is 1769m3/s increasing by
1.13%. The increasing in flood flow
corresponding to scenarios at the three stations
Yen Bai, Ta Bu and Vu Quang are 1.72%,
1.56% and 1.29% (B2 scenario), 1.97%, 1.79%
and 1.46% (B1 scenario). Respectively, this
period shows that there are unconsidered
differences of the increase in flow in the
scenarios. The increase in flood flow in
scenario B1 is the highest.
</div>
<span class='text_page_counter'>(6)</span><div class='page_container' data-page=6>
<i>3.2.2. For Dong Nai River Basin </i>
In the period 2020-2039: Flood season
discharge at the Phuoc Hoa station in A2
scenario is 467m3/s decreasing by 4.5%
markedly compared with the baseline period; at
Ta Lai station is 544m3/s decreasing by 3.1%;
at station Ta Pao is 154m3/s decreasing by
1.9%; at Tri An station is 863m3/s decreasing
by 2.8% and at Phuoc Long station is 154m3/s
decreasing by 2.6%. The decrease of flood
flows under different scenarios at stations
Phuoc Hoa, Ta Lai, Ta Pao, Tri An and Phuoc
Long are 4.5%, 3.1%, 1.9%, 2.8 % and 2.5%
(B2 scenario); 4.7%, 3.0%, 1.8%, 2.7%, 2.7%
and 2.4% (B1 scenario). Respectively, this
period shows that there is not significant
difference the reduction level of flow among
the scenarios. The decrease in the B1 scenario
is the highest.
In the period 2080-2099: Flood season
discharge decreases quite markedly compared
with the baseline period as well as significant
differences in results calculated by the
scenarios. Accordingly, the calculation results
shows that B1 scenario results in the strongest
decreasing flood flow, at Phuoc Hoa, Ta Lai, Ta
Pao, Tri An and Phuoc Long stations are
456m3/s (decreasing by 6.7%), 520m3/s
(decreasing by 7.5%), 151m3/s (decreasing by
3.7% ), 839m3/s (decreasing by 5.6%) and
152m3/s (decreasing by 4.5%). Respectively,
the flood season flow in B2 scenario is smaller
and decreases in comparison with the baseline
period are 7.4% at Phuoc Hoa, 8.0% at Ta Lai,
4.7% at Ta Pao, 7.1% at Tri An and 5.7% at
Phuoc Long. In B1 scenario the decrease are
9.0%, 8.8%, 5.3%, 7.7% and 6.3% respectively.
</div>
<span class='text_page_counter'>(7)</span><div class='page_container' data-page=7>
T.H. Thai, T. Thuc / VNU Journal of Science, Earth Sciences 27 (2011) 98-106
104
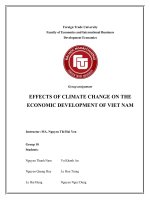
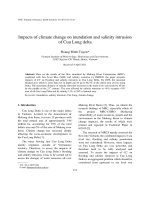
Figure 6. Annual flow, flood season flow, dry season flow in some sub-basins in Dong Nai river
basin under climate change scenarios.
<i>3.3. Dry season flow </i>
There is a decreasing trend of average dry
season flow in Hong-Thai Binh and Dong Nai
basins in all three climate change scenarios.
<i>3.3.1. For Hong-Thai Binh basin </i>
In the period 2020-2039: in scenario A2, the
average dry season flow at Yen Bai station is
382 m3/s, smaller 3.26% in comparison with
baseline; at Ta Bu station, it is 382m3/s, smaller
than baseline period 1,12% ; at Vu Quang
station in Lo river, average dry season flow is
492 m3/s, decreasing by 9m3/s (1.84%). The
decreases in B2 scenario is 1.72% (Yen Bai),
1.56% (Ta Bu), 1.29% (Vu Quang). And the
decrease in B1 scenario is 1.97%, 1.79%,
1.46% respectively.
In the period 2080-2099: in scenario A2,
average dry season flow at Yen Bai station
decreases 28 m3/s or 7.21% in comparison with
baseline; in Da river basin, at Ta Bu station
-1.58%. In Lo river, at Vu Quang station,
average dry season flow decreases 5.09%. The
decreases in B2 and B1 are 6.58%, 5.38% (Yen
Bai), 1.72%, 1.78% (Ta Bu), 4.56%, 3.78% (Vu
Quang) respectively.
<i>3.3.2. For Dong Nai basin </i>
In the period 2020 – 2039: In scenario A2,
the average flow in dry season at Phuoc Hoa
station is 69m3/s decreasing 3,9%; at Ta Lai
station is 113m3/s decreasing by 2,5%; at Ta
Pao station is 28m3/s decreasing by 4,0%, at Tri
An station is 117m3/s decreased by 3,4% and at
Phuoc Long station is 21m3/s decreased by
1,5% in comparison with baseline period. The
correlate decrease in scenario B2 is 3,9% at
Phuoc Hoa station, 2,6% at Ta Lai station, 40%
at Ta Pao station, 3,5% at Tri An station and
1,6% at Phuoc Long station. The correlate
decrease in scenario B1 is 4,1%, 2,7%, 4,3%,
3,7% and 1,7%.
</div>
<span class='text_page_counter'>(8)</span><div class='page_container' data-page=8>
Table 3. Changes in annual flow, flood, dry season flow on Hong-Thai Binh basin in climate change
scenarios in comparison with baseline period (%).
<b>Vu Quang </b> <b>Hoa Binh </b> <b>Yen Bai </b> <b>Chu </b>
<b>Period </b>
<b>A2 </b> <b>B1 </b> <b>B2 </b> <b>A2 </b> <b>B1 </b> <b>B2 </b> <b>A2 </b> <b>B1 </b> <b>B2 </b> <b>A2 </b> <b>B1 </b> <b>B2 </b>
2020-2039 0.33 0.52 0.47 0.23 0.35 0.25 0.78 0.91 0.79 0.23 0.35 0.25
2040-2059 0.77 0.97 1.04 1.05 1.01 1.12 1.61 1.57 1.69 1.05 1.01 1.12
2060-2079 1.46 1.29 1.70 2.12 1.43 1.98 2.73 2.03 2.60 2.12 1.43 1.98
Annual
2080-2099 3.04 1.41 2.57 3.97 1.59 2.93 4.66 2.18 3.56 3.97 1.59 2.93
2020-2039 1.13 1.46 1.29 1.70 1.97 1.72 1.34 1.54 1.35 1.70 1.97 1.72
2040-2059 2.21 2.43 2.57 3.40 3.32 3.55 2.55 2.49 2.66 3.40 3.32 3.55
2060-2079 3.69 3.09 3.88 5.63 4.20 5.31 4.15 3.14 3.94 5.63 4.20 5.31
Flood season
2080-2099 6.08 3.34 5.24 8.71 4.55 6.96 6.52 3.38 5.17 8.71 4.55 6.96
2020-2039 -1.84 -2.01 -1.74 -3.26 -3.49 -3.23 -1.37 -1.50 -1.35 -3.26 -3.49 -3.23
2040-2059 -3.08 -2.93 -3.05 -4.51 -4.44 -4.62 -2.01 -1.97 -2.07 -4.51 -4.44 -4.62
2060-2079 -4.51 -3.52 -4.14 -6.16 -5.12 -5.88 -2.72 -2.28 -2.58 -6.16 -5.12 -5.88
Dry season
2080-2099 -5.09 -3.78 -4.56 -7.21 -5.38 -6.58 -2.54 -2.43 -2.67 -7.21 -5.38 -6.58
Table 4. Changes in annual flow, flood, dry season flow on Dong Nai basin in climate change
scenarios in comparison with baseline period (%).
Station Ta Pao Phuoc Long
Scenario A2 B2 B1 A2 B2 B1
2000 - 2019 -0.91 -0.96 -0.91 -1.61 -1.69 -1.61
2020 - 2039 -1.89 -1.85 -1.79 -2.56 -2.48 -2.36
2040 - 2059 -2.71 -2.68 -2.73 -3.33 -3.28 -3.28
2060 - 2079 -3.32 -3.63 -3.90 -3.85 -4.34 -4.58
Annual
2080 - 2099 -3.71 -4.73 -5.29 -4.52 5.73 -6.29
2000 - 2019 -0.91 -0.96 -0.91 -1.61 -1.69 -1.61
2020 - 2039 -1.89 -1.85 -1.79 -2.56 -2.48 -2.36
2040 - 2059 -2.71 -2.68 -2.73 -3.33 -3.28 -3.28
2060 - 2079 -3.32 -3.63 -3.90 -3.85 -4.34 -4.58
Flood
season
2080 - 2099 -3.71 -4.73 -5.29 -4.52 -5.73 -6.29
2000 - 2019 -1.59 -1.56 -1.65 -1.09 -1.13 -1.03
2020 - 2039 -4.03 -4.01 -4.35 -1.48 -1.58 -1.47
2040 - 2059 -6.41 -6.56 -6.23 -2.11 -2.06 -1.77
2060 - 2079 -9.30 -8.86 -7.64 -3.12 -2.53 -1.99
Dry season
</div>
<span class='text_page_counter'>(9)</span><div class='page_container' data-page=9>
T.H. Thai, T. Thuc / VNU Journal of Science, Earth Sciences 27 (2011) 98-106
106
<b>4. Conclusion </b>
It can be seen that: in the three scenarios,
the average flow has an increasing tendency in
Hong-Thai Binh river basin and a decreasing
one in Dong Nai river basin. For seasonal flow,
in Hong-Thai Binh river basin, the trend of
flood flow is upwards, dry season flow
downwards. In Dong Nai river basin, the trend
of both flood-season flow and dry-season flow
is downwards.
<b>Acknowledgements </b>
The author acknowledges the financial
support by Danish International Development
Agency (DANIDA) for the project "Impacts of
climate change on water resources and
adaptation measures".
<b>References </b>
[1] Ministry of Natural resources and Environment,
</div>
<!--links-->