- Trang chủ >>
- Công nghệ thông tin >>
- Web
Optimization of polyphenol, flavonoid and tannin extraction conditions from Pouzolzia zeylanica L. benn using response surface methodology
Bạn đang xem bản rút gọn của tài liệu. Xem và tải ngay bản đầy đủ của tài liệu tại đây (6.97 MB, 10 trang )
<span class='text_page_counter'>(1)</span><div class='page_container' data-page=1>
<i>DOI: 10.22144/ctu.jen.2017.015 </i>
<b>OPTIMIZATION OF POLYPHENOL, FLAVONOID AND TANNIN </b>
<i><b>EXTRACTION CONDITIONS FROM Pouzolzia zeylanica L. BENN USING </b></i>
<b>RESPONSE SURFACE METHODOLOGY </b>
Nguyen Duy Tan1<sub>, Le Quoc Viet</sub>2<sub>, Vo Tan Thanh</sub>2<sub>, Nguyen Minh Thuy</sub>2
<i>1<sub>Faculty of Agriculture and Natural Resources, An Giang University, Vietnam </sub></i>
<i>2<sub>College of Agriculture and Applied Biology, Can Tho University, Vietnam </sub></i>
<b>Article info. </b> <b>ABSTRACT </b>
<i>Received date: 05/07/2016 </i>
<i>Accepted date: 30/03/2017</i> <i>In this study, the extraction of phenolic compounds from Pouzolzia Zeylanica L. Benn was conducted by using pure water as a solvent. The </i>
<i>optimal conditions for the extraction of three phenolic compounds such </i>
<i>as polyphenols, flavonoids and tannins were determined by using </i>
<i>re-sponse surface methodology (RSM). A central composite design (CCD) </i>
<i>was applied to investigate the effects of three independent variables, </i>
<i>namely the ratio of water-to-dried material (20:1 to 30:1, v/w), </i>
<i>tempera-ture (70 to 90°C) and time extraction (20 to 40 minutes). The dependent </i>
<i>variables were total polyphenol content (TPC), total flavonoid content </i>
<i>(TFC) and tannin content (TC). A second-order polynomial model was </i>
<i>used for predicting the response. Optimized conditions for bioactive </i>
<i>compounds extraction, water-to-dried material ratio, time and </i>
<i>tempera-ture extraction were 27 (v/w), 30 minutes and 81°C, respectively. The </i>
<i>experimental values agreed with predicted values within a 95% </i>
<i>confi-dence interval. Total polyphenol, flavonoid and tannin content extracted </i>
<i>by these optimized conditions were achieved (921 mgGAE/100g dried </i>
<i>material (DM), 563 mgQE/100g DM and 643 mgTAE/100g DM, </i>
<i>respec-tively). </i>
<i><b>Keywords </b></i>
<i>Extraction, phenolic </i>
<i>com-pounds, pouzolzia zeylanica </i>
<i>L. benn, optimization, </i>
<i>re-sponse surface methodology </i>
Cited as: Tan, N. D., Viet, L. Q., Thanh, V. T., Thuy, N. M., 2017. Optimization of polyphenol, flavonoid
<i>and tannin extraction conditions from Pouzolzia zeylanica L. benn using response surface </i>
<i>methodology. Can Tho University Journal of Science. Vol 5: 122-131. </i>
<b>1 INTRODUCTION </b>
<i>Pouzolzia zeylanica L. Benn is considered as a </i>
perennial herb, variation in size and habit; stem
erect or prostrate, 15-30 cm long. Leaves are 2-3.8
cm in length, ovate or ovate-lanceolate, obtuse,
acute or acuminate, entire. Plant contains flavone,
flavonoids, tannin, carotene, carotenoids, ascorbic,
tartaric, malic and pectic acids, gum, minerals and
their salts (Ghani, 2003); quercetin, vitexin,
iso-vitexin, phylanthin, metyl sterate and
<i>sitosterol-3-O-D-glucopyranoside (Thuy, 2007); </i>
-sitosterol, daucosterol, oleanolic acid, epicatechin,
</div>
<span class='text_page_counter'>(2)</span><div class='page_container' data-page=2>
stom-achache (Yusuf<i> et al., </i>2006). In the Nalbari
dis-trict, Assam leaf and stem paste is applied locally
once or twice daily for itching. Plant leaf and stem
rolled with banana leaf, heated and squeezed, juice
mixed with goat's milk, and taken once for
dysen-tery and loose stools of infant (Bhattacharjya and
Borah, 2008). In Eastern Ghats, Andhra Pradesh,
Indian paste of crushed shoots applied as poultice
to bone fractures (Ratnam and Raju, 2008). The
<i>plant Pouzolzia indica claimed to be useful in </i>
treat-ing snake poison in the Indian system of medicine
<i>(Ahmed et al., 2010). In Vietnam, Pouzolzia </i>
<i>zeylanica plant can be used as fresh or dried plant, </i>
decoction drunk to treat cough, pulmonary
tubercu-losis, sore throat, enteritis, dysentery (Chi, 2012).
<i>Traditionally, Pouzolzia zeylanica plants are </i>
pre-pared as an infusion with water, to make a tea. If
these infusions can be optimized in terms of their
phenolics content such as polyphenol, flavonoid
and tannin. They could have had potential as
<i>bev-erages with medicinal properties. Several in vitro </i>
researches have indicated ethanolic extracts of
<i>Pouzolzia zeylanica possessed antibacterial, </i>
anti-fungal and cytotoxic activities (Paul and Saha,
<i>2012; Saha et al., 2012; Saha and Paul, 2012b); it </i>
had no oral acute toxicity at the oral dose of 10 g
<i>material powder/kg (Tien et al., 2010). The </i>
<i>quanti-ty of phenolic compounds (e.g. polyphenol, </i>
flavo-noid and tannin) along with other factors influences
the quality of the infusion are important properties
in beverages as one of the important attributes of
food is their appearance. Therefore, it is important
to have information on the effect of extraction time
and temperature, solid to liquid ratio on the content
<i>of phenolics in Pouzolzia zeylanica extracts. </i>
<b>2 MATERIALS AND METHODS </b>
<b>2.1 Chemicals and reagents </b>
Folin-Ciocalteu, Folin-Denis reagents and
querce-tin, gallic acid, tannic acid were obtained from
Sigma Chemical Co. (USA) and Merck Chemical
Supplies (Germany). All the chemicals, including
the solvents, were of analytical grade.
<b>2.2 Sample preparation and extraction </b>
<i>Pouzolzia zeylanica plants were collected in March </i>
2015 from An Giang University. They were
har-vested after one-and-a-half-month cultivation, with
20-30 cm in height. The plants were then cleaned
with tap-water, sun dried until the final moisture
content about 12%, cut into small pieces about 2-3
cm long, packaged and stored in dark at room
<i>tem-The dried samples of Pouzolzia zeylanica were </i>
extracted with water using airtight extractor (model
GPA CC1-181907, Didatec Technologie France,
2007). String rate was maintained at 90 rounds per
minute (rpm). The extract samples were fixed a
volume for 5 liters. The samples were extracted at
temperature of (63, 70, 80, 90 and 97°C), in
dura-tion of (13, 20, 30, 40 and 47 min) and soludura-tion to
solid ratio of (17:1, 20:1, 25:1, 30:1 and 33:1 v/w).
The extracts were filtered by cloth and determined
their volumes. After that, the extracts were filtered
using Buchner funnel with Whatman’s No 1 filter
paper. The filtrate (crude extract) was diluted in
ethanol at an appropriate ratio using for analysis.
<b>2.3 Experimental design </b>
In this study, response surface methodology (RSM)
with central composite design (CCD) in form (23<sub> + </sub>
star) was used to investigate the effects of three
independent variables: X1 (extraction temperature),
X2 (extraction time) and X3 (water-to-dried material
ratio) on the extraction of TPC, TFC, and TC
con-tents. The independent variables were coded at five
levels (-, -1, 0, +1, +) and the complete design
consisted of 20 experimental points, including six
replications of the centre points.
<b>2.4 Statistical analysis </b>
Experimental data showed that the response
varia-bles were fitted to a quadratic polynomial model
(Equation 1). The general form of the quadratic
polynomial model was as follows:
Y = bo + b1 X1 + b2X2 + b3X3 + b1.1X12 + b2.2X22 +
b3.3X32 + b1.2X1X2 + b1.3X1X3 + b2.3X2X3 (1)
Where Y is the predicted response parameter, X1 is
extraction temperature, X2 is extraction time and
X3 is water-to-dried material ratio; bo is the mean
value of response at the central point of the
exper-iment; b1, b2 and b3 are the linear coefficients, b11,
b22 and b33 the quadratic coefficients and b12, b13
and b23 the interaction coefficients. Experimental
design and statistical treatment of result were
per-formed using STAGRAPHICS Plus 15.0 for
Win-dows.
</div>
<span class='text_page_counter'>(3)</span><div class='page_container' data-page=3>
icant for P-value ≤ 0.0001. Turkey’s test was also
performed for pair-wise comparisons at the 5%
level.
<b>2.5 Determination of chemical composition of </b>
<i><b>Pouzolzia zeylanica L. Benn </b></i>
<i>2.5.1 Total polyphenol content (mg GAE/100 g </i>
<i>dried material) </i>
Total polyphenol content was determined by
<i>Folin-Ciocalteu reagent method (Hossain et al., 2013). </i>
Each crude extract (0.2 mL) was taken in a test
tube and added 10% Folin-Ciocalteu reagent (1.5
mL). Then all test tubes were kept in a dark place
for 5 min. Finally, 5% Na2CO3 (1.5 mL) was added
to solution and mixed well in a vortex. Again, all
the test tubes were kept in the dark for 2 h. The
absorbance was measured for all solution by using
UV-spectrophotometer at constant wavelength 750
nm. Total polyphenol concentrations were
quanti-fied by calibration curve obtained from measuring
the absorbance of a known concentration of gallic
acid standard in ethanol (y = 0.0082x + 0.0595 and
r2<sub> = 0.9996). The total polyphenol content (TPC), </sub>
milligrams of gallic acid equivalents (GAE) per
100-gram dried material (DM), was calculated by
the following formula:
TPC = .
.
Where A is the absorbance of the test samples; DF
is the dilution factor; V is volume of the obtained
extracts, in liter; W is the weight of material
sam-ple, in gram; 100 is factor for conversion from 1
gram to 100 grams.
<i>2.5.2 Total flavonoid content (mg QE/100 g DM) </i>
Aluminum chloride colorimetric method was used
<i>for flavonoids determination (Eswari et al., 2013; </i>
<i>Mandal et al., 2013). About 1 mL of the crude </i>
ex-tracts/standard of different concentration solution
was mixed with 3 mL ethanol, 0.2 mL of 10%
aluminum chloride, 0.2 mL of 1M sodium acetate
and 5.8 mL of distilled water. It remained at room
temperature for 30 min. The absorbance of the
re-action mixture was measured at 415 nm with
spec-trophotometer against blank. The calibration curve
was prepared by diluting quercetin in ethanol (y =
0.0054 x + 0.0026 and r2<sub> = 0.9995). The total </sub>
fla-vonoid content (TFC), milligrams of quercetin
equivalents (QE) per 100-gram dried material
(DM), was calculated by the following formula:
TFC = .
.
Where A is the absorbance of the test samples; DF
is the dilution factor; V is volume of the obtained
extracts, in liter; W is the weight of material
sam-ple, in gram; 100 is factor for conversion from 1
gram to 100 grams.
<i>2.5.3 Tannin content (mg TAE/100 g DM) </i>
Tannin content was determined by Folin-Denis
<i>method (Laitonjam et al., 2013). Each crude </i>
ex-tract (0.5 mL) and distilled water (0.5 mL) were
taken in a test tube. Finally, the samples were
treat-ed with 0.5 mL of freshly prepartreat-ed Folin-Denis
reagent and 20% sodium carbonate (2 mL) was
added, shaken well, warmed on boiling water-bath
for 1 min and cooled to room temperature.
Absorb-ance of the coloured complex was measured at 700
nm. Tannin concentration was quantified based on
the calibration curve of tannic acid in ethanol (y =
0.0098x + 0.0478 and r2<sub> = 0.9996). The tannin </sub>
con-tent (TC), milligrams of tannic acid equivalents
(TAE) per 100-gram dried material (DM), was
calculated by the following formula:
TC = .
.
Where A is the absorbance of the test samples; DF
is the dilution factor; V is volume of the obtained
extracts, in litre; W is the weight of material
sam-ple, in gram; 100 is factor for conversion from 1
gram to 100 grams.
<b>3 RESULTS AND DISCUSSION </b>
<b>3.1 Effect of the extraction parameters on total </b>
<b>polyphenol content (TPC) </b>
</div>
<span class='text_page_counter'>(4)</span><div class='page_container' data-page=4>
<b>Table 1: ANOVA for the quadratic model of total polyphenol content (mg GAE/100g DM) </b>
<i><b>Source </b></i> <i><b>Sum of Squares </b></i> <i><b>Df </b></i> <i><b>Mean Square </b></i> <i><b>F-ratio </b></i> <i><b>P-value </b></i>
X1: Extraction Temperature 44130.6 1 44130.6 394.78 0.0000
X2: Extraction Time 1731.53 1 1731.53 15.49 0.0110
X3: Water-to-dried material ratio 23948.4 1 23948.4 214.23 0.0000
X1X1 65656.1 1 65656.1 587.33 0.0000
X1X2 7582.96 1 7582.96 67.83 0.0004
X1X3 13521.9 1 13521.9 120.96 0.0001
X2X2 2812.22 1 2812.22 25.16 0.0041
X2X3 859.051 1 859.051 7.68 0.0393
X3X3 50306.2 1 50306.2 450.02 0.0000
Lack-of-fit 2765.15 5 553.031 4.95 0.0520
Pure error 558.933 5 111.787 - -
Total (corr.) 200783. 19 - - -
R-squared 0.9834
R-squared (adjusted for d.f.) 0.9685
The coefficient of determination (R2<sub>) of the </sub>
pre-dicted models in this response was 0.9834 and
P-value for Lack of fit was 0.05. These P-values would
give a relative good fit to the mathematic model in
Equation 2.
TPC (mg GAE/100g DM) = -4653.53 + 102.36X
+ 28.96X + 54.54X - 0.675X - 0.308X X +
0.822X X - 0.139X + 0.207X X - 2.363X (2)
Where Y is the predicted TPC (%), X1 is extraction
temperature, X2 is extraction time and X3 is
water-to-dried material ratio.
Regression equation for evaluation total
polyphe-nol content showed that the linear coefficients of
temperature, time and water-to-dried material ratio
factors, and interaction coefficients of temperature
and to-dried material ratio, time and
water-to-dried material ratio had developed proportional
to polyphenolic content. However, the quadratic
coefficient of temperature, time and water-to-dried
material factors, interaction coefficient of
tempera-ture and time had relative in inverse ratio to
poly-phenol content.
</div>
<span class='text_page_counter'>(5)</span><div class='page_container' data-page=5>
The response surface plots shown in Figure 1 given
by their shapes, inform the significance of each
experimental parameter. It can be noticed from
Figure 1 (a) and (b) that temperature had a positive
quadratic effect on TPC since it increased with
temperature increase to reach an optimum of
86.04°C. The study results of Son and Tu (2009),
reported an increase in total polyphenolic content
in increasing temperature about 80-90°C for
poly-phenol extraction from dust green tea. The
enhanc-ing capacity of the temperature parameter on the
extraction efficiency of phenolic compounds was
reported by many authors (Spigno and Faveri,
<i>2007; Spigno et al., 2007; Rajha et al., 2012). It </i>
ameliorates the mass transfer, improves the
solubil-ization of the solutes in the solvent and reduces the
<i>surface tension and viscosity (Ramos et al., 2002). </i>
Nevertheless, beyond a certain value the
denatura-tion of the phenolic compounds can occur.
Regard-ing the duration of the extraction process, short
<i>(Bonilla et al., 1999; Pinelo et al., 2005; Yilmaz and </i>
Toledo, 2006) and long extraction periods can be
<i>found in the literatures (Jayaprakasha et al., 2001; </i>
<i>Pinelo et al., 2005). In Figure 1 (c) showed a negative </i>
quadratic effect on the TPC, there is a slightly
in-crease in TPC by increasing of time to reach an
opti-mum (29.45 min). The short time of extraction could
be avoided the degradation of phenolic compounds,
because during short time, the temperature enhanced
the extraction process, but with relatively longer time
for extraction, the effect is inverted, and the phenolic
compounds are threatened by oxidation or
degrada-tion (Yilmaz and Toledo, 2006). Figure 1 (b) and (c)
showed water-to-dried material ratio from 26-29
(v/w) well extraction of polyphenolic and reach an
optimum of 27.79 (v/w). Roughly, high amount of
solvent will create a chance for solute was
contact-ed with solvent. Thus, the solutions can be better
transferred from material to solvent (Cacace and
Mazza, 2003). The optimal conditions for
extrac-tion of total polyphenol content were found to be at
temperature of 86.04°C, extraction time of 29.45
min and extraction water-to-dried material of 27.79
(v/w). Under these optimized conditions, the highest
level of total polyphenol content was obtained
<b>(934.553 mg GAE/100g DM). </b>
<b>3.2 Effect of the extraction parameters on total </b>
<b>flavonoid content (TFC) </b>
Similarly, the results of ANOVA analysis (Table 2)
showed that the linear, quadratic and interaction
factors of temperature, time and water-to-material
ratio had effect on total flavonoid content from
obtained extract with reliability 95%. In there, the
linear and quadratic factors of extraction time and
water-to-dried material, quadratic factor of
extrac-tion temperature, interacextrac-tion of factor of
tempera-ture and water-to-material ratio were extremely
significant for P-value ≤ 0.0001; the linear factor of
temperature was highly significant for P-value ≤
0.01; the interaction factor of temperature and time,
and interaction factor of time and water-to-dried
material ratio were significant for P-value ≤ 0.05.
<b>Table 2: ANOVA for the quadratic model of total flavonoid content (mg QE/100g DM) </b>
<b>Source </b> <b>Sum of Squares </b> <b>Df Mean Square </b> <b>F-Ratio </b> <b>P-Value </b>
X1: Extraction Temperature 429.429 1 429.429 16.98 0.0092
X2: Extraction Time 3373.25 1 3373.25 133.40 0.0001
X3: Water-to-dried material ratio 17779.2 1 17779.2 703.11 0.0000
X1X1 73162.0 1 73162.0 2893.30 0.0000
X1X2 179.551 1 179.551 7.10 0.0446
X1X3 4767.76 1 4767.76 188.55 0.0000
X2X2 6512.85 1 6512.85 257.56 0.0000
X2X3 308.761 1 308.761 12.21 0.0174
X3X3 21947.2 1 21947.2 867.93 0.0000
Lack-of-fit 538.469 5 107.694 4.26 0.0689
Pure error 126.433 5 25.2867 - -
Total (corr.) 117395. 19 - - -
R-squared 0.9943
R-squared (adjusted for d.f.) 0.9892
The coefficient of determination (R2<sub>) of the </sub>
pre-dicted models in this response was 0.9943 and
P-value for Lack of fit was 0.0689. These P-values
would give a relative good fit to the mathematic
model in Equation 3.
TFC (mg QE/100g DM) = - 4076.34 + 99.814X +
4.287X + 42.477X - 0.712X + 0.047X X +
0.488X X - 0.213X + 0.124X X - 1.56X (3)
Where Y is the predicted TPC (%), X1 is extraction
temperature, X2 is extraction time and X3 is
</div>
<span class='text_page_counter'>(6)</span><div class='page_container' data-page=6>
Regression equation for evaluation total flavonoid
content showed that the linear coefficients of
tem-perature, time and water-to-dried material ratio
factors, and interaction coefficients of temperature
and time, temperature and water-to-dried material
ratio, and time and water-to-dried material ratio
that developed proportional to flavonoid content.
However, the quadratic coefficient of temperature,
time and water-to-dried material factors showed an
inverse correlation with the flavonoid contents.
Flavonoids extraction was reported to be affected
by many parameters such as time, temperature,
solvent concentrate, solid to liquid ratio and
<i>extrac-tion cycles (Silva et al., 2007; Liu et al., 2009; Zhu </i>
<i>et al., 2011). Herein, temperature had a positive </i>
quadratic effect on flavonoid content in Figure 2
(a) and (b). Temperature increase led to flavonoid
content increase to reach an optimum of 80.27°C.
Some authors showed the effect of temperature on
<i>flavonoids extraction. Sheng et al. (2013) </i>
ex-plained the better liberation of bioactive
com-pounds from plant cells by the decrease of solvent
viscosity and the increase of molecular movement
with temperature elevation. However, as the
ex-traction temperature was elevated higher than the
optimal temperature, the total flavonoid content
could be decreased. The bioactive compounds are
always sensitive at high temperature, so that
ex-traction at high temperature and longer time, the
bioactive compounds will be decomposed (Son and
Tu, 2009).
Time had a negative quadratic effect in Figure 2
(c), the TFC yield increase for 22-28 minutes then
decrease, probably due to the decomposition
phe-nomenon observed with relatively extended
<i>tion time (Sheng et al., 2013). The optimal </i>
extrac-tion time was reached 26.98 minutes.
The water-to-dried material ratio had a positive
quadratic effect on flavonoid content. It is noticed
from Figure 2 (b) and (c) that the flavonoid content
increased in increasing water-to-dried material
ratio to reach an optimum of 27.23 (v/w).
(a) (b)
(c)
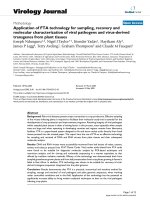
<b>Fig. 2: Total flavonoid content (TFC) surface plots. The three-dimensional graphs were plotted </b>
<b>be-tween independent variables while the remaining independent variable was kept at its zero level </b>
The optimum conditions for extraction of total
fla-vonoid content were found to be at extraction
tem-perature of 80.27°C, extraction time of 26.98 min
and extraction water-to-dried material of 27.23
<b>3.3 Effect of the extraction parameters on </b>
<b>tannin content (TC) </b>
</div>
<span class='text_page_counter'>(7)</span><div class='page_container' data-page=7>
quadratic factor of extraction temperature was
ex-tremely significant for P-value ≤ 0.0001; the linear
factors of temperature and water-to-dried material
ratio, interaction factors of time and water-to-dried
material ratio, quadratic factors of time and
water-to-dried material were highly significant for
P-value ≤ 0.01; the linear factor of time, interaction
of temperature and time factors, temperature and
water-to-dried material ratio were significant for
P-value ≤ 0.05.
<b>Table 3: ANOVA for the quadratic model of tannin content (mg TAE/100g DM) </b>
<b>Source </b> <b>Sum of Squares </b> <b>Df Mean Square </b> <b>F-Ratio </b> <b>P-Value </b>
X1: Extraction Temperature 2394.15 1 2394.15 17.36 0.0088
X2: Extraction Time 1456.02 1 1456.02 10.56 0.0227
X3: Water-to-dried material ratio 3095.76 1 3095.76 22.45 0.0052
X1X1 25103.9 1 25103.9 182.07 0.0000
X1X2 1326.13 1 1326.13 9.62 0.0268
X1X3 1501.52 1 1501.52 10.89 0.0215
X2X2 12725.7 1 12725.7 92.29 0.0002
X2X3 3793.21 1 3793.21 27.51 0.0033
X3X3 4927.27 1 4927.27 35.74 0.0019
Lack-of-fit 236.737 5 47.3474 0.34 0.8672
Pure error 689.413 5 137.883 - -
Total (corr.) 51240.5 19 - - -
R-squared 0.9819
R-squared (adjusted for d.f.) 0.9657
The coefficient of determination (R2<sub>) of the </sub>
pre-dicted models in this response was 0.9819 and
P-value for Lack of fit was 0.8672. These P-values
would give a relative good fit to the mathematic
model in Equation 4.
TC (mgTAE/100g DM) = - 4157.0 + 78.816X +
40.0497X + 74.977X - 0.417X - 0.129X X -
0.274X X - 0.297X - 0.435X X - 0.739X (4)
Where Y is the predicted TPC (%), X1 is extraction
temperature, X2 is extraction time and X3 is
water-to-dried material ratio.
(a) (b)
(c)
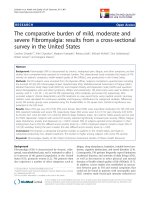
<b>Fig. 3: Tannin content (TC) surface plots. The three-dimensional graphs were plotted between </b>
<b>inde-pendent variables while the remaining indeinde-pendent variable was kept at its zero level </b>
Regression equation for evaluation tannin content
</div>
<span class='text_page_counter'>(8)</span><div class='page_container' data-page=8>
However, the quadratic coefficient of temperature,
time and water-to-dried material factors and
inter-action coefficients of temperature and time,
tem-perature and water-to-dried material ratio, time and
water-to-dried material ratio showed an inverse
correlation with the tannin content.
As showed in Figure 3 (a), (b) and (c), temperature,
time and water-to-dried material ratio had positive
quadratic effects on the tannin content. Tannin
con-tent increased in increasing time to reach its
opti-mal value after 30.21 minutes, later on, a decrease
was obtained.
The same tendency of tannin augmentation was
observed with temperature and water-to-dried
ma-terial ratio increase, until they reached 80.96o<sub>C and </sub>
26.79 (v/w) respectively. Tannin extraction from
bark was patented to be preferably conducted at
high temperatures, between 90°C and 100°C
(Con-noly, 1993).
The optimum conditions for extraction of tannin
content were found to be at extraction temperature,
time and water-to-dried material are 80.96o<sub>C, 30.21 </sub>
min and 26.79 (v/w) respectively. Under these
op-timized conditions, the experimental maximum
amount of tannin content was 643.127 mg
<b>TAE/100g DM. </b>
<b>3.4 Multiple response optimization </b>
The simultaneous optimization of multiple
re-sponses is a main concern for industrial
<i>applica-tions (Tsai et al., 2010) especially that the energy </i>
cost of the process in significantly diminished
when extraction parameters are optimized (Spigno
<i>et al., 2007). The response variables TPC, TFC and </i>
TC were optimized separately, therefore allowing
the targeting of a certain class of compounds only
by varying the extraction parameters. Yet, the
de-sirability function in the RSM was utilized to
re-veal the combination of the parameters
(tempera-ture, time and water-to-dried material ratio)
capa-ble of simultaneously maximizing all the response
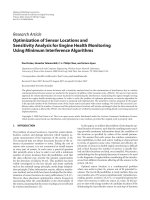
(TPC, TFC and TC). The overplay plot (Figure 4)
shows the outlines superposition of all the studied
responses and the simultaneous optimum for all
responses is showed by the black spot (Figure 4 a,
b and c).
(a) (b)
(c)
<b>Fig. 4: Overplay plots. It was plotted between independent variables while the remaining independent </b>
<b>variable was kept at its zero level </b>
<b>4 CONCLUSIONS </b>
Response Surface Methodology was revealed
</div>
<span class='text_page_counter'>(9)</span><div class='page_container' data-page=9>
water-to-dried material ratio are 81°C, 30 minutes
and 27 (v/w), respectively. Under these optimized
conditions, the highest content of TPC, TFC and
TC were found (921 mg GAE/100g DM, 563 mg
QE/100g DM and 643 mg TAE/100g DM,
<b>respec-tively). </b>
<b>REFERENCES </b>
Ahmed, A., Rajendaran, K., Jaiswal, D., Singh, H.P.,
Mishra, A., Chandra, D., Yadav, I.K., Jain, D.A.,
2010. Anti-snake venom activity of different extract
<i>of Pouzolzia indica against Russel viper venom. </i>
In-ternational Journal of Chem. Tech. Research. 2 (1):
744-751.
Bhattacharjya, D.K., Borah, P.C., 2008. Medicinal weeds
of crop fields and role of women in rural health and
hygiene in Nalbari district, Assam. Indian Journal of
Traditional Knowledge. 7 (3): 501-504.
Bonilla, F., Mayen, M., Merida J., Medina, M., 1999.
Ex-traction of phenolic compounds from red grape marc
fo-ruse as food lipid antioxidants. Food Chemistry. 66 (2):
209-215.
Cacace, J.E., Mazza, G., 2003. Mass transfer process
during extraction of phenolic compounds from
milled berries. Food and Engineering. 59: 379-389.
Chi, V.V., 2012. Dictionary medicinal plants in Vietnam.
Medicine Publishing House. pp. 189-191 (in
Viet-namese).
Connolly, D.L., 1993. Tannin extraction. US Patent. 5:
238-680.
Eswari, M.L., Bharathi, R.V., Jayshree, N., 2013.
Pre-liminary phytochemical screening and heavy metal
<i>analysis of leaf extracts of Ziziphus oenoplia (L) </i>
Mill. Gard. International Journal of Pharmaceutical
Sciences and Drug Research. 5 (1): 38-40.
Fu, M., Niu, Y.Y., Yu, J., Kong Q.T., 2012. Study on the
<i>chemical constituents in Pouzolzia zeylanica. Zhong </i>
Yao Cai. 35 (11): 1778-17781.
Ghani, 2003. Medicinal plants of Bangladesh: Chemical
constituents and uses, 2nd<sub> Ed., The Asiatic Society of </sub>
Bangladesh, Dhaka. pp. 104
Hossain, M.A., Raqmi, K.A.S., Mijizy, Z.H., Weli,
A.M., Riyami, Q., 2013. Study of total phenol,
fla-vonoids contents and phytochemical sreening of
<i>var-ious leaves crude extracts of locally grown Thymus </i>
<i>vularis. Asian Pacific Journal of Tropical </i>
<b>Biomedi-cine. 3 (9): 705-710. </b>
Jayaprakasha, G.K., Singh, R.P., Sakariah, K.K., 2001.
Antioxidant activity of grape seed (vitisvinifera)
<i>ex-tractson peroxidation models in vitro. Food </i>
Chemis-try. 73 (3): 285-290.
Laitonjam W.S., Yumnam R., Asem S.D.,
Wangkheirakpam S.D., 2013. Evaluative and
com-parative study of biochemical, trace elements and
<i>an-tioxidant activity of Phlogacanthus pubinervius T. </i>
<i>Anderson and Phlocanthus jenkincii C.B. Clarke </i>
leaves. Indian Journal of Natural Products and
Re-sources. 4 (1): 67-72.
Liu, H., Du, X., Yuan, Q., Zhu, L., 2009. Optimisation of
enzyme assisted extraction of silybin from the seeds
of silybum marianum by box-behnken experimental
design. Phytochemical Analysis. 20 (6): 475-483.
Mandal, S., Patra, A., Samanta, A., Roy, S., Mandal, A.,
Mahapatra, T.D., Pradhan, S., Das, K., Nandi, D.K.,
<i>2013. Analysis of phytochemical profile of </i>
<i>Termi-nalia arjuna bark extract with antioxidative and </i>
an-timicrobial properties. Asian Pacific Journal of
Trop-ical Biomedicine. 3 (12): 960-966.
Paul, S., Saha, D., 2012. In vitro screening of cytotoxic
<i>activities of ethanolic extract of Pouzolzia Zeylanica </i>
(L.) Benn. International Journal of Pharmaceutical
In-novations. 2 (1): 52-55.
Pinelo, M., Fabbro, P.D., Manzocco, L., Nunez, M.J.,
Nicoli, M.C., 2005. Optimization of continuous
phe-nol extraction from vitisvinifera byproducts. Food
Chemistry. 92 (1): 109-117.
Pinelo, M., Rubilar, M., Jerez, M., Sineiro J., Nunez,
M.J., 2005. Effect of solvent, temperature, and
sol-vent-to-solid ratio on the total phenolic content and
antiradical activity of extracts from different
compo-nents of grapepomace. Journal of Agricultural and
Food Chemistry. 53 (6): 2111-2117.
Rajha, H.N., Darra, N.E., Louka, N., Maroun, R.G.,
Ziegler W., Bochzelt, H., 2012. Valorization of
in-dustrial waste using energy saving procedures.
Phe-nolic compounds purification from grape
by-products by accelerated solvent extraction (ASE).
In-ternational Conferenceon Renewable Energies for
Developing Countries. pp. 1-5.
Ramos, L., Kristenson, E. M., Brinkman,U. A., 2002.
Currentuse of pressurised liquid extraction and
sub-critical water extractionin environmental analysis.
Journal of Chromatography A. 975 (1): 3-29.
Ratnam K. V., Raju R. R. V., 2008. Traditional medicine
used by the adivasis of Eantern Ghats, Andhra Pradesh
– for bone fractures. Ethnobotanical leaflets. 12: 19-22.
<i>Saha, D., Paul, S., 2012a. Studies on Pouzolzia zeylanica </i>
<i>(L.) Benn. (Family: Urticaceae). Lap Lambert </i>
Aca-demic Publishing, Germany. pp.18-35.
Saha, D., Paul, S., 2012b. Antifungal activity of ethanol extract
<i>of Pouzolzia Zeylanica (L.) Benn. International Journal of </i>
Pharmacy Teaching and Pratices. 3 (2): 272-274.
Saha, D., Paul, S., Chowdhury, S., 2012. Antibacterial
<i>activity of ethanol extract of Pouzolzia Zeylanica </i>
(L.) Benn. International Journal of Pharmaceutical
Innovations. 2 (1): 1-5.
Sheng, Z.L., Wan, P.F., Dong C.L., Li, Y.H., 2013.
Op-timizationof total flavonoids content extracted from
<i>Flospopuli using response surface methodology. </i>
In-dustrial Crops and Products. 43: 778-786.
Silva, E.M., Rogez H., Larondelle, Y., 2007.
<i>Optimiza-tionof extraction of phenolics from Inga edulis </i>
leaves using response surface methodology.
Separa-tion and PurificaSepara-tion Technology. 55 (3): 381-387.
Son V.H., Tu, H.D., 2009. Study on polyphenol
</div>
<span class='text_page_counter'>(10)</span><div class='page_container' data-page=10>
on polyphenol extraction. Journal of Science and
Technology. 47 (1): 81-86 (in Vietnamese).
Spigno, G., De Faveri, D. M., 2007. Antioxidants from
grape stalks and marc: influence of extraction
proce-dure on yield, purity and antioxidant power of the
ex-tracts. Journal of Food Engineering. 78 (3): 793-801.
Spigno, G., Tramelli L., De Faveri, D.M., 2007. Effects
ofextraction time, temperature and solvent on
concen-tration and antioxidant activity of grape marc
phenol-ics. Journal of Food Engineering. 81 (1): 200-208.
Thuy, L.T., 2007. Preliminary test of chemical
<i>compo-nents for Pouzolzia zeylanica L. Benn. Chemical </i>
Master Thesis, University of Natural Science, HCM
city (in Vietnamese).
Tien, T.M., Huong, N.T.T., Ngoc, D.T.M., Luan, T.C.,
Kinh, L.V., 2010. Experimental study on some
<i>pharmacological effects of Pouzolzia zeylanica and </i>
<i>Tinospora crispa. Medicine Journal of HCM city, </i>
special subject Traditional medicine. 14 (2): 116-120
(in Vietnamese).
Tsai, C.W., Tong, L.I., Wang, C.H., 2010. Optimization
of multiple responses using data envelopment
analy-sis and response surface methodology.Tamkang
Journal of Scienceand Engineering. 13 (2): 197-203.
Yilmaz, Y., Toledo, R.T., 2006. Oxygen radical
absorb-ance capacities of grape/wine industry by products
and effect of solvent type on extraction of grape seed
polyphenols. Journal of Food Composition and
Analysis. 19 (1): 41-48.
Yusuf, M. and Chowdhury, J.U., 1994. Medicinal plants
of Bangladesh. 1st<sub> ed. Dhaka, Bangladesh Council of </sub>
Scientific and Industrial Research. pp. 207
Zhu, X.Y., Mang, Y.L., Xie, J., Wang P., Su, W.K.,
</div>
<!--links-->