Stock returns volatility persistence and spillover effects: Empirical evidence from Vietnam
Bạn đang xem bản rút gọn của tài liệu. Xem và tải ngay bản đầy đủ của tài liệu tại đây (2.54 MB, 8 trang )
<span class='text_page_counter'>(1)</span><div class='page_container' data-page=1>
<i>DOI: 10.22144/ctu.jen.2017.005 </i>
<b>STOCK RETURNS VOLATILITY PERSISTENCE AND SPILLOVER EFFECTS: </b>
<b>EMPIRICAL EVIDENCE FROM VIETNAM </b>
Le Tin1<sub>, Yolanda T. Garcia</sub>2<sub>, Nguyen Huu Dang</sub>1
<i>1<sub>College of Economics, Can Tho University, Vietnam </sub></i>
<i>2<sub>Department of Economics, University of the Philippines Los Baños, Philippines </sub></i>
<b>Article info. </b> <b> ABSTRACT </b>
<i>Received date: 11/04/2016 </i>
<i>Accepted date: 30/03/2017 </i> <i><b> This study is aimed to investigate stock returns volatility of Ho Chi Minh </b>and Ha Noi stock exchanges. The data were collected from the daily stock </i>
<i>indexes of Vietnam stock market and nine global stock markets from the </i>
<i>State Securities Commission of Vietnam (SSC) and Yahoo Finance </i>
<i>web-site. The Generalized Autoregressive Conditional Heteroscedasticity </i>
<i>(GARCH) model was performed to investigate the determinants of the </i>
<i>persistence of volatility and volatility spillovers from foreign stock </i>
<i>mar-kets. The results indicated that there were evidences of volatility </i>
<i>cluster-ing and persistence of volatility in the two stock exchanges of Vietnam. </i>
<i>This study also showed that both Ho Chi Minh and Ha Noi stock </i>
<i>ex-changes were affected by major stock markets in Asia and the rest of the </i>
<i>world. Specifically, Vietnam stock market was mostly influenced by </i>
<i>Sin-gapore stock market. </i>
<i><b>Keywords </b></i>
<i>GARCH, persistence, </i>
<i>spillo-vers, stock market, volatility, </i>
<i>Vietnam </i>
Cited as: Tin, L., Garcia, Y. T., Dang, N. H., 2017. Stock returns volatility persistence and spillover effects:
<i>Empirical evidence from Vietnam. Can Tho University Journal of Science. Vol 5: 39-46. </i>
<b>1 INTRODUCTION </b>
Stock markets play an increasingly important role
in the financial economy of many countries in the
world. As the economy develops, it needs the
sup-port of a go-ahead stock market to manage its
fi-nancial capital. The stock market promotes the
needed capital accumulation and investment for
economic growth and development. Therefore, the
effectiveness of the stock market reflects the
coun-try's economic performance in the short, medium,
and long terms. However, the stock market is not
only responsive to various economic shocks in the
economy, but is also susceptible to political and
social unrest. Thus, it is often difficult to accurately
predict how the future stock market will evolve.
Hence, volatility modeling of the stock market
prices and returns are highly useful to investors,
risk-managers and policy-makers.
Vietnam stock market can be considered as a very
young and small market compared to other stock
markets in Asia. As an emerging market, it is
char-acterized by high volatility, capital illiquidity,
lim-ited capitalization, imperfect legal framework and
irrationality of investors as manifested by their
mob mentality. However, given the present
dynam-ic economy of Vietnam coupled with a strong legal
framework, both the Ho Chi Minh Stock Exchange
(HOSE) and Ha Noi Stock Exchange (HNX) stock
markets have huge potentials for development in
the future.
</div>
<span class='text_page_counter'>(2)</span><div class='page_container' data-page=2>
markets in Asia and other well-developed stock
markets in the world. This phenomenon was called
the meteor shower effect. The meteor shower effect
says that the impact of a shock in one market is
transferred to other markets.If indeed the meteor
shower effect is present, then local investors can
make more accurate decisions by monitoring the
behavior of other stock markets in Asia and the rest
of the world before investing in Vietnam.
To examine persistence of volatility in the stock
market, Goyal (2000) used various GARCH
mod-els to check the ability of stock return volatility
forecasts using the CRSP (Center for Research in
Security Prices) daily and monthly value weighted
returns. After comparing these forecasts and actual
volatility, the author showed that the GARCH
model is too smooth to capture the entire variation
in actual volatility. However, he also affirmed the
GARCH volatility frequently lies within the same
<i>confidence interval of other measures. Frimpong et </i>
<i>al. (2006) studying the Ghana Stock Exchange </i>
using the stock volatility models, showed the
GARCH(1,1) model outperformed the other
GARCH models. He found evidence of high
vola-tility persistence and long memory in the unique
‘three days a week’ Databank Stock Index (DSI)
series. In 2008, Yang examined the Dow Jones
stock index volatility over a period (2000-2008)
using the GARCH model. He showed that the
GARCH model was a good choice for volatility
forecasting in the financial market, especially for
describing heteroscedastic time series. Abdalla
(2012) aimed to model stock return volatility in the
Saudi stock market by using daily closing prices on
the general market index (Tadawul All Share Index
- TASI) over the period of January 2007 to
No-vember 2011. The paper employed different
uni-variate specifications of the GARCH model. An
application of the GARCH(1,1) model provided
strong evidence of the persistence of volatility
var-ying with time.
In Vietnam, Hien (2008) applied different GARCH
models to examine stock return volatility in the
Vietnam stock market. She showed the non-normal
distribution as a strong evidence of ARCH effects
in the Vietnam Index return series. The results
pro-vided evidence of the superiority of GARCH(1,1)
and GARCH(2,1) over the other GARCH models.
However, the excess kurtosis and skewness in the
residual series of Vietnam stock return were still
present even with the best-performing GARCH
models. Likewise, Tuyen (2011) showed that
vola-tility was prevalent in the Vietnam stock market
over the period January to October 2009. The
standard GARCH(1,0) model provided the best
description of stock return dynamics in the
Vi-etnam Stock Exchange.
On the other hand, to test the stock market
volatili-ty spillovers, Peña (1992) provided empirical
evi-dence that meteor shower effects existed between
the New York Stock Exchange and Madrid Stock
Exchange during 1988-1989 using the
ARMA-GARCH process. He also examined the effect of
trading volume on stock return where it was seen
that there was no daily effect on trading volume,
and the result showed that structure of the GARCH
model remained the same. This result contradicted
the results of Lamoureux and Lastrapes (1990). Lin
and Ito (1994) extended the previous papers (i.e.
<i>King and Wadhwani, 1990; Lin et al., 1993; </i>
<i>Hamao et al., 1990) regarding transmission of </i>
fi-nancial disturbances from one market to another.
Price volatility and volume spillovers, between
Tokyo and New York Stock Markets using a
sim-ple regression model with GARCH process, were
considered. They accounted for the interactions of
trading volume, returns, and volatility across
mar-kets. The results showed that there was an
exist-ence of shock transmission from the New York’s to
the Tokyo’s. Besides, they asserted that no
evi-dence on volume, volatility, or return spillovers for
<i>regimes except the crash period. Booth et al. </i>
(1997) investigated the international transmission
of intraday price volatility between the United
States (U.S), United Kingdom (U.K), and Japanese
future markets during 1988-1994. The results
showed that there were meteor showers effects on
the U.S and U.K futures markets, while heat wave
effects were present in the Japanese futures market.
Abidin and Zhang (2011) examined price and
vola-tility spillovers across five major Asia Pacific stock
markets (New Zealand, Hong Kong, Japan, China,
Australia) with a particular interest in the spillover
effects between Australia and China. They used
VAR model, AR/VAR model and AR/GARCH
model, respectively to estimate return spillovers.
They found strong spillover effects across the
sam-pled stock markets in the region, particularly
be-tween Australia and China, with their growing
economic ties.
</div>
<span class='text_page_counter'>(3)</span><div class='page_container' data-page=3>
other Asian markets on Vietnam stock in the period
of 2006-2009. The results showed an increase in
the level of volatility effect of the selected financial
markets on the Vietnamese stock market’s return
over time. Particularly, the level of volatility
transmissions and spillover effect of the two
devel-oped markets of Hong Kong and Japan onto
Viet-namese market were relatively higher and more
consistent than other markets. Thuan (2010)
fo-cused on the effect of the U.S stock market on
Vi-etnam’s stock market during the period of
2003-2009. He used the GARCH-ARMA model based
on daily data that was divided into four sub-groups
based on special political events between the two
countries. The study found that the U.S. stock
mar-ket, particularly the Standard & Poor's 500 Stock
Index (S&P 500 Index) had a positive and strong
significant influence on the VN index return in
recent years. However, there was no evidence of
volatility effect of the S&P 500 Index on the VN
index.
In summary, most of the above studies used a
GARCH model for specific stock returns, as well
as for general stock market index. They concluded
that a GARCH model was a good choice for
vola-tility forecasting in the financial market, especially
for describing heteroscedastic time series.
Moreo-ver, the GARCH model was also useful for
check-ing volatility spillovers to determine the effects of
other stock exchanges on a selected stock
ex-change.
<b>2 METHODS </b>
The data for VN index and HNX index that were
used in this study were the daily closing indexes
obtained from the databank of the SSC. The nine
other indexes, namely, Dow Jones Industrial
Aver-age Index (DJI) of New York Stock Exchange,
U.S; FTSE 100 Index of London Stock Exchange,
U.K; GDAX Index (GDAXI) of Frankfurt Stock
Exchange, Germany; CAC40 Index of Paris Stock
Exchange, France; Hang Seng Index (HSI) of
Hong Kong Stock Exchange, Hong Kong; Nikkei
225 Index (NIKKEI) of Tokyo Stock Exchange,
Japan; KOSPI Composite Index (KOSPI) of Korea
Stock Exchange, Korea; Straits Times Index (STI)
of Singapore Stock Exchange, Singapore; China
Shanghai Composite Index (SCI) of Shanghai
Stock Exchange, China; were obtained from Yahoo
Finance website. To ensure synchronicity in all of
the indexes, the data of open trading days from
June 2006 to June 2012 was crossed matched, and
that of closed trading days due to holidays was not
included in the analysis.
The daily stock returns were used instead of the
daily closing indexes. The daily closing prices of
stocks were converted to returns as follow:
ln ln <sub>1</sub> ln
1
<i>Pt</i>
<i>R<sub>t</sub></i> <i>P<sub>t</sub></i> <i>P<sub>t</sub></i>
<i>Pt</i>
<sub></sub>
(1)where
<i>R</i>
<i><sub>t</sub></i>is the stock return for period t;<i>P</i>
<i><sub>t</sub></i> and1
<i>t</i>
<i>P</i>
are closing price indexes on days t and t-1,respectively; and ln is the natural logarithm.
According to Asteriou and Hall (2011) the
GARCH(1,1) models can be specified as follows:
<i>t</i>
<i>t</i>
<i>t</i> <i>R</i>
<i>R</i>
<sub>0</sub>
<sub>1</sub> <sub></sub><sub>1</sub>
<sub>1</sub>
(0, 2)
<i>t</i>
<i>t</i>
2
1
2
1
2
<i><sub>t</sub></i> <i><sub>t</sub></i><i>t</i>
where 2
<i>t</i>
is the conditional variance and
<i><sub>t</sub></i>2 isthe residual at time t, and <sub>0</sub>
are intercepts, , <sub>1</sub> and are parameters
<i>Testing for the Meteor Shower Effect (Peña, 1992) </i>
The VN and HNX indexes might not only be
af-fected by Vietnam stock market, but also by other
stock markets in the world that is the presence of
the meteor shower effect. To test the presence of
the meteor shower effect on the VN index, the
conditional variance of the VN index
<i><sub>VNI</sub></i>2 wasmodeled as a function of its conditional variance in
the previous period 2
,<i>t</i> <i>j</i>
<i>VNI</i>
and the squared errorterm 2
<i>i</i>
from the other indexes from collected
countries.
The meteor shower effect of the five Asian stock
exchanges on the Ho Chi Minh Stock Exchange
(VN index) can be tested using the following
mod-els:
Singapore:
2 2 2
, , ,
<i>p</i> <i>q</i>
<i>VNI t</i> <i>VNI STI</i> <i>i STI t i</i> <i>j VNI t j</i>
<i>i</i> <i>j</i>
<sub></sub>
<sub></sub>
<sub></sub> (2)China:
2 2 2
, , ,
<i>p</i> <i>q</i>
<i>VNI t</i> <i>VNI SCI</i> <i>i SCI t i</i> <i>j VNI t j</i>
<i>i</i> <i>j</i>
<sub></sub>
<sub></sub>
<sub></sub> (3)Hong Kong:
2 2 2
, , ,
<i>p</i> <i>q</i>
<i>VNI t</i> <i>VNI HSI</i> <i>i HSI t i</i> <i>j VNI t j</i>
<i>i</i> <i>j</i>
<sub></sub>
<sub></sub>
<sub></sub> (4)Korea:
2 2 2
, , ,
<i>p</i> <i>q</i>
<i>VNI t</i> <i>VNI KOSPI</i> <i>i KOSPI t i</i> <i>j VNI t j</i>
<i>i</i> <i>j</i>
</div>
<span class='text_page_counter'>(4)</span><div class='page_container' data-page=4>
Japan:
2 2 2
, , ,
<i>p</i> <i>q</i>
<i>VNI t</i> <i>VNI NIKKEI</i> <i>i NIKKEI t i</i> <i>j VNI t j</i>
<i>i</i> <i>j</i>
<sub></sub>
<sub></sub>
<sub></sub> (6)The meteor shower effects of the stock markets
from the rest of the world on the VN index of
Vi-etnam are specified as follows:
U.S:
2 2 2
, , ,
<i>p</i> <i>q</i>
<i>VNI t</i> <i>VNI DJI</i> <i>i DJI t i</i> <i>j VNI t j</i>
<i>i</i> <i>j</i>
<sub></sub>
<sub></sub>
<sub></sub> (7)U.K:
2 2 2
, , ,
<i>p</i> <i>q</i>
<i>VNI t</i> <i>VNI FTSE</i> <i>i FTSE t i</i> <i>j VNI t j</i>
<i>i</i> <i>j</i>
<sub></sub>
<sub></sub>
<sub></sub> (8)Germany:
2 2 2
, , ,
<i>p</i> <i>q</i>
<i>VNI t</i> <i>VNI GDAXI</i> <i>i GDAXI t i</i> <i>j VNI t j</i>
<i>i</i> <i>j</i>
(9)France:
2 2 2
, 40 40, ,
<i>p</i> <i>q</i>
<i>VNI t</i> <i>VNI CAC</i> <i>i CAC</i> <i>t i</i> <i>j VNI t j</i>
<i>i</i> <i>j</i>
(10)where 2
<i>,t</i>
<i>VNI</i>
is the conditional variance of the VN
index at time t, 2
<i>, it</i>
<i>i</i>
is the squared error term ofthe ith<sub> stock market index at time t-i. Based on the </sub>
significance of parameter in each equation, the <i><sub>i</sub></i>
meteor shower effect was determined. If the joint
effects of are statistically significant, i.e.,
<i><sub>i</sub></i> 0 in each equation, then it can beconclud-ed that the meteor shower effect is present in the
VN index coming from the stock markets.
Similarly, the meteor shower effect of Asian stock
exchanges and global stock exchanges to the Ha
Noi Stock Exchange (HNX index) will also be
de-termined using the same analysis.
<b>3 RESULTS AND DISCUSSION </b>
<i>Descriptive Statistic </i>
For all stock returns, the study showed that their
distribution was not normal based on the result of
the Shapiro-Wilk test in Table 1.
The Augmented Dickey-Fuller (ADF) test was
used for checking the unit root. Table 1 presents
the results of the ADF test without trend and lags.
The results implied that the null hypothesis of a
unit root was rejected for all the stock returns at the
5% level. Consequently, all daily stock returns
were stationary.
For testing cluster volatility, this study used the
Lagrange Multiplier test (with only one lag) to test
for autoregressive conditional heteroscedasticity
effect or ARCH effect. It can be seen in Table 1
that the null hypothesis of “no ARCH effect” was
strongly rejected in case of all the concerned
variables. Thus, there were ARCH effect in the VN
and HNX stock returns series.
<b>Table 1: Testing for normality, stationary and ARCH effect in daily stock returns </b>
<b>Stock Return </b> <b>Shapiro-Wilk test for <sub>Normality </sub></b> <b>Augmented Dickey-Fuller test for <sub>Stationary </sub></b> <b>LM test for ARCH <sub>effect</sub>a </b>
VNI 0.9935** <sub>-28.925</sub>** <sub>164.902</sub>**
HNX 0.9624** <sub>-32.535</sub>** <sub> 38.026</sub>**
STI 0.9383** <sub>-39.245</sub>** <sub> 51.169</sub>**
HIS 0.9258** <sub>-40.693</sub>** <sub>217.294</sub>**
SCI 0.9569** <sub>-38.980</sub>** <sub> 26.266</sub>**
NIKKEI 0.9131** <sub>-40.096</sub>** <sub>159.604</sub>**
KOSPI 0.9265** <sub>-38.097</sub>** <sub> 61.344</sub>**
DJI 0.8977** <sub>-44.017</sub>** <sub> 50.256</sub>**
FTSE 0.9279** <sub>-40.880</sub>** <sub> 73.380</sub>**
GDAXI 0.9304** <sub>-39.200</sub>** <sub> 34.592</sub>**
CAC40 0.9346** <sub>-41.162</sub>** <sub> 49.887</sub>**
<i>NS<sub> Indicates non-significance </sub></i>
<i>**<sub> Indicates significance at a 5% level </sub></i>
<i>a<sub> Lagrange Multiplier test for ARCH(1) disturbance, or one lag. </sub></i>
<i><b>Testing for Volatility Persistence </b></i>
Actually, the GARCH(p,q) model is the
AR-MA(p,q) model of variances, where p related the
number of autoregressive lags imposed on the
equation and q relates the number of moving
aver-age lags specified. Thus, this study used partial
autocorrelation and autocorrelation to determine
autoregressive order the AR(p) and moving
aver-age order MA(q), respectively.
</div>
<span class='text_page_counter'>(5)</span><div class='page_container' data-page=5>
<b>Table 2: Autocorrelations and partial autocorrelations of VN stock return </b>
<b>LAG </b> <b>AC </b> <b>PAC </b> <b>Q </b> <b>Prob>Q </b> <b><sub>Autocorrelation </sub>[-1 0 1] </b> <b><sub>Partial Autocorrelation </sub>[-1 0 1] </b>
1 <b>0.2845 </b> <b>0.2845 </b> <b>122.03 </b> 0.0000 <b> |--- </b> <b> |--- </b>
2 <b>0.0232 </b> <b>-0.0628 </b> 122.85 0.0000 <b>| </b> <b>| </b>
3 <b>0.0240 </b> <b>0.0381 </b> 123.71 0.0000 <b>| </b> <b>| </b>
4 <b>0.1172 </b> <b>0.1103 </b> 144.46 0.0000 <b>| </b> <b>| </b>
5 <b>0.0913 </b> <b>0.0289 </b> 157.05 0.0000 <b>| </b> <b>| </b>
6 <b>0.0343 </b> <b>0.0046 </b> 158.83 0.0000 <b>| </b> <b>| </b>
7 <b>0.0121 </b> <b>0.0031 </b> 159.05 0.0000 <b>| </b> <b>| </b>
8 <b>0.0081 </b> <b>-0.0082 </b> 159.15 0.0000 <b>| </b> <b>| </b>
9 <b>-0.0037 </b> <b>-0.0179 </b> 159.17 0.0000 <b>| </b> <b>| </b>
10 <b>-0.0101 </b> <b>-0.0112 </b> 159.32 0.0000 <b>| </b> <b>| </b>
11 <b>0.0092 </b> <b>0.0136 </b> 159.45 0.0000 <b>| </b> <b>| </b>
12 <b>0.0313 </b> <b>0.0260 </b> 160.94 0.0000 <b>| </b> <b>| </b>
<b>Table 3: Autocorrelations and partial autocorrelations of HNX stock return </b>
<b>LAG </b> <b>AC </b> <b>PAC </b> <b>Q </b> <b>Prob>Q </b> <b><sub>Autocorrelation </sub>[-1 0 1] </b> <b><sub>Partial Autocorrelation </sub>[-1 0 1] </b>
1 <b>0.1719 </b> <b>0.1719 </b> <b>44.42 </b> 0.0000 <b> |--- </b> <b> |--- </b>
2 <b>0.0055 </b> <b>-0.0247 </b> 44.46 0.0000 <b>| </b> <b>| </b>
3 <b>0.0191 </b> <b>0.0230 </b> 45.01 0.0000 <b>| </b> <b>| </b>
4 <b>0.0860 </b> <b>0.0814 </b> 56.15 0.0000 <b>| </b> <b>| </b>
5 <b>0.0773 </b> <b>0.0507 </b> 65.16 0.0000 <b>| </b> <b>| </b>
6 <b>-0.0047 </b> <b>-0.0259 </b> 65.19 0.0000 <b>| </b> <b>| </b>
7 <b>-0.0237 </b> <b>-0.0198 </b> 66.04 0.0000 <b>| </b> <b>| </b>
8 <b>0.0031 </b> <b>0.0027 </b> 66.05 0.0000 <b>| </b> <b>| </b>
9 <b>0.0323 </b> <b>0.0222 </b> 67.63 0.0000 <b>| </b> <b>| </b>
10 <b>-0.0213 </b> <b>-0.0332 </b> 68.31 0.0000 <b>| </b> <b>| </b>
11 <b>-0.0056 </b> <b>0.0102 </b> 68.36 0.0000 <b>| </b> <b>| </b>
12 <b>0.0180 </b> <b>0.0202 </b> 68.85 0.0000 <b>| </b> <b>| </b>
In short, the GARCH(1,1) model was applied for
both VN and HNX return volatility models with
Generalized Error Distribution (GED) since both of
them had non-normal distribution. This was
con-sistent with the declaration of Palm (1996) that in
the empirical analysis of financial data,
GARCH(1,1) or GARCH(1,2) models had often
been found to appropriately account for conditional
heteroskedasticity. By using Maximum Likelihood
Estimation (MLE), the result of GARCH(1,1)
models was showed in Table 4.
<b>Table 4: GARCH models estimation for VN and </b>
<b>HNX Indexes </b>
<b>Coefficients </b> <b>VN index </b> <b>HNX index </b>
Mean -0.0004<sub>(0.372) </sub>NS -0.0012<sub>(0.003) </sub>**
Constant (
) 14.2E-06<sub>(0.0000) </sub>** 11.9E-06<sub>(0.0020) </sub>**ARCH term (<sub>1</sub>) 0.1996**
(0.0000) 0.2902
**
(0.0000)
GARCH term (
<sub>1</sub>) 0.7614**(0.0000)
0.7402**
(0.0000)
<i>NS<sub> Indicates non-significance </sub></i>
<i>**<sub> Indicates significance at 5% level </sub></i>
<i> P-value is noted in parentheses </i>
For the VN stock return volatility model, all
pa-rameters were greater than zero. This satisfied that
the conditional variances were strictly positive in
GARCH model. The GARCH model of the VN
<b>index return was determined as follow: </b>
<i>t</i>
<i>VNI</i>
<i>R</i> 0.0004
2 ** ** 2
1
** 2
1
14.2 06 0.1996
0.7614
<i>t</i> <i>t</i>
<i>t</i>
<i>E</i>
Both the ARCH term and GARCH term were
sig-nificant at the 5% level. These were evidences of
clustering volatility and persistence of volatility in
the VN stock return. The VN stock return volatility
was influenced by 76.14% from own previous
pe-riod volatility and by 19.96% from news of the
prior period.
</div>
<span class='text_page_counter'>(6)</span><div class='page_container' data-page=6>
<i>t</i>
<i>HNX</i>
<i>R</i>
0
.
0012
2 ** ** 2
1
** 2
1
11.9 06 0.2902
0.7402
<i>t</i> <i>t</i>
<i>t</i>
<i>E</i>
As the VN stock returns, there are evidences of
clustering volatility and persistence of volatility in
the HNX stock return since both the ARCH and
GARCH parameters are significant at the 5% level.
In comparison with the VN index, the HNX index
volatility was more sensitive to past news than the
VN index.
Besides, Table 6 showed the existence of the heat
wave effect in both Ho Chi Minh and Ha Noi Stock
Exchanges. This result indicated that Vietnam
stock market was affected by previous domestic
news. In comparison with Ho Chi Minh stock
change, the heat wave effect in Ha Noi stock
ex-change is stronger. This meant that Ha Noi stock
exchange was more sensitive to domestic news
than Ho Chi Minh stock exchange.
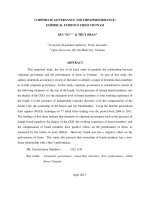
<i>Testing for the Meteor Shower Effect. </i>
In the meteor shower model, the domestic shocks
were replaced by the shocks from foreign stock
exchanges. The current period volatility in Ho Chi
Minh and Ha Noi stock exchanges was examined
under the impact of the previous period events or
shocks from the other stock markets because the
trading opening time in Ho Chi Minh and Ha Noi
Stock Exchanges was earlier than trading closing
time in the other stock exchanges (Figure 1).
The result of the meteor shower effect from Asian
stock markets to the Vietnam stock market was
presented in Table 5.
Table 5 showed the significance of all
<sub>1</sub><i><sub>i,</sub></i>parame-ters at the 5% level in volatility spillovers model of
both VN and HNX indexes. Therefore, these are
evidences of the meteor shower effects from Asian
stock markets to Vietnam stock market. The results
showed clearly that among Asian markets,
Singa-pore market has the most powerful effects on both
Vietnam stock exchanges. It is understandable
be-cause Singapore is a member of Association of
Southeast Asian Nations (ASEAN). Moreover, in
both of Ho Chi Minh and Ha Noi stock exchanges,
there are many listed Singapore companies. In
con-trast, the weakest influence on Vietnam stock
mar-ket comes from Japan.
<b>Fig. 1: Trading time of Vietnam and other stock markets </b>
<b>Table 5: The meteor shower effect of the Asian zone on the Vietnam Stock Market </b>
<b>Stock Index </b> <b>Coefficient </b> <b>Singapore </b> <b>Hong Kong </b> <b>Shanghai <sub>(China) </sub></b> <b>Korea </b> <b><sub>(Japan) </sub>Tokyo </b>
VN Index 1<i>i,</i>
0.2218**(0.0000)
0.1880**
(0.0000)
0.2013**
(0.0000)
0.1929**
(0.0000)
0.1723**
(0.0000)
<i>j</i>
,
1
0.7433**(0.0000) 0.7763
**
(0.0000) 0.7634
**
(0.0000) 0.7595
**
(0.0000) 0.8039
**
(0.0000)
HNX Index 1<i>i,</i>
0.3146**(0.0000) 0.2935
**
(0.0000) 0.2833
**
(0.0000) 0.2872
**
(0.0000) 0.2600
**
(0.0000)
<i>j</i>
,
1
0.7307**(0.0000) 0.7434
**
(0.0000) 0.7488
**
(0.0000) 0.7385
**
(0.0000) 0.7577
**
(0.0000)
</div>
<span class='text_page_counter'>(7)</span><div class='page_container' data-page=7>
<b>Table 6: Meteor shower effect of rest of the world on the Vietnam Stock Market </b>
<b>Stock Index </b> <b>Coefficient </b> <b>New York <sub>(U.S) </sub></b> <b>London <sub>(U.K) </sub></b> <b><sub>(Germany) </sub>Frankfurt </b> <b><sub>(France) </sub>Paris </b>
VN Index 1<i>i,</i>
0.2209**(0.0000) 0.2008
**
(0.0000) 0.2148
**
(0.0000) 0.2189
**
(0.0000)
<i>j</i>
,
1
0.7477**(0.0000)
0.7750**
(0.0000)
0.7562**
(0.0000)
0.7530**
(0.0000)
HNX Index 1<i>i,</i>
0.3104**(0.0000) 0.3005
**
(0.0000) 0.3065
**
(0.0000) 0.3159
**
(0.0000)
<i>j</i>
,
1
0.7225**(0.0000) 0.7396
**
(0.0000) 0.7318
**
(0.0000) 0.7282
**
(0.0000)
<i>NS<sub> Indicates non-significance </sub></i>
<i>**<sub> Indicates significance at 5% level </sub></i>
The coefficients are significant in the two <sub>1</sub><sub>,</sub><i><sub>j</sub></i>
models. This implies that persistence of Vietnam
stock market volatility exists under impacts of
events or shocks from foreign stock exchanges.
Table 6 presented the meteor shower effects from
the rest of the world as major international stock
markets. Based on the significance of the
parame-ters <sub>1</sub><i><sub>i,</sub></i>, both Ho Chi Minh and Ha Noi stock
ex-changes were influenced by major stock markets of
the rest of the world (New York, London,
Frank-furt and Paris). Interestingly, the influence level of
international major stock markets on Vietnam
stock market almost has the same magnitude. On
the other hand, the stock markets from the rest of
the world are more important than the Asian stock
markets since their effects on Vietnam stock
mar-ket are stronger than Asian stock marmar-ket’s effects.
Moreover, the results also showed that the meteor
shower effect from international stock exchanges
to Ha Noi stock exchange was stronger than Ho
Chi Minh’s.
<b>4 CONCLUSIONS </b>
Like most stock markets in the world, Vietnam
stock market exhibits basic financial market
char-acteristics such as stock market prices being
inte-grated of order one series, the existence of
cluster-ing volatility and persistence of volatility in stock
returns, and non-normal distribution in stock
re-turn.
There was evidence of persistence of volatility in
Ho Chi Minh stock exchange, as well as Ha Noi
one. Therefore, when risk-managers and
policy-makers build stock market volatility forecast
mod-els, they must pay attention to the persistence of
volatility of VN and HNX indexes. For investors,
they anticipate the shock effects not only in the
short run, but also in the long run.
The results of the study asserted that Vietnam stock
market is still young and volatile since it is affected
by both domestic news and shocks from global
stock markets. Based on the results of the meteor
shower effects, the stock markets from the rest of
the world have more strongly affected the Vietnam
stock market than those from Asian stock markets.
On the other hand, the study also showed that
among the Asian markets, Singapore exhibited the
strongest meteor shower effect to Vietnam.
There-fore, investors and risk managers should monitor
news and shocks from both the Asian and global
stock markets. Between the Asian and global
mar-kets, investors should pay more attention to the
later stock markets since the meteor shower effects
were found to be larger from these markets.
This study examined the volatility of Vietnam
stock markets during the more volatile period
be-tween 2006 and 2012. It is expected that the
behav-ior of Vietnam stock markets may show different
patterns of volatility during non-crisis periods
which is characterized by more stability. Despite
the “newness” of the future contracts and
transac-tions in the future financial markets in Vietnam, it
has already gained popularity. Therefore, volatility
assessment in futures market was an interesting off
shoot of the present study.
<b>REFERENCES </b>
Abdalla, S.Z.S., (2012). “Modelling Stock Returns
Vola-tility: Empirical Evidence from Saudi Stock
Ex-change”. International Research Journal of Finance
and Economics ISSN 1450-2887 Issue 85 (2012).
Abidin, S., Zhang, C., (2011). “Price and Volatility
Spill-over Effects in Selected Asia Pacific Stock Markets”.
International Review of Business Research Papers
Vol. 7. No. 5. September 2011. Pp. 83-97.
Asteriou, D., Hall, S. G., 2011. Applied Econometrics,
Palgrave Macmillan.
</div>
<span class='text_page_counter'>(8)</span><div class='page_container' data-page=8>
Index Futures Markets: Meteor Showers or Heat
Waves?”. Management Science 43(11), 1564-1576.
Frimpong, J.M., Oteng-Abayie, E.F., (2006). “Modelling
and Forecasting Volatility of Returns on the Ghana
Stock Exchange”. MPRA Paper No. 593, posted 07.
November 2007 / 01:08. Online at
Goyal, A., (2000). “Predictability of Stock Return
Vola-tility from GARCH Models”. Anderson Graduate
School of Management, UCLA, 110 Westwood
Pla-za, Box 951481, Los Angeles, CA 90095-1481.
Hien, M.T.T., (2008). “Modelling and Forecasting
Vola-tility by Garch-Type Models: The Case of Vietnam
Stock Exchange”. MA Dissertation of Finance and
Investment
(edisserta-tions.nottingham.ac.uk/2017/1/08MAlixhm7.pdf).
Palm, F.C., Maddala, G.S., Rao, C.R., (1996). “GARCH
Models of Volatility”. Handbook of Statistics, Vol.
14, Elsevier Science B. V.
Peña, J.I., (1992). “On Meteor Showers in Stock
Mar-kets: New York vs Madrid”. Investigaciones
Eco-nomicas, Fundación SEPI, vol. 16(2), pages 225-234.
Phu, C.N.V., (2009). “Volatility Transmissions and
Spillover Effects: An Empirical Study of Vietnam’s
Stock Market and Other Asian Stock Markets”.
Mas-ter thesis of Business, Auckland University of
Tech-nology.
Thuan, L.T., (2010). “An Analysis of the Effect of U.S.
Stock Market to Vietnam Stock Market: The Case of
S&P 500 and Dow Jones Indices to VN-Index”.
Chung Yuan Christian University, Taiwan.
Un-published Paper.
</div>
<!--links-->
![kwon et al - 2014 - the effect of mandatory audit firm rotation on audit quality and audit fees empirical - evidence from the korean audit market [mafr]](https://media.store123doc.com/images/document/2015_01/06/medium_har1420548188.jpg)