- Trang chủ >>
- THPT Quốc Gia >>
- Ngoại Ngữ
CORPORATE SOCIAL RESPONSIBILITIES AND CORPORATE FINANCIAL PERFORMANCE IN VIETNAM CONTEXT
Bạn đang xem bản rút gọn của tài liệu. Xem và tải ngay bản đầy đủ của tài liệu tại đây (441.26 KB, 12 trang )
<span class='text_page_counter'>(1)</span><div class='page_container' data-page=1>
<b>CORPORATE SOCIAL RESPONSIBILITIES AND CORPORATE </b>
<b>FINANCIAL PERFORMANCE IN VIETNAM CONTEXT </b>
HO THI VAN ANH , PHAM TU ANH
<i>Industrial University of Ho Chi Minh City </i>
<i>, </i>
<b>Abstract. The paper aims to investigate the effects between corporate social responsibilities (CSR) and </b>
corporate financial performance (CFP) in Vietnam context. The author employs context analysis and
multiple regressions in Stata software to examine two-ways positive relationship between CSR and CFP.
The research is contingent on the database created by Tien, HV & Van Anh, HT (2017) that is revised by
an increase in the number of observation variables for a period from 2012 to 2017 for 130 companies via
their annual report. Preliminary result indicates that there is a signicantly statistical relationship between
CSR and CFP.
<b>Key worlds. Corporate social responsibilities, corporate financial performance, Vietnam </b>
<b>1 </b>
<b>INTRODUCTION </b>
The relationship between CSR and CFP has been a growing concern among academics,
organizations and nations all over the world. This is partially due to the importance of CSR to
stakeholders. In a competitive and dynamic market, not only do entities focus on maximizing the assets of
shareholders but also deal with social issues created by companies themselves throughout their business
operation.
Many studies indicate that companies should take part in activities in relation to social responsibility
to deal with them and CSR is one of instruments having a good effect to financial efficiency ([45]Young
& Marais, 2012; [5] Aras & Crowther, 2007; [6] Arora & Dharwadkar, 2011). However, various studies
show contrary results and conclusions in terms of the relationship between CSR and CFP ([22] Jones,
2005; [14] Dhaliwal et.al, 2011; [31] Nelling & Webb, 2009; [11] Cornell & Shapiro, 1987). The question
is stated again whether there is a two-ways relationship between CSR and CFP in Vietnam context or not.
CSR has been investigated in many research, however, each study only examine a particular aspect
of CSR and consider it as one of the variables. This study uses similar research method in the study of
[41] Tien, HV & Van Anh, HT (2017) to measure CSR based on the update and adding research database
and then investigate two-ways relationship between CSR and CFP.
The studies is presented in 3 main parts, including literature review and hypothesis, research
methodology, designing the research, results and discussions and underlying values of management.
<b>2. </b>
<b>LITERATURE REVIEW</b>
Many research results indicate a positive relationship between CSR and CFP ([10] Cochran &
Wood, 1984; [35] Ruf et.al, 2001; [44] Van de Laan et.al, 2008), wherease other research show a negative
relationship between them ([29] Moore, 2001; [31] Nelling & Webb, 2009) or some authors believe that
there is no relationship between these variables ([1] Abbott & Monse, 1979; [26] Lioui & Sharma, 2012).
[31] Nelling & Webb (2009) believe that there is a mix relationship between CSR and CFP. Based on
these results, it seems to be that there is no clear relationship between CSR and CFP, hence, the need of
checking whether a relationship between CSR and CFP, especially the two-ways relationship, exists or
not in Vietnam context is extremely pivotal.
</div>
<span class='text_page_counter'>(2)</span><div class='page_container' data-page=2>
responsibilities they are likely to lost customers’ and employees’ trust or may face to trouble in economic
stagnation or difficulties when profits and value of trademarks decrease significantly or when customers
and investors leave companies, etc. As a result, if companies want to achieve better CFP they should
carry out better CSR ([46] Waddock & Graves, 1997; [44] Tsoutsoura, 2004; [22] Jones, 2005). This
conclusion has been supported bymany researchers all over the world ([35] Ruf et.al, 2001; [47] Wu,
2006; [29] Moneva et.al, 2007; Odemilin et.al, 2010).
In contrast to the results showing the positive relationship between CSR and CFP, other studies
show negative relationship between these factors and claim that engaging in social responsibilities
increase the costs in business, hence, it leads to a decrease in profits and a constrasting shareholders’
expectation (Moore, 2001; Bragdon & Marlin, 1972; Aupperle et.al, 1985; Moore, 2001).
In addition to these two conflicting views, many studies do not find any causal relationship between
CSR and CFP. The conclusion of these authors is that additional costs from participating in CSR are
offset by the benefits of these activities (Cornell & Shapiro, 1987; Becchetti & Ciciretti, 2006;
D'Arcimoles & Trebucq, 2002; Nelling & Webb, 2009).
Even though CSR has different factors, this study only focuses on four main elements in accordance
with stakeholders, namely responsibilities with environment, with community, with employees and with
products. These factors are similar in a study of Tien, HV & Van Anh, HT (2017).
<i>+ Responsibilities with environment (CSR_env): Many studies proved that fostering responsibilities </i>
with environment, for example, save energy, using eco-friendly material, using recycled products,
maintaining and conserving natural resources, prevention pollution, etc., are capable of making CFP
better (Pahuja, 2009; Setyorini & Ishak, 2012). Samy, Odemilin & Bampton (2009), Menassa (2010)
found weak relationships between responsibility with environment and CFP. Additionally, Magness
(2006) & Dragomir (2009) found no relationship between environmental responsibility and CFP.
<i>+ Responsibilities with community (CSR_com): Some researchers find a significantly statistical </i>
relationship between social progress and CFP. Joshi & Gao (2009), Lii (2011) investigated the effects of
community activities and believe that community activities facilitate the company create good
relationships with stakeholders. As a result, companies not only build a good brand image at a relatively
lower cost than the cost of advertising activities and of public relations activities but also contribute to
reduce risk when the company faces economic difficulties or unexpected events occured in the business
activities.
<i>+ Responsibilities with employees (CSR_emp): It relates to financial efficiency and organizational </i>
effectiveness (Menassa, 2010). Guadamillas-Go'mez & Manzanares (2011) show clear evidence that
responsibility with employees is a moral aspect of the company to develop people, improve employee
loyalty, retain good employees and attract new employees, etc. All of these result in a better CFP of
companies. On the contrary, Crisóstomo, Freir & Vasconcellos (2011) found a negative impact of
responsibilities with employees and CFP.
<i>+ Responsibilities with product (CSR_prod): It has some impacts on CFP. Consumer protection is </i>
carried out by providing the necessary information about the ingredients used to manufacture production,
better quality and good price that are higher than customers’ expectation. It may lead to an increase in
CFP of company (Skudiene & Auruskeviciene, 2010).
Based on these information, the authors present two hypothesis:
Hypothesis 1: Taking part in CSR of companies has a positive impact on CFP
Hypothesis 2: Good CFP has a positive impact on companies’ level of taking part in CSR.
<b>3. </b> <b>RESEARCH METHODOLOGY </b>
The study bases on the database of Tien, HV & Van Anh, HT (2017) with 100 companies, adding
with database from 2012 to 2017 with 34 companies. Particularly, this study analyses the sciencetific
context in annual report from 134 companies in Ho Chi Minh Stock Exchange and Ha Noi Stock
Exchange and regression model based on the research of Guthrie et al (2004) and Schneider and Konz
(2006) to check two-ways relationship between CSR and CFP.
</div>
<span class='text_page_counter'>(3)</span><div class='page_container' data-page=3>
et al., 2010; Dragomir, 2010; Saleh et al., 2011; Zhang and Gu, 2012; Ghelli, 2013; Li et al., 2013,
Karagiorgos , 2010; Hussainey & Walker, 2009) and FR (Brammer et al., 2006; Murray et al., 2006;
Moneva and Ortas, 2008; Bhagat and Bolton, 2008; Nelling and Webb, 2009; Hussainey and Walker,
2009; Karagoiorgos, 2010).
<i>CSR measure (CSR): The method that is used is similar to the study of Tien, HV & Van Anh, HT </i>
(2017). Based on the updating information via annual financial statements, context analysis is utilized to
extract information regrading social responsibility activities. Being in accordance with the study of
Branco and Rodrigues (2006); Haniffa and Cooke (2005), the study uses the following formula:
<sub> </sub> = ∑
(1)
= ∑
Notes:
CSRij: total CSR and CSR element j (0 ≤ CSRj ≤ 1)
csrij = 1 if the information in the question number i for company number j is announced and vice
versa, csrij = 0
nij: the number of question with number I for company number j (n = 1,..., k).
i: the number of aspects in CSR expectation for a particular company
<i>The control variables </i>
<i>+ The size of company (Size): Crisóstomo et al. (2011) indicates that size is an important control </i>
variable as smaller size companies are limited in their financial capacity to maintain social responsibility
activities compared to those having larger financial budget to do it. In this study, logarit of total assets is
used to measure firm size (Hossain & Hammami, 2009; Dragomir, 2009).
<i>+ Financial leverage (Leverage): Companies with low debt levels and good financial performance </i>
invest more money in social responsibility activities than those with high debt levels. Similarly, Aras and
Aybars (2010) used DTA (total debts/total assets) as a representative variable to control the company's
risk.
<i>+ Industry (Industry): According to Dierkes and Preston (1997) some industries may have strong </i>
influences on the relationship between CSR and CFP. Therefore, this study uses industry as a control
variable that was applied by Patten (1991), Roberts (1992), Hackston and Milne (1996), Bayoud et al.
(2012). The industry variable in this study is defined as the financial and non-financial industry. If the
company is non-financial, it has a value of 1 and vice versa 0.
This study applies research models of Tien, HV and Van Anh, HT (2017), Trang and Yekini (2014).
The research model is expected as follows:
<b> </b>
<sub> </sub><b> </b>
<sub> </sub> <sub> </sub> <sub> </sub> <sub> </sub> <sub> </sub> <sub> </sub> <sub> </sub>
Notes:
β0: coefficient
Yij: corporate financial performance of company i with time j (ROA, TBQ, FR)
ROA = profit after tax/total assets
Tobin’q (TBQ) = (short-term debts + long-term debts + capital market)/book value of total assets
Financial risk (FR) = (Standard deviation of daily rate of return for 250 sessions in a year) *√
CSR: total corporate social responsibilities
</div>
<span class='text_page_counter'>(4)</span><div class='page_container' data-page=4>
Sizeij: size of company i with time j (Log [total assets])
Levij: financial leverage with company i in time j (DTA = total debts/total assets)
Indusij: industry i with time j (is classified in accordance with Ho Chi Minh Stock Exchange –
HOSE)
α: error
<b>4 RESULT AND DISCUSSION </b>
<b>4.1. Descriptive statistics</b>
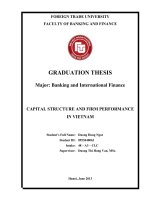
Table 1 presents statistical results describing variables in the research model. For the financial
efficiency group, TBQ has the highest average value (1.109401), which is a good signal. The market
value of companies is high that means they are developing well and have strong financial budget to
participate in CSR activities. The average price volatility or company risk (FR) is 36% and FR max is
88% which indicates that market value of companies in sample are relatively sensitive to internal and
external factors. The average value of ROA at 8% is relatively good and effective.
<i>Table 1: Descriptive statistics for variables in research model </i>
<b>Obs </b> <b>Mean </b> <b>Std. Dev </b> <b>Min </b> <b>Max </b>
<b>ROA </b> 399 .0792567 .0872649 -.361 .784
<b>TBQ </b> 399 1.109401 .9655773 .002 8.748
<b>FR </b> 399 .3652231 .1149795 .073 .875
<b>csr_env </b> 399 .4802632 .2060117 0 1
<b>csr_emp </b> 399 .7525514 .1410503 0 1
<b>csr_com </b> 399 .5769424 .1703372 0 1
<b>csr_prod </b> 399 .485589 .2275312 0 1
<b>CSR </b> 399 .5757895 .1241429 0 1
<b>Size </b> 399 28.98834 1.79988 25.158 34.723
<b>Lev </b> 399 .4870526 .2299138 .015 .963
<b>Indus </b> 399 .839599 .3674383 0 1
<i>(Source: Authors calculate in Stata software) </i>
For the social responsibility variable group, the average value of corporate social responsibilities
with employees and corporate social responsibilities with community are two of factors being disclosed
most in annual financial statements. The two factors being disclosed least in annual financial statements
are corporate social responsibilities with environment and corporate social responsibilities with products.
It is relatively common because
(i) The disclosure of this information is voluntary and there is no framework for disclosing these
information
(ii) There are some large-scale companies complying with GRI guidelines
(iii) Traditional financial information plays an important role for users of information so far.
For controlling variables, the size of companies in the research sample is relatively large (mean ≈
29), financial leverage is relatively high (mean ≈ 49%), however, there are some companies that do not
have financial leverage. In sample of the study, the number of non-financial companies is higher than the
financial and real estate companies.
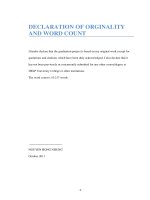
<b>4.2. Correlation analysis </b>
</div>
<span class='text_page_counter'>(5)</span><div class='page_container' data-page=5>
The correlation between the three control variables with CSR shows that Lev has a negative
<i>correlation with CSR element. Additionally, the result indicates that size has a negative correlation with </i>
CSR_env, CSR_empl and a positive correlation with CSR_prod, CSR_com. It means that the larger the
company, the more investment is made in community activities to build a good image of the company
with the local community and other stakeholders. In contrast, Indus is positively correlated with
CSR_env, CSR_empl and is negative correlation with CSR_prod, CSR_com. Companies in the industry
group that may create pollution may be likely to invest more in environmental protection activities to
reduce costs and increase CFP.
<i>Table 2: Correlation coefficient between total CSR, CSR elements and CFP</i>
<b>ROA </b> <b>TBQ </b> <b>FR </b> <b>CRS </b>
<b>ENV </b>
<b>CSR </b>
<b>EMPLOY </b>
<b>CSR </b>
<b>COMMU </b>
<b>CSR </b>
<b>PROD </b>
<b>CSR</b>
<b>Size </b> <b>Lev </b> <b>Indus </b>
<b>ROA </b> <b>1.0000 </b>
<b>TBQ </b> 0.5792 <b>1.0000 </b>
<b>FR </b> -0.1628 -0.1693 <b>1.0000 </b>
<b>CRSENV</b> 0.1913 0.2303 -0.1000 <b>1.0000 </b>
<b>CSREMP</b> 0.0292 0.0478 0.0139 0.4130 <b>1.0000 </b>
<b>CSRCOM</b> 0.0658 0.0935 0.0745 0.0854 0.0831 <b>1.0000 </b>
<b>CSRPROD </b> 0.2077 0.2671 0.0568 0.3524 0.1041 0.2637 <b>1.0000 </b>
<b>CSR</b> 0.1957 0.2701 -0.0898 0.7355 0.5338 0.5306 <b>0.7322 </b> <b>1.0000 </b>
<b>Size </b> 0.1441 0.0199 -0.2805 -0.1190 -0.1235 0.2433 0.0862 <b>0.0348 </b> <b>1.0000 </b>
<b>Lev </b> -0.4643 -0.2937 0.0111 -0.2046 -0.0561 -0.0014 -0.1548 -0.1801 0.4801 <b>1.0000 </b>
<b>Indus </b> 0.2263 0.1624 0.0856 0.1904 0.0811 -0.1074 0.0925 0.1107 -0.4463 -0.3157 <b>1.0000 </b>
(Source: Authors calculate in Stata software)
<b>4.3. Two-ways relationship between CSR – CFP </b>
<i>4.3.1. Analysis effects of CSR on CFP </i>
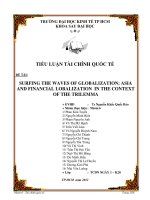
<b>The relationship between total CSR - CFP </b>
Table 3 results show that when accepting hypothesis H1 there is a relationship between CSR - CFP
in the context of Vietnam with 1% significance level. Additionally, a positive relationship between total
CSR – TBQ and CSR - ROA at significant levels of 1% and 5% are found, which are similar to the
findings in previous studies. (Cochran & Wood, 1984; Waddock & Grave, 1997; Bewley & Li, 2000;
Beurden & Gossling, 2008; Chen & Wang, 2011; Sun, 2012). However, there is no evidence showing that
there is a relationship between total CSR – FR, which means that (i) the majority of domestic and foreign
investors’ psychology in Vietnam pay more attention in financial indicators than non-financial indicators
(for example, indicators for corporate social responsibilities), (ii) there is no guidance for companies to
disclosure information in relation to corporate social responsibilities and the disclosure these information
is voluntary and (iii) although companies, investors and various stakeholders have started to pay more
attention in CSR they have not fully been aware of CSR. Furthermore, a reliable CSR index is not
established as in developed countries to announce to investors and stakeholders as a basis for evaluating
each company.
</div>
<span class='text_page_counter'>(6)</span><div class='page_container' data-page=6>
<i>Table 3: Regression result regarding the relationship between total CSR- CFP</i>
<b>ROA </b> <b>TBQ </b> <b>FR </b>
CSR tổng <b>.0643** </b>
(2.03)
<b>1.4557*** </b>
(3.96)
-.0631
(-1.28)
Size <b>.0066** </b>
(2.53)
<b>.1257*** </b>
(4.14)
<b>-.0235*** </b>
(-6.18)
Lev <b>-.1796*** </b>
(-9.20)
<b>-1.3752*** </b>
(-6.08)
<b>.0874*** </b>
(3.14)
Indus <b>.0303** </b>
(2.58)
<b>.3755*** </b>
(2.75)
-.0070
(-0.42)
Obs 399 399 399
R-squared 0.2468 0.1746 0.1079
F 32.28 20.84 12.46
P_value <b>0.0000*** </b> <b>0.0000*** </b> <b>0.0000*** </b>
F test 0.0601 0.7436 0.0183
<i>(Source: Authors calculate in Stata software). </i>
<i>(*) 10% significant level, (**) 5% significant level và (***) 1% significant level </i>
Based on the aforementioned analysis and the result in the research of Tien, HV & Van Anh, HT
(2017), the result indicates that taking part in CSR do not result in an increase in cost or a decrease in
profits. More importantly, it becomes a useful instrument that is beneficial to companies, for example,
increasing the profit and market value of stocks, maximizing the value of shareholders' assets and
improving the relationship between shareholders and managers.
<b>The relationship between CSR elements - CFP </b>
Table 4 provides evidence regarding the existence of the relationship between CSR elements - CFP
with a 1% significance level by accepting H1 hypothesis. The result between CSR elements – CFP shows
a mixed result. Particularly, even though activities in relation to community are one of four aspects
disclosuring most in annual financial statements we found no relationship between CSR_com – CFP. This
result contradicts with the findings in some previous studies (Branco and Rodrigues, 2007; Joshi and Gao,
2009, Lii, 2011; Nejati and Ghasemi, 2012; David, 2012; Tien,HV & Van Anh,HT, 2017).
There is a positive relationship between CSR_env – ROA and TBQ at the significance level of 5%
and 10%, respectively and a negative relationship between CSR_env - FR at 10% significance level.
These results are in accordance with some previous studies (Deegan, 2002; Kuasirikun & Scherer, 2004;
Pahuja, 2009; Setyorini & Ishak, 2012). It means that engaging in corporate social responsibilities (for
example, using eco-friendly materials, using effectively natural resources, recycled products, treatment of
wastes and hazardous air pollutants, protecting the surrounding environment, planting trees, etc.) not only
provide positive effects on CFP but also contributes to reduce risks and enhance the brand for companies.
Similarly, CSR_prod - ROA and CSR_prod – TBQ show positive relationships with 1% and 5%
significance levels, being consistent with previous research (Carrol, 1991; Galbreath, 2009; Rashid, 2010;
Rashid, 2010; Menassa, 2010; Green and Peloza, 2011). In short, participating in CSR with environment
and products helps the company to reduce costs and increase profits.
</div>
<span class='text_page_counter'>(7)</span><div class='page_container' data-page=7>
<i>Table 4: Regression result regarding the relationship between CSR elements – CFP </i>
<b>ROA </b> <b>TBQ </b> <b>FR </b>
CSR_env <b>.0421* </b>
(1.92)
<b>.5870** </b>
(2.30)
<b>-.0781** </b>
(-2.46)
CSR_emp <b>.0636** </b>
(2.13)
-.1315
(-0.38)
.0206
(0.38)
CSR_com .0145
(0.61)
.0258
(0.09)
-.0050
(-0.14)
CSR_prod <b>.0327* </b>
(1.75)
<b>.6078*** </b>
(2.79)
.0167
(0.60)
Size <b>.0053** </b>
(1.97)
<b>.1225*** </b>
(3.88)
<b>-.0242*** </b>
(-6.21)
Lev <b>.1716*** </b>
(8.76)
<b>1.3260*** </b>
(5.82)
<b>.0866*** </b>
(3.09)
Indus <b>.0278** </b>
(2.36)
<b>.3406** </b>
(2.48)
-.0046
(-0.27)
Obs 399 399 399
R-squared 0.2623 0.1850 0.1199
F 19.86 12.68 7.79
P_value <b>0.0000*** </b> <b>0.0000*** </b> <b>0.0000*** </b>
F test 0.2212 0.7002 0.0273
(Source: Authors calculate in Stata software)
(*) 10% significant level, (**) 5% significant level và (***) 1% significant level
<i>4.3.2. Analyze the effects of CFP on CSR </i>
<i>Table 5: Regression result regarding the relationship between CFP – CSR </i>
<b>CSR </b>
ROA .0997
(1.19)
TBQ <b>.0201*** </b>
(2.84)
FR -.0362
(-0.71)
Size <b>.0133*** </b>
(3.34)
Lev <b>-.0779** </b>
(-2.55)
Indus <b>.0365** </b>
(2.15)
R-squared 0.0959
F 9.72
P_value <b>0.0000*** </b>
F test 0.0000
<i>(Source: Authors calculate in Stata software). </i>
<i>(*) 10% significant level, (**) 5% significant level và (***) 1% significant level </i>
</div>
<span class='text_page_counter'>(8)</span><div class='page_container' data-page=8>
which means that most of the companies is growing well and have good financial budgets to participate in
CSR activities.
For control variables, they are influential on CSR in many aspects. Most companies in the sample are
non-financial and large-scale companies which are extremely interested in CSR because these activities
not only help them increase CFP but also maintain and enhance their brand. However, the effects are
good or not depending on the company's current financial leverage.
<b>5. CONCLUSION</b>
This study examines two-way relationships between CSR and CFP. The results provided statistical
evidence regarding two-way relationship between CSR – CFP, however, we do not find any evidence in
terms of the relationship between CSR_com - CFP when considering each independent variable. This is
opposed to what was found in study of Tien, HV and Van Anh, HT (2017). The findings in this study
prove the existence of the relationship between CSR and CFP in Vietnam context. More importantly,
compared to research of Tien, HV and Van Anh, HT (2017) which only finds the one-way relationship
between CSR and CFP, this study finds the two-way relationship between them. The results have
practical implications for managers, investors and the community regarding the effects of CSR on CFP.
Additionally, the results indicate that companies should proactively publish more information in relation
to CSR in the annual financial statements with other financial information to raise the awareness of
stakeholders about companies’ activities. Furthermore, government should issue official guidances to
facilitate companies disclosuring information in relation to CSR on financial statements and make it
become mandatory requirement instead of voluntary requirements for all companies.
<b>REFERENCES </b>
[1] Abbott, W. F. and Monsen, R. J. 1979. On the measurement of corporate social responsibility: self-reported
disclosures as a method of measuring corporate social involvement. The Academy of Management Journal,
vol.22, no.3, 501-15.
[2] Aguilera, R.V., Rupp, D.E., Williams, C.A. and Ganapathi, J, 2007. Putting the S back in corporate social
<i>responsibility: a multi-level theory of social change in organizations. Academy of Management Review, Vol. 32 </i>
No. 3, pp. 836-863.
[3] Aliyu Baba Usman Noor Afza Amran, 2015. Corporate social responsibility practice and corporate financial
<i>performance: evidence from Nigeria. Social Responsibility Journal, Vol. 11, No. 4 pp 1-24. </i>
[4] Aras, G, Aybars, A and Cutlu, O, 2010. Managing corporate performance. Invstigating the correlation between
<i>corporate social responsibility and financial performance in emerging markets. International Journal of </i>
<i>productivity and performance management, vol 50, no 3, pp 229-254. </i>
[5] Aras, G. and Crowther, D. 2007. Is the global economy sustainable?. London: The Geopolitics of the City,
Forum Press, pp 165-94.
[6] Arora, P., & Dharwadkar, R, 2011. Corporate Governance and Corporate Social Responsibility (CSR): The
<i>Moderating Roles of Attainment Discrepancy and Organization Slack. Corporate Governance: An </i>
<i>International Review, 19(2), 136-152. </i>
</div>
<span class='text_page_counter'>(9)</span><div class='page_container' data-page=9>
[8] Bayoud, NS, Kavanagh, M and Slaughter, G, 2012. An empirical study of the relationship between CSR
disclosure and organizational performance: evidence from Libya, International Journal of Management and
Marketing Research, vol 5, no 3, pp 69-82.
[9] Becchetti, L. and Ciciretti, R. 2006. Corporate social responsibility and stock market performrance. CEIS Tor
Vergata – Research Paper Series, pp. 27-79.
[10] Bhagat, S and Bolton, B., 2008. Corporate governance and firm performance. Journal of Corporate
Finance vol 14, pp 257-273.
[11] Bragdon, JH, and Marlin, JT. 1972. Is pollution profitable? Risk Management, vol 19, no 4, pp 9-18. Business
and Society Review, 1972. So far so good, (2): 88.
[12] Branco, C and Rodrigues, L. 2007. Positioning stakeholder theory within the debate on corporate social
responsibility.
<i>[13] Carrol, A.B. 1999. Corporate social responsibility: evolution of a definitional construct. Business and Society, </i>
Vol. 38 No. 3, pp. 268-295.
[14] Cheung, YL, Tan, W, Ahn, H-J and Zhang, Z, 2010. Does corporate social responsibility matter in asian
<i>emerging markets?. Journal of Business Ethics, vol. 92, no. 3, pp 401-413. </i>
[15] Cochran, R. and Wood, R. 1984. Corporate social responsibility and financial performance. Academy of
Management Journal, vol 27, no (1), pp 42-56.
[16] Cornell, B and Shapiro, A.C. 1987. Corporate Stakeholders and Corporate Finance. Financial Management,
vol 16, pp 5-14.
[17] Crisóstomo, V.L., Freire, F.D.S. and Vasconcellos, F.C.De, 2011. Corporate social responsibility, firm value
<i>and financial performance in Brazil. Social Responsibility Journal , Vol. 7 No. 2, pp. 295-309. </i>
[18] D’Arcimoles, C.H. and Trebucq, S. 2002. The corporate social performance – financial performance link:
evidence from France. Working paper series.
[19] David, O, 2012. An assessment of the impact of corporate social responsibility on Nigerian society: the
<i>examples of banking and communication industries. Universal Journal of Marketing and Business Research, </i>
Vol. 1 No. 1, pp. 17-43.
[20] Dhaliwal, D., LI, O., Tsang, A. and Yang, Y, 2011. Voluntary nonfinancial disclosure and the cost of equity
<i>capital: the initiation of corporate social responsibility reporting. The Accounting Review, 86 (1), 59-100. </i>
[21] Dierkes, M and Preston, LE 1977. Corporate social accounting reporting for the physical environment: a
critical review and implementation proposal. Accounting, Organizations and Society, vol 2, no 1, pp 3 – 22.
[22] Dragomir, V.D. 2009. Environmentally sensitive disclosures and financial performance in a European setting.
Journal of Accounting & Organizational Change, Vol 6, No 3, pp 359-388.
<i>[23] Galbreath, J, 2009. Building corporate social responsibility into strategy. European Business Review, Vol. 21 </i>
No. 2, pp. 109-127.
<i>[24] Ghelli, C, 2013. Corporater social responsibility and financial performance: an empirical evidence. MSc in </i>
Economics & Business Administration, Copenhagen Business school. CBS.
</div>
<span class='text_page_counter'>(10)</span><div class='page_container' data-page=10>
[26] Guadamillas-Gómez, F. and Donate-Manzanares, M.J, 2011. Ethics and corporate social responsibility
<i>integrated into knowledge management and innovation technology: a case study. Journal of Management </i>
<i>Development , Vol. 30 No. 6, pp. 569-581. </i>
[27] Guthrie, J., Petty, R., Yongvanich, K. and Ricceri, F. 2004. Using content analysis as a Research Method to
Inquire into Intellectual Capital Reporting. Journal of Intellectual Capital, 5 (2), 282-293.
[28] Hackston, D and Milen, MJ. 1996. Some determinants of social and environmental disclosure in New Zealand
companies. Accounting, Auditing & Accountability Journal, vol 9, no 1, pp 77-108.
[29] Helslin, T. and Roach, A.P.P, 2008. Environmental issues and corporate social responsibility in Nigeria Niger
<i>Delta region: the need for a pragmatic approach. Journal of Social Science and Public Policy , Vol. 4, pp. 1-21. </i>
[30] Hussainey, K., and Walker, M. 2009. The effects of voluntary disclosure and dividend propensity on prices
leading earnings. Accounting and Business Research, Vol. 39 No. 1, pp. 37–55.
doi:10.1080/00014788.2009.9663348.
<i>[31] Jitaree, W .2015. PhD thesis “Corporate social responsibility disclosure and financial performance: evidence </i>
<i>from Thailand”. </i>
[32] Jones, M. 2005. The traditional corporation, corporate social responsibility and the outsourcing debate. The
Journal of American Academy, Vol. 2, pp. 91-7.
[33] Joshi, P.L. and Gao, S.S. 2009. Multinational corporations’ corporate social and environmental disclosures on
web sites. International Journal of Commerce and Management , Vol. 19 No. 1, pp. 27-44.
[34] Kapopoulos, P. and Lazaretou, S, 2007. Corporate ownership structure and firm performance: evidence from
<i>Greek firm. Corporate Governance, 15 (2), 144 58. </i>
[35] Karagiorgos, T 2010. Corporate social responsibility and financial performance: an empirical analysis on
Greek companies. European Research Studies, vol 13, no 4, pp 85 – 109.
[36] Kuasirikun, N., and Scherer, M. 2004. Corporate social accounting disclosure in Thailand. Accounting,
Auditing & Accountability Journal, Vol. 17, No. 4, pp. 629–660.
[37] Li, Q, Luo, W, Wang, Y and Wu, L, 2013. Firm performance, corporate ownership, and corporate social
<i>responsibility disclosure in China. Business Ethics: A European review, vol 22, no 2, pp 159-173. </i>
[38] Lii, Y, 2011. The effect of corporate social responsibility initiatives on consumers identification with
<i>companies. Asian Journal of Business and Management , Vol. 5 No. 5, pp. 1642-1649. </i>
[39] Lioui, A. and Sharma, Z, 2012. Environmental corporate social responsibility and financial performance:
<i>Disentangling direct and indirect effects. Ecological Economics, Vol. 78, 100–111. </i>
[40] Magness, V. 2006. Strategic posture, financial performance and environmental disclosure: an empirical test of
legitimacy theory. Accounting, Auditing & Accountability Journal, Vol. 19 No. 4, pp. 540-563.
[41] Menassa, E, 2010. Corporate social responsibility: an exploratory study of the quality and extent of social
<i>disclosures by Lebanese commercial banks. Journal of Applied Accounting Research, Vol. 11 No. 1, pp. 4-23. </i>
[42] Moneve, JM, Rivera-Lirio, JM. and Munoz-Torres, MJ. 2007. The corporate stakeholder commitment and
social and financial performance. Industrial Management and Data Systems, 107 (1), 84-102
</div>
<span class='text_page_counter'>(11)</span><div class='page_container' data-page=11>
[44] Nejati, M. and Ghasemi, S, 2012. Corporate social responsibility in Iran from the perspective of employees.
<i>Social Responsibility Journal, Vol. 8 No. 4, pp. 587-588. </i>
[45] Nelling, E. and Webb, E, 2009. Corporate social responsibility and financial performance: the „virtuous circle‟
<i>revisited. Review of Quantitative Finance and Accounting, Vol. 32, pp. 197-209. </i>
[46] Odemilin, E. G., Samy M. and Bampton, R, 2010. Corporate social responsibility: a strategy for sustainable
<i>business success. An analysis of 20 selected British corporations. Journal of Business in Society, Vol. 10 </i>
[47] Odemilin, EG, Samym, and Bampton, R. 2010. Corporate social responsibility: a strategy for sustainable
business success. An analysis of 20 selected British corporations. Journal of Business in Society, Vol. 10.
[48] Pahuja, S. 2009. Relationship between environmental disclosures and corporate characteristics: a study of
large manufacturing companies in India. Social Responsibility Journal, Vol. 5 No. 2, pp. 227-244.
[49] Patten, DM 1991. Exposure, legitimacy, and social disclosure. Journal of Accounting and Public Policy, vol
10, no 4, pp 297 – 308.
[50] Rashid, ZA. and Ibrahim, S. 2002. Executive and Management Attitudes towards Corporate Social
Responsibility in Malaysia. Corporate Governance, vol 2, no 4, pp 10-11.
[51] Roberts, RW 1992. Determinants of corporate social responsibility disclosure: an application of stakeholder
theory. Accounting, Organizations and Siciety, vol 17, no 6, pp 595 – 612.
[52] Ruf, BM, Muralidhar, K, Brown, RM, Janney, JJ, and Paul, K, 2001. An Empirical Investigation of the
Relationship Between Change in Corporate Social Performance and Financial Performance: A Stakeholder
Theory Perspective. Journal of Business Ethic, vol 32, no (2), pp 143-156.
[53] Saleh, M, Norhayah, Z and Rusnah, M. 2011. Looking for evidence of the relationship between corporate
social responsibility and corporate fianancial responsibility in an emergingmarkets. Asia-Pacific Journal of
business administration, vol 3, no 2, pp 165.
[54] Samy, M., Odemilin, G. and Bampton, R, 2010. Corporate social responsibility: a strategy for sustainable
<i>business success: an analysis of 20 selected British companies. Corporate Governance, Vol. 10 No. 24, pp. </i>
203-217.
[55] Schneider, B. and Konz, AM. 2006. Strategic job analysis. Human Resource Manage, Vol.28, pp. 51–63.
[56] Setyorini, C.T. and Ishak, Z, 2012. Corporate social and environmental disclosure: a positive accounting theory
<i>view point. International Journal of Business and Social Science , Vol. 3 No. 9, pp. 152-164. </i>
<i>[57] Sigh, S. and Kansal, M, 2011. Voluntary disclosures of intellectual capital: An empirical analysis. Journal of </i>
<i>intellectual capital, 12(2), 301-318. </i>
[58] Skudiene, V. and Auruskeviciene, V, 2012. The contribution of corporate social responsibility to internal
<i>employee motivation. Baltic Journal of Management , Vol. 7 No. 1, pp. 49-67. </i>
[59] Stanny, E. and Ely K, 2008. Corporate environmental disclosures about the effects of climate change.
<i>Corporate Social Responsibility and Environmental Management, 15, 338-348 </i>
[60] Tien H.V, Van Anh H.T, 2017. Trách nhiệm xã hội doanh nghiệp và hiệu quả tài chính: bằng chứng từ các
<i>công ty niêm yết Việt Nam. Tạp chí Kinh tế và phát triển Trường Đại học kinh tế quốc dân Hà Nội tháng </i>
8/2017, số 242, trang 36 – 46.
</div>
<span class='text_page_counter'>(12)</span><div class='page_container' data-page=12>
[62] Trang, H.N.T and Yekini, L.S. 2014. Investigating the link between CSR and Financial performance –
<i>Evidence from Vietnamese listed companies. British Journal of Arts and Social Sciences. ISSN: 2046-9578, 17 </i>
(1).
[63] Tsoutsoura, M. 2004. Corporate social responsibility and financial performance: the “virtuous circle” revisited.
Working paper, University of California, Berkeley, CA.
[64] Van de Laan, G, Van Ees, H and Van Witteloostuijn, A, 2008. Corporate social and financial performance: an
<i>extended stakeholder theory, and empirical test with accounting measures. Journal of Business Ethics, vol. 79, </i>
no. 3, pp 299-310.
[65] Waddock, SA and Graves, SB, 1997. The Corporate Social Performance – Financial Performance Link.
<i>Strategic Management Journal, 18(4): 303-319. </i>
[66] Wu, ML. 2006. Corporate social performance, corporate financial performance, and firm size: a meta-analysis.
Journal of American Academy of Business, Vol. 8, no (1), pp. 163-71.
[67] Young, Z. & Marais, M, 2012. A multi-level perspective of CSR reporting: The implications of national
<i>institutions and industry risk characteristics. Corporate Governance: An International Review, 20: 432–450. </i>
<i>[68] Zhang, J, 2013. Determinants of corporate environmental and social disclosure in Chinese listed mining, </i>
<i>electricity supply and chemical companies annual reports. Master of Accounting by Research, Edith Cowan </i>
University.
[69] Zhang, X and Gu, P, 2012. On the correlation between CSR and financial performance: an imperical study of
US firms. Jonkoping University.
</div>
<!--links-->