Relationship between quality management practices and competitive performance - Japanese quality award perspective
Bạn đang xem bản rút gọn của tài liệu. Xem và tải ngay bản đầy đủ của tài liệu tại đây (775.6 KB, 26 trang )
<span class='text_page_counter'>(1)</span><div class='page_container' data-page=1>
The Journal ol.l.ipancse Operations Management and Strateg\'. Vol. 2. No. I. pp. 16-'7. 201 i
RELATIONSHIP BETWEEN QUALITY MANAGEMENT PRACTICES
AND COMPETITIVE PERFORMANCE: JAPANESE QUALITY
AWARD PERSPECTIVE
<i>Phan Chi Anh </i>
<i>University ofiEconomics and Business - Vietnam National University, Hanoi </i>
<i>Yokohama National University </i>
<i>Yoshiki Matsui </i>
<i>Yokohama National University </i>
<b>ABSTRACT </b>
This paper presents the results of an empirical study on the relationship between quality
management practices and competitive performance based on our framework to analyze the
evaluation criteria for the Japanese Quality Award (JQA). Path analysis technique is applied
to test the proposed framework using data gathered from 163 manufacturing plants, and the
result indicates that the data fit well with the JQA model. Multiple regression analysis is used
to determine the path coefficient, which is decomposed into direct and indirect effects.
Competitive performance is significantly explained by process management. In addition, top
management leadership, information analysis, customer relationship, and workforce
management are found to indirectly relate with competitive performance. Our findings
suggest that JQA model should be adopted as a framework for the self-innovation in business
organizations to gain the competitive advantages.
<b>Keywords: Quality Management, Japan Quality Award, Empirical Study </b>
<b>INTRODUCTION </b>
<b>In an era of globalization, quality management is regarded as a key factor in gaining </b>
competitive advantage. From a perspective of competitive strategy, quality is often seen as a
source of differentiation. The interrelationship among quality management practices and their
effect on competitive performance has been investigated in many empirical studies such as
Flynn et al. (1995), Anderson et al. (1995), Forza and Flippini (1998), Choi and Eboch (1998),
Dow et af. (1999), Kaynak (2003), and Yeung et al. (2005). These have produced mixed'
results, probably because of utilization of different analytical frameworks, measurement
constructs, and methodologies (Sousa and Voss, 2002; Nair, 2006). Recently, national quality
award models such as the Malcolm Baldrige National Quality Award (MBNQA) and the
European Quality Award (EQA) and international standards like ISO 9000 quality
management system became widely used to study quality management (Khoo and Tan, 2003;
Flynn and Saladin, 2006; Schniederjans et al., 2006). The effects of quality management
practices on business performance appeared differently across these studies. Therefore,
further research is needed to clarify the relative importance and interplay between core and
infrastructure practices of quality management and their impact on business performance in
various organizational contexts (Sousa and Voss, 2002; Zhao et al., 2004). Responding to this
</div>
<span class='text_page_counter'>(2)</span><div class='page_container' data-page=2>
<i><b>Phan and Matsui: Reluiinnshtp between Quality Management Practices and Competitive Performance </b></i>
<i>Japanese Quality .hvarJ Perspective </i> __________________
need, this study focuses on the Japanese quality management approach to investigate the
effects of qualit> management practices on multi-faced competitive performance ot
manufacturing plants. Our study aims to answer the following research questions:
• What is the relationship among quality management practices?
•■ Which quality management practices are directly related to competitive performance?
• Which quality management practices are indirectly related to competitive performance?
Based on the Japan Quality Award (JQA) concepts and model, we propose an empirical
framework of quality management practices including six components: top management
leadership, strategic planning, information analysis, workforce management, customer
relationship, and process management. Path analysis technique is used to analyze survey data
collected from one hundred and sixty-three manufacturing plants belonging to three industrial
fields: electrical & electronic, machinery, and automobile in five countries: Germany, Italy,
Japan, Korea, and the United States. Multiple regression analysis is used to determine the path
coefficient, which is decomposed into direct and indirect effects. The results show that
competitive performance is directly related to process management. In addition, customer
relationship, information analysis, workforce management, strategy planning, and top
management leadership are indirectly related to competitive performance. While the great
effect of process management on competitive performance is detected, our analysis suggests
<b>that managers should build a strong infrastructure for quality management, based on </b>
workforce management, information analysis, and top management leadership. The good fit
between the collected data and the proposed framework indicates that our proposal can be
<b>used for further studies on quality management. </b>
The structure of this paper is organized as follows. The next section reviews the JQA
model and the empirical studies on the interrelationship among quality management practices
and their effects on the competitive performance. The third section proposes an analytical
framework of the study along with hypotheses on relationship among quality management
practices and competitive performance. The fourth section refers to the data collection and
measurement test. The fifth section presents the results of hypotheses testing. We present the
main findings, implications, and limitations of this study in the sixth section. The last section
presents the final conclusions of this study.
<b>LITERATURE REVIEW </b>
Studying the relationship between quality management and competitive performance has
received a high degree of attention in the literature. Several research papers attribute superior
firm performance to adoption of quality management practices. Our review of the literature
indicated that the quality, management studies differed in the conceptualization of quality
management practices and firm performance. Several studies operationalized quality
management as a multi-dimensional construct (Anderson et al., 1995; Flynn et al., 1995;
Powell, 1995; Forza and Flippini, 1998; Rungtusanatham et al., 1998; Samson and Terziovski,
1999; Das et al., 2000; Wilson and Collier, 2000; Cua et al., 2001; Matsui, 2002; Kaynak,'
2003) while others conceptualized it as a single construct (Choi and Eboch, 1998).
Competitive performance has been also conceptualized in different ways across studies
(Nair, 2006). Some studies considered operational performance measured in terms of product
quality, time performance, and inventory performance (Flynn et al., 1995; Choi and Eboch,
1998; Forza and Flippini, 1998: Dow et al., 1999; Samson and Terziovski, 1999; Kaynak'
2003) and financial performance measured in terms of growth in market share, profitability.
</div>
<span class='text_page_counter'>(3)</span><div class='page_container' data-page=3>
<i><b>Phan and Matsui: Relationship between Quality Management Practices and Competitive Performance </b></i>
<i>Japanese QuaUty Award Perspective </i> _____________ ^^__
return on assets (Das et al., 2000; Wilson and Collier. 2000; Kaynak, 2003). Meanwhile, other
studies considered customer satisfaction measures (Anderson et al., 1995; Choi and Eboch,
1998; Forza and Flippini, 1998; Rungtusanatham et al., 1998; Wilson and Collier, 2000; Das
et al, 2000) to capture performance benefits acquired from quality management practices. In
some studies, a multidimensional operationalization of performance is considered (Das et al.,
2000; Wilson and Collier, 2000) while others considered performance as a single construct
(Anderson et al., 1995; Rungtusanatham et al.. 1998).
The papers also differ in terms of the level of analysis and research methodology used to
test hypothesized relationships between quality management practices and competitive
performance. Generally, it is observed that most of the studies have either focused on
manufacturing plant-level data or on firm-level data for investigating the relationshipbetween
quality management practices and firm performance.
The methodologies considered for research investigations include path analysis (Anderson
et al., 1995; Flynn et al., 1995; Rungtusanatham et al., 1998); regression analysis (Samson
and Terziovski, 1999), correlation analysis (Powell, 1995), discriminant analysis (Cua et al.,
2001), canonical analysis (Matsui, 2002), and strucmral equations modeling (Choi and Eboch,
1998; Forza and Flippini, 1998; Dow et al., 1999; Das et al., 2000; Wilson and Collier, 2000;
Kaynak, 2003). These diversities exist in research methodologies, reflecting the variations in
sample characteristics and hypothesized relationships.
JQA was established in 1995 by the Japan Productivity Center for Socio-Economic
Development (JPC-SED). It was modeled after the self-assessment theory of the Malcolm
Baldrige National Quality Award (MBNQA) in the United States, and modified to
accommodate Japanese management practices. The award is presented to Japanese companies
displaying excellent overall management qualities. These are companies that continue to
create new values through the continuous process of self-innoVation to transform their overall
management systems into more customer-oriented structure. Since its inception, 162
companies have applied and 24 companies have received the award (Japan Quality Award,
2009). Four concepts have been introduced by JQA: customer focus, distinctive capabilities,
valuing employees, and harmony with society. These concepts refer to the fundamental values,
attitudes, beliefs, and standards embedded in the Japan Quality Program (JQP) that aims for
innovations and developments to realize management excellence. Based on these core
concepts, seven core values have been introduced: customer-driven quality, leadership,
process-oriented, creating "intelligence" through dialog, agility, partnership, and fairness.
These core values refer to what organizations should proactively think about when dealing
with major management concerns and challenges that emerge, reflecting ongoing changes to
business environment. To help the business organizations realize the organizational
objectives; JQP introduces an assessment criteria model, which is shown in Figure 1.
The JQA model consists of eight categories, which identify the "ideal sharp" and values, as
well as customers, competition, management resources and the future direction of innovation.
Table 2 summarizes the main characteristics of the JQA model in comparison with Deming
Prize (DP), MBNQA, and European Quality Award (EQA). Overall, these programs
exemplify customer driven quality through streamlined processes, product design, leadership,
human resource development and customer focused strategic plans. All of the awards' criteria
are updated periodically by award administrators in order to represent the most current
understanding of organizational quality practice and improvement. Throughout the criteria,
customer, employee and community satisfaction are emphasized (Vokurka et al., 2000).
</div>
<span class='text_page_counter'>(4)</span><div class='page_container' data-page=4>
c '^ S "^
c:
X .J ori
n
C OJ
<i><b>> =</b></i>
ã^ 1/3
ô o
1*- -'
<i>V </i> 3
3 .12 «1 ,^
to "U ^.£^ -
§ S - =?
<b>" ° i - </b>
S o w ■=
g^ E o
E ^_ ■£
5 ^ g 5
J: tfi o o c
S .E a.CQ C
2 s -^
<b>« >,</b>
■£ ^ ■
w = 2 ^
<b>-Is.</b>
O X rt ;^
c — a "
c; w E >,
- a :3 -i"
vn r, _ ^
^ - 3 5D
—■
ro
o
?
c >, =u >,
<b>£ g-S 5</b>
<b>I g 5 £^ ^</b>
S s; S ^1
S I -S - S
t/l <J 3 ti
JJ o ra ^
S
Q-2 Ji 3 -^
OJ >,0 £
o-OJI
ô -a
<b>Đ1</b>
aix
2 Đ
CD,
3 C O
a^ E
C ro
3 t; °
Oi^^ E Ovi £
<b>I</b>
U
s:
C3
<b>I</b>
"
a
a
O
J
c
.■- ^
<b>St</b>
« "a
^ Ol
■a ..
~13
a
<b>§</b>
to
o _
<b>11 </b>
<b>■B ></b>
U (3
a. 3
<i><b>O O</b></i>
E t3
0) i/l
CL 3
<b>o u </b>
<b>= ></b>
3 —
< c
£-2
<b>I ^ S</b>
■O fN J2
(3 •—' , _ ,
u ■K "^
> o
a>
' u ■;: " —
g-D -S .Si
U
_ ' ■ iu
>.
<b>ll ° </b>
^ 2 ^ H
(J tfi____ ,
_________ .
£ --- c^ c
" O) u ro
U ^ I- ■=
E — => .1^
o s «^ 5
£ C OT3
n tD-:T 3
in
«■-4^ ^ S
T3 w. TO
£ IS
<b>a </b>
« 2 .52
<b>I ^ >- </b>
<b>I S g </b>
"" fe ra
S S S
<i><b>xi Us</b></i>
S £ ra
O - ,0
S 5-.E
fl O Q.
O D. £^
"3] £ ^
E P 3
,o s
3 1/1
. . O t,
ttj o aj
i ^£
._ S «j "K
■5 = 33
o £ OU
t—I D, ■ _ -
■—-^2 s
= g-^2
<b>s I § ^.</b>
<b>ro I 5 y </b>
g J- t^ o
<b>— ^ "° </b>
<b>E</b>
<b>I'</b>
ro
E
o
<b>,</b>
<b>_</b>
<b>w t:</b>
0) "S
4J
E
m
or
;
er
yp
<b>o</b>
m
3 w >
<b>-^</b>
<b>^</b>
<b>3</b>
■|Q
<b>a., _ </b>
<b>1 </b>
<b>& </b>
5 ly-i
tu ■-'
er
to
qua
a. ^ <b>c -R</b>
<b>E -o</b> .2
y
<b>ll </b>
« £
o C^ <b>1S </b>
0-Q. ■—■
o
c
£ £
£ "-J Q.
3 £ > -3
^ 5 c3 2
C '— • -
■-
mi-T3 E
5. c
<b>:;r.2</b>
<b>S.2 </b>
<b>£ e</b>
fi
n <sub>;</sub>iU<sub>lI</sub> JJ
<b>«</b>
<b>—</b>
ef
ec
t
s <sub>ra</sub>nty <sub>fqua</sub>
l
of
t
he
tor
s
<i><b>-a</b></i>
wa
r<i>o ^</i>
OJ
U-.
^ 3 i>
u
tc
o
m vj D D.
stof lalc
o
es
sm
com
O
3 <b>o</b>u 2 i o
u
<
u
Qua
li .s .3 3
<b>></b>
<b>H</b> <b>H <</b> <sub>la</sub>ti
fN
I m 'd- u
•—I
o
—'
m
rj <b><sub>o</sub></b> <sub>r</sub>
a <b>r<sub>o</sub></b>
<b>"</b>
<b>^ </b>
1> <b><sub>£</sub></b>
utm
ei
(4)
U
)C
oo
b
en
cl
<b>c</b> tn
e
com
3
<b></b>
<b>-—'</b>
<b>o</b>
O C
D <b>a</b>
<b>></b>
i
2
C
<b>'</b>
<b>£</b>E S S
O
E *>
S S
o
E £^ =
u — -5
<b>2 H. </b>
<b>?</b>
E-S
o
O *J
W
^ K
■£
- £■ E
^ E
o-w r a p s
^ ^ w ^
— u
E 2
U Q
=0 ,.
E
</div>
<span class='text_page_counter'>(5)</span><div class='page_container' data-page=5>
^ tb o
-M Tl , J
<b>r</b>
<b>a£</b>
u 3
<1>
<b> _ </b> pe
n<b><sub>h</sub></b>
<b>o</b> <
U
<b>c</b>
<b>o£</b> <b>-o</b> ana
<b>u</b> C
Q <b>t</b>
<b>:</b>
<b>^ .- E</b>
<b>£^ 2</b>
■^
<b>^</b> ■o S 2 "^-^ " = T3<b><sub>a £ =^^ </sub></b>
^ 1) 1) -^
=D ^ T3
CL
H
ra ~ -o
<i>^ a </i>
<i>^</i>
-O 3
<b>g ^</b>
3 o
<b>£ o</b>
<i><b>a</b></i>
Q. — O
.£■0 3
<b>E >r 5</b>
S £
.2 15
Q. 3
E .2
EJ) £
<b>«€</b>
<b>E D.</b>
<b>c -if</b>
<b>E'E</b>
<b>3 § </b>
o c
<i>§ </i>
&->2 £■
<b>2 1</b>
<i>in -T3</i>
<b>2 £ S-</b> E ■=
<b>I</b>
<b>E</b>
<b>S o</b>
OJ — c>n a.'
<b>a: </b>
<b>o</b>
<b>£</b>
<b>I</b>
as
OU <b>aa:</b><b>m</b>
u
va
r
i^
re
s
na i
<i>ii</i>
0
I
r
t
alyCl.
3 <b>e</b>
<b>C < </b>t
Z
)
<b>I</b>
O
<b>OJ</b>
<b>u</b>
<b>-o</b>
E o
£ "TO ><
gas
5-8s
<b>></b>
<b>1 s"J ^ .^^ </b>
<b>> _. f" ^ </b>
<b>2 5 i-^</b>
<b>E c:</b>
K-- ^-^ •—■ ^ (U '—
■ - - _ • s—
<b>-Si</b>
^ O 3
(3 Q> ,o
E ci.^
<i>^ % S. </i>
rt E w
<b>,£ 5 > </b>
<b>u- U .H</b>
c V
■5 o
_ f^
U O O
rt CO o
^ U. (O u
<b>ôi E ô a;</b>
<b>Đ « 2 § "</b>
■5 E 3 ■= ^
<b>£ -fi: u 2 .E</b>
<b>^i</b>
cu
O
<b>I</b>
<b>"a</b>
<b>OJ </b>
<b>s;</b>
<i><b>SI</b></i>
<b>^ Ol</b>
<b>^ </b>
<b>s</b>
<b>^ </b>
<b>^</b>
3 «
<b>£P E </b>
<b>w £></b>
<b>-o —</b>
ij O 3
u '3
a-S O 0)
^ 0--5.C
O « 3
E
<b>c a = .E </b>
(i> ■ aj
<b>E ES E 5</b>
-3 Q i> p
^ U « 2
3^ § ^
2 O ECJ
£^■o^ u 3 ^
3 ^ Q.
_ 13 c/3
Ul rt c
<b>'^ ;* E </b>
OJ > o
<b>u « ></b>
<b>£ oi "o </b>
<b>cu ^ ></b>
"1 >1
<b>a> 3 </b>
<b>E S- </b>
<i><b>> </b></i>
<-.£ a. i>^
<b>£</b>
<b>></b>
<b>1</b>
<b>2</b>
<b> </b>
<b>£</b>
<b> —</b>
<b> </b>
<b>w</b>
<b>o</b>
<b>ro </b>
<b>S -H</b>
<b>2 </b>
<b>^-=</b>
<b>— fc :^ ^</b>
3 G -a
<b>■2 ^ « S-r</b>
"^ C W i_
TS
H gte-l
ir S LU
<b>-C £</b>
<b></b>
SI-^ SI-^ a>
o S m
S"
3 -g ___ c
i3 » cd
lo « c
"Q
c ■" o
s
£ 0) E
tu Cl. "S
so g
<i><b>^ fr</b></i>
; o
2
<i>•—• ~o </i>
00 o
O i2 >< >
^ 3
<b>a, u £ "</b>
<b>OQ</b>
<b>t^ £</b>
^ 3r
0.0 2;§^-^
<b></b>
a§-ij-i
,—,
4j — I- ra
"O
P u
3 ^
O ">
0 W
<b>e- £</b>
<i>% </i>£
</div>
<span class='text_page_counter'>(6)</span><div class='page_container' data-page=6>
: 3 ^ u
I g-i S
O O) i^
; (- E ^
<b>.S I</b>
<b>.^S </b>
"TO SO
3 3
<b>2 rT _a</b>
O 3 • =
ro D ti
3 T3 2
o a —
<b>'S — ^</b>
■a 3
<b>Ha</b>
<i>3 .—</i>
<b>>:ci</b>
- 3
!/l
</div>
<span class='text_page_counter'>(7)</span><div class='page_container' data-page=7>
<b>i&</b>
<i><b>a</b></i>
<b>::JJy) </b>
<b>ro </b>
<b>ro</b>
<b>I </b>
<b>I</b>
o u o tu >.
-9^3
<b>IJ Q.'</b>
<b>C C = </b>
<b>-=</b>
-S S o <b>Wl</b>
oi ^ S £
2 n..ii 't'5
a J o S r o £ 3 S o 4 > u
<b>(N 0-1 Tj- ij-i -O t~-- </b>
<b>00</b>
^ lO so f*- 00 ON
—
<b>I</b>
Cl
o
c 00 o^ o
<b>: aj </b> <b>> n</b>
<b>^ 3</b>
ro o
S i« —
3 -O
<b>u e</b>
<b>o «</b>
s:
CI
£
O
OJiS
?5
E S o io o
X '^ 4 3 *"
« ~ 2 S c
~ ro lU C -1)
i^ £.£ .s
<b>1/1 </b> <b>"J ^ -3</b>
H.^ 2 g 2
Q. <i>m</i>
<b> ^ </b>fl>
F
re
jud
and pa
rtn
e
cc
es
s
x
ib
il
it
y0
3
mge requir
e
sibi
li
ty
ea
sur
e
r
o
K
H
ro
cr
;
c r
o
pe
rf
or
m
anc
Or
ga
niza
ti
o
E
mpl
oye
es
suc
ce
ss
5)
cha
nge
a
nc
re
quir
es
a
mea
ningf
u
l
M
ana
ge
mer
P
ubli
c
re
;
P
er
for
ma
nc
.E2 3
3
T3
0
. a. <sub>1^</sub> <i>f</i>
u U £
u 0
3
« 3 — u
_ j i ? 5 t j 2 2 x£ c o
<b></b>
I-a,
£
o
2 S
<i>_ _C; . _ Ul. ^</i>
_ o
^■^S.^ I I
3
c —O 2 £ -^ o
g «<>-| >.'<u 3
<i>a ■- 1- E -D -a </i> 3
<b>£ 5 |§ </b>
> J e.^
<b>£ Q 2 S</b>
3 n o
3 E?^ § g §ro
E-i2 2
UJ
Li.
r s t m - r j - i n ^ o r - ' O O O ' —
<b>(N</b>
tl
3
O
J
c
<b>^ </b>
<b>%</b>
<b>) </b>
<b>5 </b>
<b>%)</b><sub> </sub>
-Cl *u
<b><sub>•</sub></b>
<b>S</b>
<b>- </b>
(U
-s
: <b>^ </b>
<b>§<sub> ^ </sub></b>
o a.
ri ~
Q
tu Q
<i><b>'</b></i>
<i><b>< </b></i>
S
<i>,H</i>
<b>^ </b>
a<b> ^</b>
<b>^ </b>
<b>« </b>
<b>S </b> Oj
<i>a</i> ■u
n Cl)
<b>h</b>
<b>a</b>
<b>n</b>
3
/7
(3
/7
0.<b> "</b>
<b>^ </b>
<b>a </b>
<b>2 02 </b>
<b>></b>
^■i SS g ^
<b>T3 E S K "</b>
<b>O W " ^</b>
Q- 3 t: ^
3
u <sub>g</sub><sub> </sub>
c J=
u >1
t/1 n
t/5 3 c
u 3 <i></i>
<i>-a</i>
ri
v
e
n
ta
t
ite
ll:
7.Q. <sub>rie</sub>c Q.
tom
ei
de
rs
h
:es
so
ati
ng
hty :ner
sh
ne
ss
2
«
3
(
i>
0 w <sub>S</sub>
) <b>i </b>
ro
U -J <b><sub>£</sub></b> U < o- u.
—
(N
r^ ■V>j
-i ■-<sub>D</sub>
r-c <sub> </sub>
_
o
■«
a <sub> </sub>
ro ■_■
2^
?t Di
<b>-9-^</b>
■s^ ^
-rT^'-'
E
<b>fs|</b>
<b>l» Ul eg </b>
<b>M</b>
■-- .12 «
=^ := ro «
■2 < O i
i O^ 3
<b>Cl. S § H</b>
:^ £ -o a;
to > > ^ ^
ro Q. 3 3 o
i: 3 ro '—
^ £ > =
^ 5 a:
Q--0 ro
<b>.2-E </b>
so—
<b>—■ _ 3 «</b>
E a: 2
o t
<b>-3 </b>
<b>=</b>
c .2
—
o
--
i>
<b>bO</b>
<b>-2- E</b>
so C
<b>' « a </b>
<b>"E </b>
<b>2 </b>
ro tj
H 3
y-^g E
</div>
<span class='text_page_counter'>(8)</span><div class='page_container' data-page=8></div>
<span class='text_page_counter'>(9)</span><div class='page_container' data-page=9>
<i><b>Phan and \latsui: Relaiionship between Quality Management Practices and Compefllive Performance: </b></i>
<i>Japanese Quality Award Perspective</i>
3. Understanding and Responding to Customer and Market Need (100)
Direction and Driving Force
I. Leadership
of Senior Leaders (120)
2. Social Responsibility of
Management (50)
System Operation
4. Strategy Planning and
Deployment (60)
5. Improving Employee and •
Organizational Capabilities (100)
6- Customer Value Creation
Processes(120)
Results
8. Activity Results (400)
7. Information Management (50)
<i>Figure I -Japan Quality Award Model (Japan Quality Award Committee Administration, 2008)</i>
The different between JQA and DP is that DP does not provide a model framework for
organizing and prioritizing criteria. Unlike JQA that focuses on continuous improvement and
self-innovation, the DP is more concerned with company-wide quality control for product
manufacturers. MBNQA and EQA include in their framework the importance of fostering a
culture of entrepreneurial challenges and of harnessing new technology, as well as in
employing diversity to create competitiveness and business, while JQA management
philosophy focuses on building consensus (shared vision), aligning people with processes,
and forming cooperation with suppliers to achieve excellent quality (Khoo and Tan, 2003).
<b>RESEARCH FRAMEWORK</b>
Empirical research refers to the research that makes use of data that is derived from naturally
occurring field-based observations, taken from industry. Recently, empirical research on
quality management is an area becoming increasingly important for both practitioners and
academicians because it provides the type of understanding needed to achieve excellent
quality in a global economy (Flynn et al., 1990).
As more and more practitioners use JQA as a tool for self-assessment and continuous
quality improvement, the JQA framework becomes so imperative that the JQA concept,
model, and constructs be tested and validated (Calingo, 2002). In this study, we would like to
adopt the JQA perspective to empirically study quality management because the JQA
framework specifies the cause and effect of quality initiatives, implying which practices will
lead to various desired outcomes. From our intensive literature review, we focus on a set of
<i>six quality management practices, which reflect six JQA categories: Top management </i>
<i>leadership, Information analysis, Customer relationship, Strategic planning. </i>
<i>Workforce</i>
</div>
<span class='text_page_counter'>(10)</span><div class='page_container' data-page=10>
<i><b>Phan and Matsui: Relationship between Quality Managemenl Practices and Competitive Performance- </b></i>
<i>Japanese Quality Award Perspective </i> ___________________________________
<i>management, and Process management {Social responsibility of management is not included </i>
in this study because the data is not available). In the quality management literature, these
practices have been also highlighted as critical components for achieving excellent quality. In
this study, six constructs are developed to measure those six key quality management
practices, based on the JQA concept. Table 3 summaries the relevance between these six
underlying constructs and the JQA evaluation criteria. The JQA approach to these quality
management practices, their interrelationship, and their impact on competitive performance as
discussed in the quality management literature are summarized as follows.
<i>Top management leadership</i>
JQA emphasizes that top management is an important driver for developing quality
management system. Top management leadership is a critical requirement for effective and
efficient quality management because it encourages the practices and behaviors that lead to
quality performance throughout the organization. Top management leadership is expected to
have impact on all of the aspects of quality management. Particularly, top management
leadership strongly relates to the development and deployment of manufacturing strategy
throughout the plant, the analysis and utilization of quality information in the shop floor, and
development of customer and supplier relationship for quality improvement. This argument
has been supported by such empirical studies as Anderson et al. (1995), Flynn et al. (1995),
Samson and Terziovski (1999), Das et al. (2000), Wilson and Collier (2000), and Kaynak
(2003).
<i>Information analysis</i>
The quality improvement strongly depends on how the plants collect, analyze, and utilize the
quality information. JQA emphasizes that information analysis provides the input for several
managerial activities such as strategic planning, workforce management, process management,
and customer relationship. Because it links to every aspect of quality management,
information analysis needs the support and leadership by top management. This argument is
supported by such empirical studies as Flynn et al. (2005), Choi and Eboch (1998), Kaynak
(2003), and Yeung et al. (2005).
<i>Strategic planning</i>
JQA indicates that a strategic plan should be formed and developed based on facts and logical
thinking. It presents the long-term goals, objectives, and commitment throughout the
organization. Quality management studies such as Wilson and Collier (2000) and Parast et al.
(2006) reported the positive impact of strategic planning on business performance. The
successful quality management is dependent on how the plants develop and deploy their
strategic plan, quality policy, and quality objectives. Particularly, some aspects of the
workforce management as the employee's training and involvement depend on the
establishment of the long-term strategy. In another side, the effective strategic planning
process is influenced by information analysis.
<i>Workforce management</i>
JQA indicates that organizational capabilities would be enhanced by (1) respecting the
opinion and actions of employees, (2) involving employees in quality improvement and
innovation, (3) providing organizational support to employees though training, and (4)
improving the working environment. In the same line, several empirical literatures (Flynn et
</div>
<span class='text_page_counter'>(11)</span><div class='page_container' data-page=11>
<i><b>Phan and Matsui: Relationship between Quality Management Practices and Competitive Performance: </b></i>
<i>Japanese Quality Award Perspective</i>
al., 1995; Choi and Eboch, 1998; Samson and Terziovski, 1999) report the importance of
workforce management to quality improvement. It includes the promotion of employees'
skills and attitudes by providing skill training programs and involving them into continuous
improvement programs. These workforce management activities are moderated by the plants
strategy. The plants with long-term and quality-based competitive strategy should focus on
developing skills, attitude, and quality mindset of their employees. The effectiveness of
workforce management is exposed in production processes. The properly trained workers
improve product quality by conducting several activities such as statistical process control
(SPC), 5S, and preventive maintenance.
<i>Customer relationship </i> •
JQA emphasizes the value interaction with customers and suggests companies to review the
intended values from the customer's point of view. Managing the close relationship with
customer allows manufacturing plants to identify and clarify their customers' requirements
that will be translated into product and process specifications. Thus, the strong relationship
with customers should directly relate with process management. The contribution of customer
relationship to plants performance and its linkage with process management are reported in
many empirical literatures such as Flynn et al. (1995), Samson and Terziovski (1999), Cua et
al. (2001), Kaynak (2003), Yeung et al. (2005), and Parast et al. (2006).
<i>Process management </i>
Process management refers to the techniques and tools applied to a process to improve its
effectiveness, hold the gains and ensure its integrity in fulfilling customer requirements. As
JQA indicates, effective process management depends on several requirements concerning
with human aspects, quality information analysis, and customer relationship management. In
manufacturing plants, process management contributes to plant performance by reducing the
variability of process, which leads to reduction in scraps and reworks. Better product quality
allows the manufacturing plants to gain the higher competitive position in terms of cost,
delivery and flexibility, because the better product quality with less scraps and reworks allows
the plants to achieve lower manufacturing cost. The lesser defective products are associated
with the shorter cycle time because the plants do not need to waste their times on repairing
and reworking. This enables the plants to achieve on-time delivery and to change their
production volume easily (volume flexibility). In brief, process management improves
different dimensions of competitive performance. This argument is supported by such
empirical studies as Flynn et al. (1995), Anderson et al. (1995), Forza and Flippini (1998),
Choi and Eboch (1998), Dow et al. (1999), Kaynak (2003), Yeung et al. (2005), and Phan and
Matsui (2009).
We visualize and summarize the arguments on the relationship among quality management
practices and competitive performance as discussed above into a framework presented in
Figure 2. The boxes describe six quality management practices and competitive performance.
The cause-and-effect relationships between two boxes are presented by arrows. It is expected
that:
<i>• Top management leadership directly links to Strategy planning. Information analysis, and </i>
<i>Customer relationship. </i>
<i>• Information analysis directly links to Strategy planning. Workforce management. Process </i>
<i>management, and Customer relationship. </i>
<i>• Strategic planning directly links to Workforce management. </i>
</div>
<span class='text_page_counter'>(12)</span><div class='page_container' data-page=12>
<i><b>Phan and Matsui: Relationship between Quality Management Practices and Compefitive Performance:</b></i>
<i>Japanese Ouality Award Perspective</i>
<i>• Workforce management. Information analysis, and Customer relationship directly link to </i>
<i>Process management. </i>
<i>• Process management and Customer relationship directly link to competitive performance. </i>
Based on the JQA approach and the quality management literature as discussed above, we
establish the hypotheses on the interrelationship among quality management practices and
their impact on competitive performance as follows:
<i>Hypothesis Hj: Information analysis is directly related to Top management leadership. </i>
<i>Hypothesis H2: Customer relationship is directly related to Top management leadership and </i>
<i>Information analysis. </i>
<i>Hypothesis H3: Strategic planning is directly related to Top management leadership and </i>
<i>Information analysis. </i>
<i>Hypothesis H4: Workforce management is directly related to Information analysis, Strategy </i>
<i>planning, and Top management leadership. </i>
<i>Hypothesis H5: Process management is directly related to Workforce management, </i>
<i>Information analysis, and Customer relationship; and indirectly related to </i>
<i>Top management leadership and Strategy planning. </i>
<i>Hypothesis Ha: Competitive performance is directly related to Process management and </i>
<i>Customer relationship; and indirectly related to Workforce management. </i>
<i>Information analysis. Top management leadership, and Strategy planning. </i>
To measure the conceptual constructs underlying the JQA categories, a set of eleven
measurement scales is selected from High Performance Manufacturing (HPM) Project
<i>database. We use four individual scales to measure Top management leadership, Information </i>
<i>analysis. Strategic planning, and Customer relationship respectively. Workforce management </i>
<i>is the first super-scale that is constructed from three individual measurement scales: Task- </i>
<i>related training for employees, Small group problem solving, and Employee suggestions. The </i>
<i>second super-scale, Process management is constructed from four individual measurement </i>
<i>scales: Cleanliness and organization, Process control, Preventive maintenance, and Supplier </i>
<i>quality involvement. </i>
Competitive performance refers to the ability of a business organization to survive in a
competitive marketplace by providing products or services that satisfy its customers. For
manufacturing companies, the competitive performance would be achieved by developing
cumulative capabilities regarding quality, cost, delivery, flexibility, and time (Schroeder and
<i>Flynn, 2001). In this study, competitive performance is measured by: Unit cost of </i>
<i>manufacturing, Conformance to product specifications, On-Time delivery performance, Fast </i>
<i>delivery. Flexibility to change product mix, Flexibility to change volume. Inventory turnover, </i>
<i>Cycle time (from raw materials to delivery), New product development lead time, Product </i>
<i>capability and performance, On-time new product launch, Product innovativeness, and </i>
<i>Customer support and service. Those performance indicators have been identified in quality </i>
management literature as the key performance of manufacturing companies (Shroeder and
Flynn, 2001; Cua et al., 2001; Phan and Matsui, 2009 and 2010; Naor et al., 2010).
</div>
<span class='text_page_counter'>(13)</span><div class='page_container' data-page=13>
<i><b>a</b></i>
<b>c</b> <b>ro</b> u
<b>u — </b>ro
3
<b>a.</b> 0
<b>■~</b> <i><b><sub>f</sub></b></i><b><sub> ^ </sub></b>
<b>c></b> <i><b>r.</b></i>
VI OJI
<b>c</b>
<b>Ll</b> SO w
<b>!2 £</b>
<b>E ^</b>
<b>I </b>
<b>I</b>
.0 ^
ro
<b>«</b>
o s- j=
<b>^ £</b>
■5. a
<b>;9 .s</b>
■r: a.
ra 3
KJ 3
<b>o E</b>
tB P
<b>a.</b>
<b>s:</b>
C3
H E
<b> </b>0
<b> ></b>
<b><</b>
<b>) </b>
■—'
<b>i2</b>
3
u
<b>Q;</b>
u
0
<i><b>1</b></i>
<i><b>^</b></i>
ro
<b><</b>
3
<b>se</b>
CL <N
3 O
<i>•"■ -a</i>
<b>.2 a,</b>
rt Q
.- (J
<b>ii</b>
<b>c OJ:</b>
O cd
<b>a: 2</b>
t3 CL <b>I §> §</b>
<b>= o </b>
<b>-5 &</b>
</div>
<span class='text_page_counter'>(14)</span><div class='page_container' data-page=14>
<b>I</b>
=3
3
<b>OJ</b>
<b>Is</b>
<i><b>■2 °^</b></i>
<b>It</b>
<b>rt "Q</b>
<b>^ OJ</b>
rt Qj
1J s
(_> CJ
<b>-^ 5P</b><sub>I- n</sub>
O C
<b>^</b>
<i>a </i><b>2</b>
CJ <sub>00</sub>
<b>'5o .S</b>
<b>w c</b>
<b>" 5</b>b- CO
lyi
a-C crt
<b><sub>2 ^</sub></b>
<b>s -« </b>
n f o r A n
<b>/ \ </b>
C Q.
„ C v;
O CO u
<b>t- ^-o</b>
<b>c ;3</b>
c3 U
<b>S-^</b>
<b>a</b>
b.1 <sub>j:</sub>
<b>H</b> <b>c</b>
<b>o</b> <b>o</b>
cd
<b>u </b> OJ
</div>
<span class='text_page_counter'>(15)</span><div class='page_container' data-page=15></div>
<span class='text_page_counter'>(16)</span><div class='page_container' data-page=16>
<i><b>Phan and Matsui: Relationship between Quality Management Practices and (Competitive Performance:</b></i>
<i>Japanese Ouality Award Perspective</i>
DATA COLLECTION AND MEASUREMENT TEST
This study explored the data gathered through the international joint research initiative called
High Performance Manufacturing (HPM) Project, which started in 1980s by researchers at the
University of Minnesota and Iowa State University. The overall target of project is to study
■^best practices" in manufacturing plants and their impact on plant performance in the global
competition. The first round of the survey has been conducted in 1989 gathering information
from forty-six US manufacturing plants. In 1992, the project has been expanded to include
researchers from Germany, Italy, Japan, and the UK. The second round of the survey gathered
data from one hundred and forty-six manufacturing plants from the above countries. In 2003,
the project has been expanded to include other researchers from Korea, Sweden, Finland,
Austria, and Spain.
The total number of manufacturing plants participated in the third round of the survey is
two hundred and thirty-eight plants. Within each country, surveyed are plants with more than
100 employees belonging to one of three industrial fields - electrical & electronics,
machinery, and transportation. The researchers, based on business and trade journals and
financial information, identified manufacturers as having either a "World-Class Manufacturer
(WCM)" or a "Non World-Class Manufacturer (NWCM)" reputation. Each manufacturer
selected one typical plant for participating in the project. This selection criterion allowed for
the construction of a sample with sufficient variance to examine variables of interest for the
research agenda (Bozarth et al., 2009; Naor et al., 2010).
<i>Table 4 - Characteristic i</i> <i>of Survey's Respondents</i>
United States Japan Germany Italy Korea Total
Electrical & Electronic 9 10 9 10 10 48
Machinery 11 12 13 10 10 56
Automobile 9 13 19 7 11 59
World Class 15 17 NA 13 18 63
Non- World Class 14 17 NA 14 13 58
Plant characteristics * <b><sub>» </sub></b>
Average Market Share (%) 25.50 25.05 30.21 23.38 31.54
Average Sale ($000) 284.181 1.118.492 1.736.230 71.209 2.266.962
Average of Number of Employee* 583 1555 601 370 1045**
<i>* Including both salary personnel employee and hourly personnel </i>
<i>** Data from 19 plants only</i>
•Jn this research, we acquire the data from 163 manufacturing plants in five countries:
Germany (41 plants), Italy (27 plants), Japan (35 plants), Korea (31 plants), and the United
States (29 plants) during 2003-2004. The plants belong to three industries: electrical and
electronics (48 plants), machinery (56 plants), and automobile (59 plants). The main
characteristic of those plants is summarized in Table 4. Eleven measurement scales for quality
management were constructed by four to six question items evaluated on a seven-point Likert
scale (l=Strongly disagree, 4=Neither agree nor disagree, 7=Strongly agree). Those questions
were answered by nine individuals as Direct Labor, Human Resources Manager, Production
Control Manager, Inventory Manager, Process Engineer, Quality Manager, Supervisor, Plant
Superintendent, and Plant Manager.
</div>
<span class='text_page_counter'>(17)</span><div class='page_container' data-page=17>
<i>Phan and Matsui: Relationship between Quality Management Practices and Competitive Performance </i>
<i>Japanese Quality Award Perspective</i>
Measurement Scales
<i>Table 5 - Measurement Analysis ___________________________ </i>
Factor analytical results: eigenvalue value
Cronbach Alpha
Top management leadership
Strategic planning
Infonnation analysis
Customer involvement
Task-jelated training for
employees
Small group problem solving
Employee suggestion
Cleanliness and organization
Process control
Supplier quality involvement
Preventive maintenance
Workforce management
Process management
GER ITA JPN
KOR
0 80 0 80 0 77 0.81 0.77 0.79
0 79 0 89' 0 71 0.77 0.97 0.80
080 088 078 0,74 0.76 . 0,80
0,66 075 068 0,71 0 66 0.68
080 076 075 0,80 0,82 0.79
0.86 0.84 0.74 0.75 0 85 0.82
087 0.86 0.81 0.69 0.85 0.83
0.85 0,79 0,83 0,66 0,81 0,80
0,80 0,89 0,85 0.80 0 84 0 82
0,70 0.79 0,70 0.62 0,75 0,70
063 0,71 0,77 0,71 0,72 0,68
0,88 0.90 0,85 0,87 0,84 0,86
0,84 0,68 0.83 0.74 0.76 0.77
GER
7.11 3.15 3.09 3 17 298 3.03
(52) (53) (52) (52) (50) (50)
2.46 3.02 2.20 2.55 290 2,55
(62) (75) (55) (64) (73) (64)
2.80 3.45 2.71 2.48 263 2,79
(56) (69) (54) (50) (53) (56)
2.10 2,36 2.09 2 17 2,04 2 11
(53) (59) (52) (54) (51) (53)
2.55 2.37 2.29 2.53 2,60 2.28
(64) (59) (57) (63) (65) (57)
3.53 3,40 2.63 2.66 3.50 3.14
(59) (57) (44) (44) (58) (52)
3.33 3,22 2.85 2.37 3.17 3.03
(67) (65) (57) (47) (63) (61)
3.19 2.80 3.08 223 2.92 2,82
(64) (56) (62) (45) (58) (56)
2.78 3.67 3.17 2.81 3.12 2.95
(56) (69) (63) (56) (62) (59)
2.29 2.75 2.27 1.89 2.53 2.29
(46) (55) (45) (47) (51) (46)
2.10 2.37 2.63 2.37 2.43 2.23
(42) (47) (53) (48) (49) (45)
2.41 2.51 2.37 2.42 2.33 2.45
(80) (84) (78) (81) (78) (78)
2.74 2.12 2.72 2.28 2,46 2.44
(68) (53) (68) (57) (61) (64)
<i>iStat</i>
<i>i</i>
<i>zs, </i>
<i>PS:</i>
<i>Pooled Sample</i>
We evaluate the competitive perfonnance by investigating the competitive position of the
plant for each performance indicator. Each plant manager was asked to indicate his/her
opinion about how the plant compares to its competitors in the same industry on a global basis
on a five-point Likert scale (l=Poor or low end of the industry, 2=Below average, 3=Average,
4= Equivalent to competitor, 5=Superior or top of the industry). Then, the overall index for
competitive performance of each plant was obtained by calculating the mean value of thirteen
individual performance indicators.
<i> __________________________ Table 6 - Correlations and Descriptive Analysis __________________________________ </i>
Constructs Min. Max. Mean
Std.
Top management leadership 3.500 7.000 5.549 0.624
Strategic planning
Information analysis
Customer relationship
Workforce management
Process management
2.500 6.750 5.130 0.880 0.442 1
(0.000)
•
2.317 6.600 4.839 0.857 0.422 0.459 1
(0.000) (0.000)
3.657 6.300 5.224 0,474 0.383 0,271
0.507 1
(0.000) (0.001) (0.000)
3,444 6,733 5.099 0,559 0.558 0.482 0.652
0.495
(0.000) (0.000) (0.000)
(0.000)
3.564 3.564 4.992 0.510 0.531 0.454 0.757
0.564
0.766
(0.000) (0,000) (0.000) (0.000) (0.000)
<i>Note: Significant level is given in parentheses under binary correlation coefficient</i>
(% variance)
<i>GER: Germany, ITA: Italy JPN: Japan. KOR: Korea,</i>
PS
</div>
<span class='text_page_counter'>(18)</span><div class='page_container' data-page=18></div>
<span class='text_page_counter'>(19)</span><div class='page_container' data-page=19>
<i><b>Phan and Matsui: Relationship between Qualin Management Practices and Competitive Performance: </b></i>
<i>Japanese Quality Award Perspective</i>
The first step of analytical process is the analysis of reliability and validity of eleven
individual measurement scales and two super-scales. In this study, Cronbach's alpha
coefficient is calculated to evaluate the reliability of each measurement scale. Table 5 shows
that the alpha value for all of eleven scales exceeded the minimum acceptable level of 0.60 for
the pooled sample and country-wise. Most of the scales have the alpha valu& of above 0.75
indicating that the scales are internally consistent (Nunnally, 1967).
Content validity: An extensive review on the JQA'model and quality management studies
is undertaken to ensure the content validity.
Construct validity. The construct validity is also tested to ensure that all question items in a
scale all measure the same construct. Within-scale factor analysis is conducted with the three
criteria: (1) uni-dimensionality, (2) a minimum eigenvalue of 1, and (3) item factor loadings
in excess of 0.40. The results of the measurement test for the pooled sample and country-wise
indicate that all scales are satisfactory in terms of the construct validity. The eigenvalue of the
first factor for each scale is more than two. The factor loadings of each item are more than
0.40, mostly ranged between 0.70 and 0.90 for the pooled sample as shown in appendix.
HYPOTHESIS TESTING
Path analysis is a statistical method of finding cause/effect relationships. It has been used
widely in empirical quality management studies (Flynn et al., 1995; Anderson et al., 1995;
Kaynak, 2003; Yeung et al., 2005). In this study, path analysis is selected to test the
framework and hypotheses, with regression analysis determining the significance of the
relationships between the independent and dependent variables. Path coefficients between
each independent variable and dependent variable are presented by standardized regression
coefficients. As suggested in the cited literature, in order to simplify the model prior to
decomposition, all paths whose coefficients are not statistically* significant at the 0.15 level or
less should be eliminated (Flynn et al., 1995). The correlations between all pairs of variables
are then decomposed into the sum of their direct and indirect effects.
Prior to conducting path analysis, a correlation analysis is conducted. Table 6 presents the
mean and the standard deviation of each variable along with the correlation matrix. It
indicates that there is no problem with unusually high standard deviation and/or unusual mean.
Regarding correlation, as discussed in the cited literature, the value of 0.8 or more indicates
the possibility to suffer from the multi-collinearity between variables. Table 6 shows that
<i>correlation coefficients between Process management and Information analysis and between </i>
<i>Workforce management and Process management are close to this criterion. Therefore, the </i>
Variance Inflation Factor (VIF) that measures the inflation in parameter estimate due to the
coUinearities among independent variables is calculated for each model during path analysis.
The value of VIF for each variable is presented in Table 7. By setting the acceptable value for
VIF at 10 as suggested in the literature, it is found that all model variables are within the VIF
limit indicating that their muhi-collinearities do not have an undue influence on least squares
estimates. As the result, all the variables are retained in the model for further analysis.
To test the hypotheses, six multiple regression models are developed and the results of
analysis are shown in Table 7. We find that:
<i>• Top management leadership explains seventeen percent of variability of Information </i>
<i>analysis. </i>
<i>• Combination of Top management leadership and Information analysis explains twenty- </i>
<i>eight percent of variability of Strategy planning and twenty-nine percent of variability of </i>
<i>Customer relationship. </i>
</div>
<span class='text_page_counter'>(20)</span><div class='page_container' data-page=20>
<i><b>Phan and Matsui: Relationship between Quality Management Practices and ('ompetitive Performance: </b></i>
<i>Japanese Ouality Award Perspective</i>
<i>• Combination of Top management leadership. Information analysis, and Strategy planning, </i>
<i>accounts for fifty-three percent of variability of Workforce management. </i>
<i>• Combination of Information analysiSy Customer relationship, and Workforce management </i>
<i>accounts for seventy-one percent of variability of Process management. </i>
<i>• Process management and Customer relationship explain seventeen percent of variability of </i>
<i>Competitive performance. </i>
<i>* </i> •
Next, path coefficients are .decomposed into the direct and indirect effects. The total effect
presents the sum of the direct effect and indirect effects of one variable on others as
summarized in Table 8. Figure 2 summarizes the direct effects among variable. The arrows
present direct relation between two variables along with values of direct effect. The indirect
<i>effects to a variable are indicated by a series of forward-pointing arrows. For example. Top </i>
<i>management leadership produces indirect effects on Workforce management through </i>
<i>mediating effects of Information analysis and Strategic planning. Literature suggests that the </i>
path having coefficient less than 0.15 needed to be removed. Therefore, the arrows between
<i>Strategic planning and Workforce management and between Customer relationship and </i>
<i>Competitive performance (presented in the dashed-line in Figure 2) should be trimmed from </i>
the model. The final model has following paths:
<i>Top management leadership — </i>
<i>—► Competitive performance </i>
<i>Top management leadership —■ </i>
<i>—► Process management - -> </i>
<i>Top management leadership — </i>
<i>—► Competitive performance </i>
<i>Top management leadership —* </i>
<i>—► Process management —-t </i>
<i>Top management leadership — </i>
<i>—► Competitive performance </i>
<i>Workforce management — </i>
<i>Information analysis - ► </i>
<i>Competitive performance </i>
<i>Information analysis — </i>
<i>" Information analysis </i>
<i>" Competitive performance </i>
<i>► Customer relationship </i>
<i>-> Process management </i>
<i>Workforce management </i>
<i>> Process management </i>
<i>' Customer relationship </i>
<i>-> Process management </i>
<i>Table 7 - Summary of Path Analysis </i>
<b>Dependent Variable</b> F P R^ <b>VIF</b> <b>Independent \'ariable</b> B <b><sub>t</sub></b> P
Information analysis 34.81 0.000 0.178 1.000 Top management leadership 0.422 5.900 0.000
Strategic planning 31.428 0.000 0.285 <sub>1.222 </sub>
1.222
Top management leadership
Information analysis
0.299
0.331
4.047
4.442
0.000
0.000
Customer relationship 33.046 0.000 0.292 <sub>1.216 </sub>
1 216
Top management leadership
Information analysis
0.206
0.420
2.810
5.732
0.006
0.000
Workforce management 60.250 0,000 0.535 <sub>1 398 </sub>
1.375
1.349
Strategic planning
Infomiation analysis
Top management leadership
0.136
0.461
0.304
2.119
7.153
4.866
0,036
0.000
0.000
Process management 130.737 0.000 0.712 <sub>1 886 </sub>
1.856
1.438
Information analysis
Workforce management
Customer relationship
0.405
0.435
0.147
6.943
7.522
2.898
0,000
0,000
0.004
Competitive perfonnance 14.995 0.000 0.170 1.467
1.467 Process management
Customer relationship
0.347
0.101
3.803
3.803
0,000
0.270
</div>
<span class='text_page_counter'>(21)</span><div class='page_container' data-page=21>
<b>u</b> <b>u</b>
<b>> </b> <b>o</b>
<b>ãu<sub> Ê </sub></b>
<b>a.</b> Lô
<b>F </b> <b>c2</b>
<b>o</b>
P
er
<b>Ar.</b>
<b>s; </b>
CI
<b>cu</b>
<b>I </b>
<b>"</b>
<b>I</b>
<b>I</b>
<b>I</b>
<b>a</b>
<b>Ol</b>
<b>s;</b>
<b>I"?</b>
<b>c</b>
fo <b>E</b>0)r
..1^ 00
IM <sub>cd</sub>
<b>o</b> <b>c</b>
<b>^ </b>
CJ 00
CJ) <b><sub>c</sub></b>
<1> <b><sub>c</sub></b>
<b>c</b>
cd
t/3 CU
<b>-^ </b>
<b>c</b>
CA
<b>E </b>
O 00
<b>a. </b>
<b>s</b>
C Q.
<b>a.</b>
<b>o</b> <b>an <u</b>
<b>H</b>
an a ea d
<b>S-^ </b>
CL
<b>!</b>
<b>_ </b>
J=
<b>E</b> C
<b>o</b> <b>o</b>
3
ela
<b>cc:</b>
<b>5 </b>
<b>CO</b>
</div>
<span class='text_page_counter'>(22)</span><div class='page_container' data-page=22>
<i><b>Phan and Matsui: Relationship between Qualiri' Management Practices and Competitive Performance:</b></i>
<i>Japanese Quality Award Perspective</i>
<i>Table 8 • Decompositions</i> <i>of Path Coefficient</i>
<b>Dependent Variable</b> <b>Independent V ariable</b> <b>Direct Effect</b> <b>Indirect EfTect</b> <b>Total Effect</b>
Information analysis Top management leadership 0.422 0,000 0422
Strategic planning Top management leadership 0.299 0.140 0 439
Information analysis 0331 0.331* 0 331
Customer relationship Top management leadership 0.206 <b>0.177</b> 0383
Information analysis 0.420 <b>0.000</b> 0 420
. Top management leadership 0,304 0.254 0 558
Workforce management Information analysis 0.461 0.045 0.506
Strategic planning 0.136 0.000 0.136
t <sub>Top management leadership</sub> <sub>0.000</sub> <sub>0.470</sub> <sub>0.470</sub>
Information analysis 0.405 0.282 0687
Process management Strategic planning 0.000 <b>0.059</b> 0.059
Customer relationship 0,147 <b>0.000</b> 0.147
Workforce management 0,435 0.000 0.435
Top management leadership 0,000 0.191 0.191
Information analysis 0,000 <b>0.279</b> 0,279
Competitive performance <sub>Strategic planning </sub>
Customer relationship
0 000
0,101
<b>0.024 </b>
<b>0.000</b>
0,024
0,101
Workforce management 0.000 <b>0.177</b> 0,177
Process management 0,347 0.000 0.347
<i>Table 9 - Model Fit Summary</i>
<b>Model Fit</b> <b>Value Recommend Value</b>
Chi-square 32954
Comparative Fit Index (CFI) 0.967 >0,90
Root Mean Square Error of Approximation (RMSEA, 90% confidence interval) 0.065 0,00; 0,08
Normed Fit Index (NFI) 0.954 >0,90
Incremental Fit Index (IFI) 0,968 >0,90
Parsimony Normed Fit Index (PNFI) 0.790 >0.70
DISCUSSIONS, IMPLICATIONS, AND LIMITATIONS
In the previous sections, we have proposed an analytical framework and research hypotheses,
and empirically tested them by the path analysis with muhiple regression models. The results
support the hypotheses on the relationship among quality management practices and
competitive performance. The main findings and implications of this study can be
summarized as below.
Firstly, our study reveals some empirical evidences on the interrelationship among quality
<i>management practices. The results indicate the significant impacts of Top management </i>
<i>leadership and Information analysis on other practices. It is found that Workforce </i>
<i>management and Customer relationship highly depend on Top management leadership and </i>
<i>Information analysis. Top management leadership provides the direction and environment for </i>
<i>quality improvement while Information analysis enables the shop-floor employees to capture </i>
the information on process variation, quality performance, and quality problems. The results
<i>also identify the critical determinants for Workforce management. Effective workforce </i>
management highly depends on the top management commitment and the long-term strategy
implementation. These practices formulate the foundation to develop skilled, quality minded
</div>
<span class='text_page_counter'>(23)</span><div class='page_container' data-page=23>
<i><b>Phan and Matsui: Relationship between Quality Management Practices and Competitive Performance: </b></i>
<i>Japanese Quality Award Perspective</i>
<i>and knowledgeable workforce. The great infiuence of Information analysis on Customer </i>
<i>felationship indicates that the plants should build and maintain an effective information </i>
system in order to develop their relationship with customers. Production process is the place,
which makes products that meet and excess customers" requirements and expectations. This
<i>study indicates that Process management highly depends on Information analysis -and </i>
<i>Workforce management. The involvement of trained workers is a critical determinant for </i>
effective process management. In addition, the implementation'of statistical process control
and preventive maintenance requires the support from information system. Quality data
should be visualized and given back to shop-floor employees for identifying and eliminating
the sources of quality problems.
Secondly, our study suggests the linkage between quality management practices and
competitive performance. It is found that competitive performance could be achieved by
emphasizing several quality management practices. While process management is found
directly related to competitive performance, our analysis strongly recommends that managers
should build a strong infrastructure for quality management, based on leadership, workforce
management, and information analysis. Our findings are in line with previous quality
management studies such as Flynn et al. (2005), Cua et al. (2001), Kaynak (2003), Yeung et
al. (2005), Nair (2006), and Arauz et al. (2009).
This study contributes to the field by introducing and testing a JQA based-framework for
quality management. The JQA management philosophy focuses on creating value through
effective leadership, customer value process creation, and customer satisfaction. In addition,
JQA emphasizes respecting opinions and actions of employees, involving employees into
quality improvement and innovation activities, and training employees. These approaches
when implemented in manufacturing plants, as demonstrated by our empirical analysis, lead
to the achievement of high performance manufacturing. Though our measurement scales do
not show an exact match for the JQA categories and subcategories, we have taken the first
step to use JQA as a framework to study the relationship between quality management
practices and competitive performance. As explained in the previous sections, our target is to
test the relationship between the constructs underlying the JQA approach, not to test the
relationship between the JQA categories. The results from the measurement test and the good
fit between the data and the proposed framework indicate that our proposal and survey
instrument could be used for further study on quality management. In future, other studies
using the JQA framework should deal with the weights assigned to the JQA categories in
order to identify whether the recent developments on weighting scheme accurately reflect the
relative importance of the categories. This will help the researchers to validate the JQA model
and contribute to extending the applicability of JQA as an approach for self-innovation in the
global context.
It is important to view this study in the context of its limitations. Methodologically, this
study is based on the cross-sectional survey data gathered via self-reported questionnaires,
and individual bias in reporting may exist. Although we addressed the issue of common
method bias through the use of multiple respondents in the manufacturing plants, the study
still heavily relies on the use of perceptual data. There is another issue concerned with the
utilization of subjecfive measures for competitive performance. Because of the industry
difference, we can only use subjective evaluation to measure operational aspects of
competitive performance. The ftiture studies should try to explore other dimensions of
competitive performance such as financial and market performance. In addition, the objective
measures should be explored when we will focus on a specific industry.
</div>
<span class='text_page_counter'>(24)</span><div class='page_container' data-page=24>
<i>Phan and Matsui: Relationship between Quality Management Practices and Competitive Performance: </i>
<i>Japanese Oualiiv IwardPerspective</i>
CONCLUSIONS
This study uses the database that includes different levels of qua!it>
implementation and competitive performance evaluated by the respondents from a variety of
plants from five countries. The results confirm that competitive performance is directly
dependent on such core quality management practices as process management- which in turn
depends on infrastructure on human resource, information analysis, and top management
leadership. Our findings suggest that JQA should be adopted as a framework for improvement
and innovation rather than a criterion for rewarding organizations with top quality
performance.
REFERENCES
Anderson, J. C. Rungtusanatham, M, Schroeder, R. G. and Devaraj, S. (1995). "A path analytic model of a
theory of quality management underlying the Deming Management Method: Preliminary empirical findings,"
<i>Decision Sciences, Vol. 26, No. 5, pp. 637-658. </i>
Arauz, R.. Matsuo. H. and Suzuki, H. (2009), "Measuring changes in quality management: An empirical analysis
<i>of Japanese manufacturing companies," Total Quality Management & Business Excellence. Vol. 20. No. 12,</i>
pp.1337-1374.
Bozarth, C, Warsing, D.. Flynn, B., and Flynn, J. (2009), "The impact of supply chain complexity on
<i>manufacturing plant performance,'' Journal of Operations Management, Vol. 27, No. 1, pp.79-93. </i>
<i>Calingo, L. M. R. (2002), Quest for Global Competitiveness Through National Quality and Business Excellence</i>
<i>Awards, Asian Productivity Organization, Tokyo. </i>
Choi, T. Y. and Eboch. K. (1998), "The TQM paradox: Relations among TQM practices, plant performance, and
<i>customer satisfaction." Vourrttj/o/Opera//o«5 Management, Vol. 17. No. 1, pp. 59-75. </i>
Cua, K. O., McKone, K. E. and Schroeder, R. G. (2001), "Relationship between implementation of TQM, JIT,
<i>and TPM and manufacturing performance,"" Journal of Operations Management. Vol. 19, No. 6, pp. 675-694. </i>
Das. A., Handfield, R. B., Calantone, R. J. and Ghosh, S. (2000), "A contingent view of quality management-the
<i>impact of international competition on quality," Decision Sciences, Vol. 31, No. 3, pp. 649-690. </i>
<i>Deming Prize Committee (2002), The Deming Prize Application Guide. Union of Japanese Scientists and</i>
Engineers, Tokyo.
Dow. D.. Samson. D. and Ford, S. (1999), "Exploding the myth: Do all quality management practices contribute
<i>to superior competitive performance," Production and Operations Management, Vol. 8, No. 1. pp. 1 -27. </i>
<i>European Foundation for Quality Management (2003). EFQM Model for Business Excellence, Brussels. </i>
Flynn, B. B., Sakakibara, S.. Schroeder, R. G., Bates, K. A. and Flynn, E. J. (1990), "Empirical research
<i>methods in operations management," Journal of Operations Management, Vol. 9, No. 2, pp. 250-284. </i>
"
Flynn, B. B., Schroeder, R. G. and Sakakibara, S. (1995), "The impact of quality management practices on
<i>performance and competitive advantage," Decision Sciences, Vol. 26. No. 5, pp.659-691. </i>
Flynn, B. B. and Saladin, B. (2006), "Relevance of Baldrige constructs in an international context: A study of
<i>national culture," Journal of Operations Management, Vol. 24, No. 2, pp. 583-603. </i>
Forza, C. and Flippini. R. (1998), "TQM impact on quality conformance and customer satisfaction: A causal
<i>model," International Journal of Production Economics, Vol. 55, No. 1, pp. 1-20. </i>
Japan Quality Award (2009). accessed on 20* Sept. 2009.
<i>Japan Quality Award Committee Administration (2008). 77?^ Japan Quality Award Assessment Criteria</i>
<i>Guidebook 2008 Edition, Japan Productivity Center for Socio-Economic Development, Tokyo. </i>
Kaynak, H. (2003), 'The relationship between total quality management practices and their effects on firm
<i>performance." Journal of Operations Management. Vol. 21, No. 4, pp. 405-435. </i>
Khoo. H. H. and Tan, K. C. (2003), "Managing for quality in the USA and Japan: Differences between MBNQA,
<i>DP and JQA."" The TQM Magazine, Vol. 15. No. 1. pp. 14-24. </i>
<i>Malcolm Baldrige National Quality Award (2007), Criteria for Performance Excellence. United States</i>
Department of Commerce. National Institute of Standards and Technology, Washington. DC.
Matsui, Y. (2002), "An empirical analysis of quality management in Japanese manufacturing companies,"
<i>Decision-Making at the Speed of Light: What is Amiss?. Proceedings of the Seventh Asia-Pacific Decision</i>
<i>Sciences Institute Conference. National Institute of Development Administration, Bangkok, Thailand, pp. </i>
1-18.
</div>
<span class='text_page_counter'>(25)</span><div class='page_container' data-page=25>
<i><b>Phan and Matsui: Relationship hemeen Quality Management Practices and Competitive Performance: </b></i>
<i>Japanese Quality Award Perspective</i>
Nair, A. (2006). "Meia-anaKsis of the relationship between quality management practices and firm performance
<i>- Implications for qualit\ management theory development." Journal of Operations Management. Vol. 24.</i>
No. 6, pp. 948-975.
Naor. M.. Linderman. K. and Schroeder. R. (2010). "The globalization of operations in eastern and western
countries: Unpacking the relationship between national and organizational culture and its impact on
<i>. manufacturing performance."" Journal of Operations Management, Vol. 28. No. 3. pp. 194-205. </i>
<i>Nunnally, J. (1967), Psychometric theory, McGraw Hill, New York. </i>
Parast, M. M., Adam, S. G.. Jones. E. C.,' Rao, S. S. and Raghu-Nathan, T. S. (2006;, "Comparing quality
<i>management practices between the United States and Mexico."" Quality Management Journal. Vol. 13. No. 4.</i>
pp. 36-49.
Phan. C. A. and Matsui. Y. (2009). "Effect of quality management on competitive performance - International
<i>perspective,"" International Journal of Productivity and Quality Management. Vol. 4. No. 2. pp. 153-177. </i>
Phan, C. A. and Matsui, Y. (2010). "Contribution of quality management and just-in-time production practices to
<i>manufacturing performance," International Journal of Productivity and Quality Management. Vol. 6, No. 1,</i>
pp. 23-47.
Powell, T. C. (1^995), "Total quality management as competitive advantage: A review_and empirical study,"
<i>Strategic Management Journal. Vol. 16, No. 1, pp. 15-27. </i>
Rungtusanatham, M., Forza, C, Filippini. R. and Anderson, J. (1998), "A replication study of a theory of quality
<i>management underlying the Deming management method: Insights from an Italian context," Journal of</i>
<i>Operations Management, Vol. 17. No. 1, pp. 77-95. </i>
Samson, D. and Terziovski, M. (1999), "The relationship between total quality management practices and
<i>operational performance,"" Journal of Operations Management. Vol. 17, No. 4, pp. 393-409. </i>
Schniederjans, M. J., Parast. M. M., Nabavi, M., Rao, S. S. and Raghu-Nathan, T. S. (2006). "Comparative
analysis of Malcolm Baldrige National Quality Award criteria: An empirical study of India, Mexico, and the
<i>United States," Quality Management Journal, Vol. 13, No. 4, pp. 7-21. </i>
<i>Schroeder, R. G. and Flynn. B. B. (2001), High Performance Manufacturing: Global Perspectives. John Wiley</i>
Sons, New York.
Sousa, R. and Voss, C. (2002), "Quality management re-visited: A reflective review and agenda for future
<i>research," Journal of Operations Management, Vol. 20, No. 1, pp. 91-109. </i>
Vokurka, R. J., Stading, G. L. and Brazeal, J. (2000), *"A comparative analysis of national and regional quality
<i>awards,"" Quality Progress, Vol. 33, No. 8, pp. 41-49. </i>
Wilson. D. D. and Collier, D. A. (2000). "An empirical investigation of the Malcolm Baldrige National Quality
<i>Award causal model," Decision Sciences, Vol. 31. No. 2, pp. 361-390. </i>
Yeung, A. C. L., Cheng, T. C. E. and Lai, K. H. (2005), "An empirical model for managing quality in the
<i>electronic industry," Production and Operations Management. Vol. 14, No. 2, pp. 189-204. </i>
Zhao, X., Yeung, A. C. L. and Lee, T. S. (2004), '"Quality management and organizational context in selected
<i>service industries of China," Journal of Operations Management, Vol. 22, No. 6. pp. 575-587.</i>
APPENDIX: QUESTIONS ITEMS OF MEASUREMENT SCLES
Factor loadings are given in parentheses following each item.
<i>Top Management Leadership</i>
1. All major department heads within the plant accept their responsibility for quality (0.72)
2. Plant management provides personal leadership for quality products and quality improvement (0.82)
3. The top priority in evaluating plant management is competitive perfonnance (0.52)
4. Our top management strongly encourages employee involvement in the production process (0.63)
5. Our plant management creates and communicates a vision focused on quality improvement (0.79)
6. Our plant management is personally involved in quality improvement projects (0.77)
<i>Strategic Planning</i>
1. Our plant has a formal strategic planning process, which results in a written mission, long-range goals and
strategies for implementation (0.87)
2. This plant has a strategic plan, which is put in writing (0.87)
3. Plant management routinely reviews and updates a long-range strategic plan (0.78)
<i>Information Analysis</i>
<i>\. Charts showing defect rates are posted on the shop floor (0.71)</i>
2. Charts showing schedule compliance are posted on the shop floor (0.71)
3. Charts plotting the frequency of machine breakdowns are posted on the shop floor (0.68)
</div>
<span class='text_page_counter'>(26)</span><div class='page_container' data-page=26>
<i><b>rhan and Matsui: Relationship between Oualit} Management Practices and Competitive Performance: </b></i>
<i>Japanese Quality Award Perspective</i>
4. Information on competitive performance is readily available to employees (0,81)
5. Information on productivity is readiK available to employees (0.76)
<i>Customer Irwolvement </i>
1. We frequendy are in close contact with our customers (0.69)
2. Our customers seldom visit our plant (removed)
3. Our customers give us feedback on our quality and dehvery performance (0.70)
4. Our customers are actively involved in our product design process (0.58) *
5. We strive to be highly responsive to our customers" needs (0.72)
6. We regularly survey our customers' needs (0 71)
<i>Small Group Problem Solving </i>
1. During problem solving sessions, we make an effort to get all team members' opinions and ideas before making
a decision (.64)
2. Our plant forms teams to solve problems (0 80)
3. In the past three years,jnany problems have been solved through small group sessions (0.78) ,
4. Problem solving teams have helped improve manufacturing processes at this plant (0.78)
5. Employee teams are encouraged to try to solve their own problems, as much as possible (0.65)
6. We don't use problem solving teams much, in this plant (0.72)
<i>Task-Related Training for Employees *</i>
<i>%</i>
1. Our plant employees receive training and development in workplace skills, on a regular basis (0.87)
2. Management at this plant believes that continual training and upgrading of employee skills is important (0.76)
3. Employees at this plant have skills that are above average, in this industry (0.58)
4. Our employees regularly receive training to improve their skills (0.89)
5. Our employees are highly skilled, in this plant (removed)
<i>Employee Suggestions </i>
1. Management takes all product and process improvement suggestions seriously (0.82)
2. We are encouraged to make suggestions for improving performance at this plant (0.77)
3. Management tells us why our suggestions are implemented or not used (0.76)
4. Many useful suggestions are implemented at this plant (0.82)
5. My suggestions are never taken seriously around here (0.72)
6. The plant has an informal strategy, which is not very well defined (0.67)
<i>Cleanliness and Organization </i>
<i>^ I. Our plant emphasizes putting all tools and fixmres in their place (0.69) ^</i>
2. We take pride in keeping our plant neat and clean (0.85)
3. Our plant is kept clean at all times (0.86)
4. Employees often have trouble finding the tools they need (0.57)
5. Our plant is disorganized and dirty (0.79)
<i>Process Control </i>
1. Processes in our plant are designed to be "foolproof (0,75)
2. A large percent of the processes on the shop floor are currenfly under statistical quality control (0.84)
3. We make extensive use ofstatistical techniques to reduce variance in processes (0.81)
4. We use charts to determine whether our manufacturing processes are in control (0.70)
5. We monitor our processes using statistical process control (0.87)
<i>Preventive Maintenance </i>
1. We upgrade inferior equipment, in order to prevent equipment problems (0.71)
2. In order to improve equipment performance, we sometimes redesign equipment (0.55)
3. We estimate tiie lifespan of our equipment, so that repair or replacement can be planned (0,74)
4. We use equipment diagnostic techniques to predict equipment lifespan (0.75)
5. We do not conduct technical analysis of major breakdowns (0.55)
<i>Supplier Quality Involvement </i>
1. We strive to establish long-term relationships with suppliers (0.64)
2. Our suppliers are actively involved in our new product development process (0.72)
3. Quality is our number one criterion in selecting suppliers (0.55)
4. We use mosUy suppliers that we have certified (0.61)
5. We maintain close communication with suppliers about quality considerations and design changes (0.80)
6. We actively engage suppliers in our quality improvement efforts (0.77)
7. We would select a quality supplier over one with a lower price (removed)
</div>
<!--links-->
Báo cáo y học: "Relationship between Anti-CCP Antibodies and Oxidant and Anti-Oxidant Activity in Patients with Rheumatoid Arthrit"
- 9
- 560
- 0

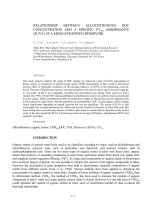


.push({});</script></div> </p><!-- <p class="text-xl pb-40 overlay-read-more absolute bottom-0 left-0 w-full text-center bg-gradient-to-t from-white to-transparent">--><!----><!-- </p>--><!-- </div>--><!-- <a href="javascript:" class="bg-secondary px-6 py-2 rounded text-white absolute bottom-0 left-1/2 mb-4 transform -translate-x-1/2" id="showmore">Xem Thêm</a>--> </div> <div style="position: relative;" class="col-span-3 hidden md:block px-1 text-center"> <div style="position: sticky;top: 10px;width: 300px; height: 600px;"> <ins class="adsbygoogle" style="display:inline-block;width:300px;height:600px" data-ad-client="ca-pub-2979760623205174" data-ad-slot="8377321249"></ins><script defer>(adsbygoogle = window.adsbygoogle || []).push({});</script> </div> </div> </div> <div class="vf_link_relate px-2 my-2"> <h2 class="vf_doc_relate text-2xl font-bold my-4">Tài liệu liên quan</h2> <ul class="grid grid-cols-12 gap-2"> <li class="col-span-6 md:col-span-2"> <div class="card-doc " onclick="actionDocRelated(this)"> <a class="card-doc-img" href="https://text.123docz.com/document/60180-bao-cao-y-hoc-relationship-between-anti-ccp-antibodies-and-oxidant-and-anti-oxidant-activity-in-patients-with-rheumatoid-arthrit.htm" title="Báo cáo y học: "Relationship between Anti-CCP Antibodies and Oxidant and Anti-Oxidant Activity in Patients with Rheumatoid Arthrit""> <i class="icon i_type_doc i_type_doc2"></i> <img class="lazy" src="data:image/gif;base64,R0lGODlhAQABAIAAAP///wAAACH5BAEAAAAALAAAAAABAAEAAAICRAEAOw==" data-src="https://media.store123doc.com/images/document/12/to/oc/medium_ocl1351138517.png" width="124" height="179" alt="Báo cáo y học: "Relationship between Anti-CCP Antibodies and Oxidant and Anti-Oxidant Activity in Patients with Rheumatoid Arthrit"" onerror="this.src=)