bai tap Matlab
Bạn đang xem bản rút gọn của tài liệu. Xem và tải ngay bản đầy đủ của tài liệu tại đây (172.49 KB, 32 trang )
Bài 1 : chương trình bảng cửu chương
% lap bang cuu chuong tu 2 den 9
clear
con = 'y' ;
while con =='y'
fact = input('Enter number i:10 ing character:','s');
switch fact
case'1'
for i = 1:10
fact = 1;
fact = fact*i;
disp(fact);
end
case'2'
for i = 1:10
fact = 2;
fact = fact*i;
disp(fact);
end
case'3'
for i = 1:10
fact = 3;
fact = fact*i;
disp(fact);
end
case'4'
for i = 1:10
fact = 4;
fact = fact*i;
disp(fact);
end
case'5'
for i = 1:10
fact = 5;
fact = fact*i;
disp(fact);
end
case'6'
for i = 1:10
fact = 6;
fact = fact*i;
disp(fact);
end
case'7'
for i = 1:10
fact = 7;
fact = fact*i;
disp(fact);
end
case'8'
for i = 1:10
fact = 8;
fact = fact*i;
disp(fact);
end
case'9'
for i = 1:10
fact = 9;
fact = fact*i;
disp(fact);
end
otherwise
disp('wrong number');
end
con = input('continue y or n:','s');
end
% end of program
Bài 2 : chương trình dùng lệnh For để tính gia thừa:
% dung lenh for de tinh gia thua
n = input('Enter positive integer:')
fact = 1
for i = 1:n;
fact = fact*i
end
% end of program
Baøi 3 : dung lenh for tinh tong day so s=1+3+5+..+n
% dung lenh for tinh tong day so s=1+3+5+..+n
n = input('positive integer:')
s=0
for i = 1:2:n
s=s+i
end
% end of program
Baøi 4: dung lenh for tinh tong day so s=1+3+5+..+n
% dung lenh for tinh tong day so s=1+3+5+..+n
n = input('positive integer:')
s=0
for i = n : -2 : 1
s=s+i
end
% end of program
Bài 5: các phép toán không tiết tuïc
%Beginning of program
%lenh switch tinh +,-,*,/
a = input('Enter a:');
b = input('Enter b:');
operator = input('Enter operator =,-,*,/:','s');
switch operator
case'+'
c = a+b;
disp(c);
case'-'
c = a-b;
disp(c);
case'*'
c = a*b;
disp(c);
case'/'
c = a/b;
disp(c);
otherwise
disp('wrong operator');
end
% end of program
Baøi 6 : chương trình các phép toán có tiếp tục
%Beginning of program
%lenh switch continue while tinh +,-,*,/
con = 'y'
while con =='y'
a = input( 'Enter a :' );
b = input( 'Enter b :' );
operator = input('Enter operator +,-,*, / :' , 's ');
switch operator
case'+'
c = a+b;
disp(c);
case'-'
c = a-b;
disp(c);
case'*'
c = a*b;
disp(c);
case'/'
c = a/b;
disp(c);
otherwise
disp('wrong operator')
end
con = input('continue y or n:','s');
end
% end of program
Bài 7 : tính tổng các số dương:
% chuong trinh nhap day so duong va tinh tong cua day so duong
% begining of program
con ='y';
sum = 0;
while con =='y'
nun = input('Enter number:');
if nun < 0 continue;
else
sum = sum + nun;
con = input('continue y/n:','s');
end
end
disp(sum)
% end of program
Baøi 8 : Cách sử dụng lệnh Breack :
% su dung lenh break
sum = 0
while sum >=0
nun = input('Enter number:');
if nun <0 break;
else
sum = sum + nun;
end
disp(sum)
end
% end of program
Bài 9 : tính tổng các số dương . nhập các số dương , nếu ta nhập 1
số âm bất
kỳ thì chương trình kết thúc và cho kết quả là tổng cảu các số
dương .
% su dung lenh break
sum = 0
while sum >=0
nun = input('Enter number:');
if nun <0 break;
else
sum = sum + nun;
end
end
disp(sum)
% end of program
Baøi 10 : chương trình vẽ đường tròn có tâm 3,2 trong m-file
% ve duong tron tam 3,2
t = 0:pi/100:2*pi;
x = 3 + 3*cos(t);
y = 2 + 3*sin(t);
plot(x,y,'m','linewidth',1.5 ,'linestyle' , '+' ),grid
xlabel('x')
ylabel('y')
title('ve duong tron tam 3 2')
% End of program .
Baøi 11 : Vẽ đồ thị hình sin(x) bám động :
% ve do thi cua ham sin
clear
x=0;
y=sin(x);
h=0.01;
p=plot(x,y,'k','linestyle','.','EraseMode','none','MarkerSize',5);
axis([0 16 -1 1]),grid
for x=0:pi/100:5*pi
y=sin(x);
set(p,'XData',x,'YData',y);
drawnow
pause(0.01)
xlabel('x'),ylabel('Y')
title('ve sin(x) bam dong')
end
% En of program.
Bài 12 : Tọa độ cực
Cách 1:
% toa do cuc su dung ham polar:
% beginning of program
theta=[0.0:0.1:10.0];
r1=theta;
r2=5*cos(theta)+5;
h(1)=polar(theta,r1,'m');
set(h(1),'markersize',2*6);
hold on
h(2)=polar(theta,r2,'r');
set(h(2),'Linewidth',5);
hold of
title('polar(theta,r...)''');
legend(h,' r = \theta','r = 5cos(\theta)+ 5',-1);
% End of program
Caùch 2 : toa do cuc su dung ham plot:
% Beginning of program:
theta=[0.0:0.1:10.0];
r1=theta;
r2=5*cos(theta)+5;
[x1,y1] = pol2cart(theta,r1);
[x2,y2] = pol2cart(theta,r2);
plot(x1,y1,'r','Markersize',2*6);
hold on
plot(x2,y2,'b','linewidth',5);
axis('equal')
title('polar using plot(x,y,...)''');
legend(' r = \theta','r = 5cos(\theta)+ 5',-1);
% End of program.
Bài 13 : Vẽ không gian 3 D
% ve khong gian 3 D
[x,y]=meshgrid(-2:0.1:2);
z = sqrt(x.^2+y.^2);
subplot(2,2,1);
surf(x,y,z,'Edgecolor','r'),title('hamsurf');
% ham ve do thi ba chieu z theo x va y .
subplot(2,2,2);
surfc(x,y,z,'Edgecolor','y'),title('hamsurfc');
% ham ve do thi ba chieu z theo x va y co hinh chieu tren mat phang x
–y .
subplot(2,2,3);
mesh(x,y,z,'Edgecolor','m'),title('hammesh');
% ham ve do thi ba chieu z theo x va y nhung khong co to mau nen.
subplot(2,2,4);
plot3(x,y,z,'linewidth',2.5,'linestyle','.','color','r'),title('hamplot3');
% ham ve do thi ba chieu
z theo x va y co theo thay
doi duoc cac thuoc tinh.
% End of program.
Bài 14 : Vẽ đồ thị sin và cos trên cùng tọa độ
%begin
x=0:pi/100:5*pi;
y1=sin(x);
y2=cos(x);
hold on
p=plot(x,y1,'b',x,y2,'r','linestyle','.','erasemode','none','markersize',10),grid;
xlabel('X'),ylabel('Y')
legend('sin(x)','cos(x)',-1)
title('graph sin(x) and cos(x)')
axis([0 16.5 -1.2 1.2])
%drawnow
%pause(0,0.1)
% end of program ..
Bài 15 : Vẽ đồ thị chạy hàm cos(x) bám động :
% ve do thi cua ham cos(x):
clear
x = 0;
y = cos(x);
h = 0.01;
p = plot(x,y,'m','linestyle','.','EraseMode','none','MarkerSize',5);
axis([0 16 -1.2 1.2]),grid
hold on
for x = 0:pi/100:5*pi
y = cos(x);
set(p,'Xdata',x,'Ydata',y)
xlabel('x'),ylabel('Y')
title('ve cos(x) bam dong')
drawnow
pause(0.01)
end
% End of program.
Bài 16 : Vẽ đường tròn elip
% ve duong tron nhap gia tri tu ban phim
a = input('nhap a:');
b = input('nhap b:');
r = input('nhap ban kinh r:');
r1 = input('nhap truc nho r1:');
r2 = input('nhap truc lon r2:');
t = 0:pi/100:2*pi;
x1 = a+r*cos(t);
y1 = b+r*sin(t);
x2 = a + r1*cos(t);
y2 = b + r2*sin(t);
set(gcf,'defaulttextcolor','r');
h = plot(x1,y1,'r',x2,y2,'b');
set(h,'linewidth',2.25);
Trang 11
axis('square');
xlabel('X');
h = get(gca,'xlabel');
set(gca,'fontsize',10);
set(gca,'xtick',-4:10);
ylabel('Y');
h = get(gca,'ylabel');
set(gca,'fontsize',16);
set(gca,'xtick',-12:2:12);
title('graphs of(x-a)^2 + (y-b)^2 = r^2 and (x-a)^2/(r1)^2 + (y-b)^2/(r2)^2 =
1');
h = get(gca,'title');
set(h,'fontsize',12);
grid
% End of pro gram
Bài 17 : Vẽ sin và cos có giớ hạn
% ve sin cos
h=figure('menubar','none','numbertitle','of','name','LuanVanTotNghiep','positio
n'
,[100 100 600 600],'color','c')
axes('parent',h,'position',[0.1 0.1 0.8 0.8])
x=0:pi/100:2*pi
plot(x,sin(x),'b',x,cos(x),'r'),grid
uicontrol('parent',h,'Style','pushbutton','string','START','position',[5 5 50
50],'callback','move4')
xlabel('X')
ylabel('Y')
h0=uimenu('parent',h,'label','FILE')
uimenu('parent',h0,'label','RUN','callback','move4')
uimenu('parent',h0,'label','CLOSE','callback','CLOSE')
h1=uimenu('parent',h,'label','EDIT')
uimenu('parent',h1,'label','CLEAR','callback','CLC')
uimenu('parent',h1,'label','CLOSE','callback','CLOSE')
% end of program.
Trang 12
Bài 18 : Vẽ đồ thị dạng sóng theo từng phaàn
% begining of program:
k = 0;
for n = 1:3:10
n10 = n*10;
x = linspace(-2,2,n10);
y = x./(1 + x.^2);
k = k + 1;
subplot(2,2,k)
plot(x,y,'g','LineWidth',2.0,'LineStyle','.')
xlabel('X'),ylabel('Y')
title('y = x/(1+x^2)')
axis([-2 2 -0.8 0.8])
grid
pause(3);
end
% End of program
Bai 19 : Chương trình cấu trúc bảng điểm :
%chuong trinh cau truc bang diem
clear
con = 'y';
i = 1;
while con == 'y'
n = i;
lop(i).STT = input('enter STT :','s');
lop(i).name = input('enter name :','s');
lop(i).diem = input('enter diem :');
if lop(i).diem > 8 lop(i).hang ='Gioi';
elseif lop(i).diem <=8 && lop(i).diem >7 lop(i).hang = 'Kha';
elseif lop(i).diem <=7 && lop(i).diem >5 lop(i).hang = 'Trung Binh';
else lop(i).hang = 'Yeu';
end
i = i + 1;
con = input('continue thanh vien khac y/n :','s');
end
for i = 1:n;
lop(i)
end
% end of program
Ví Dụ Như Sau :
enter STT :1
enter name :Hung
enter diem :9
continue thanh vien khac y/n :y
enter STT :2
enter name :Binh
enter diem :8
continue thanh vien khac y/n :y
enter STT :3
enter name :Dat
enter diem :8
continue thanh vien khac y/n :n
ans =
STT: '1'
name: 'Hung'
diem: 9
hang: 'Gioi'
ans =
STT: '2'
name: 'Binh'
diem: 8
hang: 'Kha'
ans =
STT: '3'
name: 'Dat'
diem: 8
hang: 'Kha'
Bài 20 : vẽ đồ thị sin(x) va cos(x) trên cùng 1 hệ trục tọa ñoä
%Begining of program
x = -2*pi:pi/100:5*pi;
y1 = sin(x);
y2 = cos(x);
hold on
plot(x,y1,'linewidth',1.0,'linestyle','.','color','r')
plot(x,y2,'linewidth',1.0,'linestyle','.','color','b')
grid
xlabel('x')
ylabel('y')
title('y1 = sin(x) and y2=cos(x)')
legend ('sin(x)','cos(x)',-1)
axis([ -5 5 -1 1])% cho phep tao gio han cua he truc xoy
axis on % cho phep bo he truc toa do xoy.
% lenh grid : tao mang luoi , lenh xlabel(x) : gian nhan truc x, lenh
% title( y = sin(x)): gang nhan cho do thi.
% lenh hold on : dung de giu 2 do thi tren cung 1 he toa do.
% End or program.
Bài 21 : Vẽ sin(x) và cos(x) trên 2 hệ tọa độ xy nhưng cùng
trong 1 khung
%Begining of program
x = -2*pi:pi/100:2*pi;
y1 = sin(x);
y2 = cos(x);
subplot(2,1,1) % lệnh cho phét tạo ra những khung chứa
plot(x,y1,'linewidth',1.0,'linestyle','o','color','m')
grid
xlabel('x')
ylabel('y')
title('y1 = sin(x)')
legend ('sin(x)',-1) % lệnh cho phép hiện thị tên và màu của hàm
vẽ.
subplot(2,1,2) % lệnh cho phét tạo ra những khung chứa
plot(x,y2,'linewidth',1.0,'linestyle','.','color','r')
grid
xlabel('x')
ylabel('y')
title('y2 = cos(x)')
legend ('cos(x)',-1) % lệnh cho phép hiện thị tên và màu của hàm
vẽ.
% End of program
% lenh grid : tao mang luoi , lenh xlabel(x) : gian nhan truc x, lenh
% title( y = sin(x)): gang nhan cho do thi.
Bài 22 : Vẽ sin(x) , cos(x), sinc(x) và 1 - sin(x) trên 4 hệ tọa độ
xy nhưng
cùng trong 1 khung :
%Begining of program
x = -2*pi:pi/100:2*pi;
y1 = sin(x);
y2 = cos(x);
y3 = sinc(x);
y4 = 1 - sin(x);
subplot(2,2,1)
plot(x,y1,'linewidth',1.0,'linestyle','.','color','m')
grid
xlabel('x')
ylabel('y')
title('y1 = sin(x)')
legend ('sin(x)',-1)
subplot(2,2,2)
plot(x,y2,'linewidth',1.0,'linestyle','.','color','b')
grid
xlabel('x')
ylabel('y')
title('y2 = cos(x)')
legend ('cos(x)',-1)
subplot(2,2,3)
plot(x,y3,'linewidth',1.0,'linestyle','.','color','r')
grid
xlabel('x')
ylabel('y')
title('y3 = sinc(x)')
legend ('sinc(x)',-1)
subplot(2,2,4)
plot(x,y4,'linewidth',1.0,'linestyle','.','color','g')
grid
xlabel('x')
ylabel('y')
title('y4 = 1 - sin(x)')
legend ('1-sin(x)',-1)
% End of program
Bài 23: Vẽ sin(x) , cos(x) trên 2 hệ tọa độ xoy nhưng cùng
trong 1 khung, 1 sin(x) và
1 - cos(x) trên 2 hệ tọa độ xoy nhưng cùng trong 1 khung
%Begining of program
x = -2*pi:pi/100:2*pi;
y1 = sin(x);
y2 = cos(x);
y3 = 1 - sin(x);
y4 = 1 - cos(x);
figure
subplot(2,2,1)
plot(x,y1,'linewidth',1.0,'linestyle','.','color','m')
grid
xlabel('x')
ylabel('y')
title('y1 = sin(x)')
subplot(2,2,2)
plot(x,y2,'linewidth',1.0,'linestyle','.','color','b')
grid
xlabel('x')
ylabel('y')
title('y2 = cos(x)')
figure
subplot(2,2,3)
plot(x,y3,'linewidth',1.0,'linestyle','.','color','r')
grid
xlabel('x')
ylabel('y')
title('y3 = 1 - sin(x)')
subplot(2,2,4)
plot(x,y4,'linewidth',1.0,'linestyle','.','color','g')
grid
xlabel('x')
ylabel('y')
title('y4 = 1 - cos(x)')
% End of program
Bài 24 : dùng lệnh while để tính tổng chuỗi : s = x^n/n!
Cách 1:
%dung lenh while and for tinh tong s = x^n/n!
n = input('Enter n :');
x = input('Enter x :');
i = 1;
s = 0;
while i <= n; % ( kiểm tra I có < = n hay ko? Nếu <= thì bắt đầu thực
hiện vòng
lặp mới).
fact = 1;
for k = 1:i;
fact = fact*k;
end
s = s + (x^i)/fact;
i = i + 1;
end
disp(s)
% end of program
Caùch 2: chỉ dùng lệnh while để tính :
%dung lenh while and for tinh tong s = x^n/n!
n = input('Enter n :');
x = input('Enter x :');
i = 1;
k =1;
s = 0;
fact = 1;
while k <= n;
fact = fact*k;
s = s + (x^i)/fact;
k = k + 1;
i = i + 1;
end
disp(s)
% end of program
Bài 25 : cách dùng leänh if elseif else :
% cach dung lech if elseif else
con = 'y'
while con == 'y'
n = input('Enter any number:');
if n > 0
disp('positive') ;
elseif n < 0
disp('Negative') ;
else
disp('Zero') ;
end
con =input('continue y/n:','s');
end
% End of progam
Bài 26 : Vẽ đồ thị hình ellips :
%Begining of program _ve do thi hing ellips:
a = input('Enter a :'); % nhap a = 5
b = input('Enter b :'); % nhap b = 4
c = input('Enter c :'); % nhap c = 4
d =input('Enter d :'); % nhap d = 8
t = 0:pi/100:2*pi;
x = a + c*cos(t);
y = b + d*sin(t);
set(gcf,'DefaultTextColor','g'); % mặc định văn bản hiển thị trên đồ thị
là màu
xanh lá cây. .
plot(x,y,'b'),xlabel('X'),ylabel('Y'),grid;
title('Do Thi Hinh Ellips'); % tạo tên cho đồ thị
%End of program.
Bài 27: : Vẽ đồ thị hình ellips có thể thay đổi nét vẽ
%Begining of program _ve do thi hinh ellips:
a = input('Enter a :'); % nhap a = 5
b = input('Enter b :'); % nhap b = 4
c = input('Enter c :'); % nhap c = 4
d =input('Enter d :'); % nhap d = 8
t = 0:pi/100:2*pi;
x = a + c*cos(t);
y = b + d*sin(t);
h = plot( x,y,'b' ),xlabel('X'),ylabel('Y'),grid;
set(h,' linewidth ',3);% thay doi do rong cua net ve .
h = get( gca,'xlabel' );% chon doi tuong la nhan cua truc x .
set(h,' FontSize ' ,18);% tang co chu cua nhan truc x.
h = get(gca,'ylabel');
set( h,' FontSize ' ,18 );
title( ' Do Thi Hinh Ellips ' );
%End of program
Baøi 28: các lệnh viết chương trình giao diện nút điều khieån:
%chuong trinh chay cos va sin theo nut dieu khien
h=figure('position',[100 100 850
550],'menubar','none','numbertitle','of','name','NUT DIEU KHIEN')
h0=uimenu('parent',h,'label','FILE')
% lenh : uimenu : tao he thong thuc don trong cua so gio dien.
%lenh: ‘lable’,’FILE’ : cho phep tao ten nhan la FILE tren thanh menubar.
uimenu('parent',h0,'label','RUN','callback','chaySIN')
% tao con cua FILE co ten danh nhan la RUN
uimenu('parent',h0,'label','CLOSE','callback','close')
% tao con cua FILE co ten danh nhan la CLOSE
uicontrol('parent',h,'style','pushbutton','position',[120 20 100
30],'string','chaySIN',....
'backgroundcolor','g','foregroundcolor','r','visible','on','callback','chaySIN')
% Tao nut dieu khien chay chuong trinh la do thi hinh SIN duoc luu trong m-file.
% lenh:'parent',h, : la thuoc tinh cha do la cua so figure.
% lenh: 'style','pushbutton' : thuoc tinh tao nut dieu khien push.
% lenh: 'position' : la thuoc tinh vi tri dinh vi cua nut dieu khien.
% lenh: 'BackgroundColor' : la thuoc tinh tao mau nen cho cac nut dieu khien.
% lenh: 'ForegroundColor' : la thuoc tinh tao mau van ban cho cac nua dk.
% lenh : 'callback': la thuoc tinh goi cac chuong trinh ung dung voi gia
% tri la ten cua chuong trinh duoc luu duoi dang m-file.
% lenh: 'Visibel': la thuoc tinh hien thi voi 2 gia tri 'on' of 'of' cac
% nut dieu khien khi chon lenh nay.
h1=uimenu('parent',h,'label','EDIT')
%lenh cho phep tao ten nhan la EDIT tren thanh menubar.
uimenu('parent',h1,'label','CLEAR','callback','clc')
% tao con cua EDIT co ten danh nhan la 'clc'khi nhan no se lam sach cua so
Window
uimenu('parent',h1,'label','CLOSE','callback','close')
% tao con cua EDIT co ten danh nhan la 'close'
uicontrol('parent',h,'style','pushbutton','position',[630 20 100
30],'string','chayCOS',.....
'backgroundcolor','y','foregroundcolor','r','callback','chayCos')
% Tao nut dieu khien chay chuong trinh la do thi hinh COSIN duoc luu
trong
% m-file.
axes('parent',h,'position',[0.1 0.2 0.35 0.7])
%cho phep tao he truc xy cua do thi sin(x) o vi tri [0.1 0.2 0.35 0.7]
axes('parent',h,'position',[0.55 0.2 0.35 0.7])
%cho phep tao he truc xy cua do thi cos(x) o vi tri [0.55 0.2 0.35 0.7]
% End of program.
Baøi 35 : vẽ hình tròn và hình elips trên cùng 1 hệ trục tọa
độ :
%begining
a1 = input('nhap
a1 : ')
b1 = input('nhap
b1 : ')
r = input('nhap r :
')
a2 = input('nhap
a2 : ')
b2 = input('nhap
b2 : ')
r1 = input('nhap
r1 : ')
r2 = input('nhap
r2 : ')
t = 0:pi/100:2*pi ;
;% nhap
= 5.
;% nhap
= 4.
;% nhap
4.
;% nhap
= 3.
;% nhap
= -2.
;% nhap
7.
;% nhap
2.
a1
b1
r=
a2
b2
r1 =
r2 =
x1 = a1 +
r*cos(t);
y1 = b1 + r*sin(t);
x2 = a2 + r1*cos(t);
y2 = b2 + r2*sin(t);
set(gcf,'defaulttextcolor','b')
% mac dimh van ban la mau xanh dam.
h = plot(x1,y1,'r',x2,y2,'b'),grid ;
set(h,'linewidth',3)
axis('square')
xlabel('X')
h1 = get(gca,'xlabel');
set(h1,'fontsize',10)
set(gca,'xtick',-8:10)
ylabel('Y')
h2 = get(gca,'ylabel');
set(h2,'fontsize',10)
set(gca,'ytick',-8:10)
title('ELIP & DUONG TRON')
h3 = get(gca,'title');
set(h3,'fontsize',15)
%end of program.
Baøi 37 : Vẽ 2 hình Elips trên cùng 1 hệ trục tọa ñoä :
%Beginning of program
t = 0:pi/100:2*pi;
x1 = 3 + 6*cos(t);
y1 = -2 + 9*sin(t);
x2 = 7 + 2*cos(t);
y2 = 8 + 6*sin(t);
set(gcf,'DefaultTextColor','red') % tao mau mac dinh
h1 = plot(x1,y1, 'r',x2,y2,'b');
set(h1,'LineWidth',2.25);
axis('square');
xlabel('X')
h = get(gca,'xlabel');
set(h,'FontSize',16);
set(gca,'XTick',-4:10); % tao 15 diem tren truc hoanh x
ylabel('Y')
h = get(gca,'ylabel');
set(h,'FontSize',16)
set(gca,'YTICK',-12:2:12); % taqo 14 diem tren truc y
title('Graphs of (x-3)^2/36 + (y+2)^2/81 = 1 and (x-7)^2/4+(y-8)^2/36 = 1')
h = get(gca,'title');
set(h,'FontSize',12);
grid
%End of progra
Bài 41: vẽ đồ thị 3 chiều :
% Begining of program :
[x,y] = meshgrid(-1:0.05:1);
z = x.^2+y.^2;
subplot(2,2,1);
surf(x,y,z,'Edgecolor','r'),title('hamsurf');
subplot(2,2,2);
surfc(x,y,z,'Edgecolor','b'),title('hamsurfc');
subplot(2,2,3);
mesh(x,y,z,'Edgecolor','g'),title('hammesh');
subplot(2,2,4);
plot3(x,y,z,'linewidth',2.5,'linestyle','.','color','m'),title('hamplot3');
% End of program.
Baøi 43 : Vẽ đồ thị sin(x) và cos(x) chạy bám động trên cùng
hệ trục x y :
% ve do thi chay sin(x) va cos(x) tren cung he truc xy:
clear
x = 0;
y1 = sin(x);
y2 = cos(x);
hold on
p1 = plot(x,y1,'.','EraseMode','none','MarkerSize',5,'color','m');
p2 = plot(x,y2,'.','EraseMode','none','MarkerSize',5','color','g');
axis([0 16.5 -1.2 1.2]),grid
hold on
for x = 0:pi/100:5*pi;
y1 = sin(x);
y2 = cos(x);
set(p1,'XData',x,'YData',y1)
set(p2,'XData',x,'YData',y2)
xlabel('X'),ylabel('Y')
title('ve do thi sin(x) va cos(x)chay theo diem tren cung he truc xy')
drawnow
pause(0.01)
end
%end of program.
Bài 44: Vẽ dạng sóng hình sin của ñieän 3 pha :
% ve do thi chay sin(x) va cos(x) tren cung he truc xy:
clear
x = 0;
y1 = sin(x);
y2 = sin(x-2*pi/3);
y3 = sin(x+2*pi/3);
hold on
p1 = plot(x,y1,'.','EraseMode','none','MarkerSize',5,'color','m');
p2 = plot(x,y2,'.','EraseMode','none','MarkerSize',5','color','g');
p3 = plot(x,y3,'.','EraseMode','none','MarkerSize',5','color','r');
axis([0 16.5 -1.2 1.2]),grid
hold on
for x = 0:pi/100:5*pi;
y1 = sin(x);
y2 = sin(x-2*pi/3);
y3 = sin(x+2*pi/3);
set(p1,'XData',x,'YData',y1)
set(p2,'XData',x,'YData',y2)
set(p3,'XData',x,'YData',y3)
xlabel('X'),ylabel('Y')
title('ve dang song hinh sin dien 3pha')
drawnow
pause(0.01)
end
%end of program
Bài 53 : tính tổng S = tổng [ x(i) / i! ] :
Trường hợp giá trị x(i) khác nhau:
% tinh tong[x(i)/i!]
n = input('Enter nhap n :');
i = 1;
s = 0;
fact = 1;
k = 1;
while i <= n
x(i) = input('Nhap gia tri x(i) :');
fact = fact*k;
s = s + x(i)/fact;
i = i +1;
k = k + 1;
end
s
% End of program.
Ví Dụ Như :
Enter nhap n :3
Nhap gia tri x(i) :2
Nhap gia tri x(i) :3
Nhap gia tri x(i) :4
s=
4.1667
Trường hợp giá trị x(i) giong nhau :
% tinh tong[x/i!]
n = input('Enter nhap n :');
x = input('Nhap gia tri x :');% Gia tri cua x bang nhau
i = 1;
s = 0;
k = 1;
while i <= n
fact = 1;
for k = 1:i
fact = fact*k;
end
s = s + x/fact;
i = i +1;
end
s
% End of program.
Ví Dụ Cụ Thể :
Enter nhap n :4
Nhap gia tri x :2
s=
3.4167
Baøi 54 : chuong trinh tinh tong day so : s = x/1 + x^2/2! - x^3/3! x^4/4! +
x^5/ 5! + x^6/6! – x^7/7! – x^8/8! …
% chuong trinh tinh tong day so : s = x/1 + x^2/2! - x^3/3! - x^4/4!...
clear
n = input('Enter n :');
x = input('Enter x :');
i = 1;
count = 1;
sum = 0 ;
while i <= n
fact = 1;
for k = 1:i
fact = fact*k;
end
if count == 1
sum = sum + x^i/fact;
elseif count == 2
sum = sum + x^i/fact;
else
sum = sum - x^i/fact;
end
count = count + 1;
if count == 5
count = 1 ;
end
i = i + 1;
end
sum
% End of program .
Ví Dụ Như :
Enter n :8
Enter x :2
sum =
2.3238
Hoặc
Enter n :4
Enter x :2
sum =
2.0000
Bài 55 : Chương trình tính tổng dãy số :
S = 2+x^3/3! + x^6/6! + x^9/9! +...+ x^n/n!
% Begining of program : s = 2+x^3/3! + x^6/6! + x^9/9! +...+ x^n/n!
clear
n = input('Enter n :');
x = input('Enter x :');
i = 3;
count = 3;
sum = 2 ;
while i <= n
fact = 1;
for k = 1:i
fact = fact*k;
end
if count == 3
sum = sum + x^i/fact;
else
sum = sum ;
end
count = count + 1;
if count == 6
count = 3 ;
end
i = i + 1;
end
sum
%End of program .
Ví Dụ Như :
Enter n :9
Enter x :2
sum =
3.4236
Bai 61: Vẽ Đồ Thị Nội Suy 2 Chiều :
% begining of program
years = 1950:10:1990;
service = 10:10:30;
wage = [150.697 199.592 187.625;197.323 195.072 250.287;....
203.212 179.092 322.767;226.505 153.706 426.730;249.633 120.281
598.234];
x = 10:1:30;
y = 1950:2:1990;
z = interp2(service,years,wage,15,1975);
[x,y] = meshgrid(10:1:30,1950:2:1990);
z = interp2(service,years,wage,x,y);
surf(x,y,z)
% End of program
Lập trình với Script m-file.
a. Chương trình vẽ đường trịn tâm (3,2) và bán kính 3.
% ve duong tron tam 3,2
t = 0:pi/100:2*pi;
x = 3 + 3*cos(t);
y = 2 + 3*sin(t);
plot(x,y,'b','linewidth',1.5 ,'linestyle' , '+' ),grid
xlabel('x')
ylabel('y')
title('ve duong tron tam 3 2')
% End of program .
% lệnh ‘linewidth’ : dùng cài đặt độ rộng nét vẽ.
% lệnh ‘linestyle’ cài đặt kiểu của nét vẽ.
Sinh viên tự viết 1 Script m-file có nhiệm vụ vẽ 1 hình Sin
% Begin of program
x = 0:pi/100:2*pi ;
y = sin(x) ;
plot(x,y,'b','linewidth',1.5 ,'linestyle' , '+' ),grid
xlabel('x')
ylabel('y')
title('ve do thi y = sin(x)')
% End of program
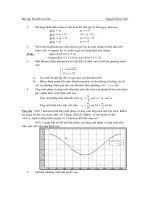
Bai 56
Sinh viên tự thực hiện đồ thị sau
% Begin of program
t = 0:pi/100:4*pi;
y1 = 4*t.^2.*sin(t);
y2 = 100*sin(t.^2);
plot(t,y1,t,y2);
Xlabel('thoi gian');
ylabel('bieu do');
axis([0 10 -300 300]);grid
title(' do thi y1 = 4*t.^2.*sin(t) va 100*sin(t.^2)')
% End of program
Chương trình 2 :
% Begin of program
t = 0:pi/100:4*pi;
y1 = 4*(t.^2).*sin(t);
y2 = 100*sin(t.^2);
plot(t,y1,t,y2);
Xlabel('thoi gian');
ylabel('bieu do');
axis([0 10 -300 300]);grid ;
title(' do thi y1 = 4*t.^2.*sin(t) va 100*sin(t.^2)');
% End of program
Hay ta có thể gõ trực tiếp các lệnh trong cửa sổ CommadWindow như sau:
>> t = 0:pi/100:4*pi;
>> y1 = 4*t.^2.*sin(t);
>> y2 = 100*sin(t.^2);
>> plot(t,y1,t,y2);
>> Xlabel('thoi gian');
>> ylabel('bieu do');
>> axis([0 10 -300 300]);
>> grid on
>> title(' do thi y1 = 4*t.^2.*sin(t) va 100*sin(t.^2)') ;
Chương trình vẽ 2 đồ thi y = sin(x) và z = x.*sin(x) trên 2 khung trên
cùng một cửa sổ Figue:
%Begining of program
x = 0:pi/100:2*pi;
y = sin(x);
z = x.*sin(x);
subplot(2,1,1) % lenh cho phet tao ra nhung khung chua
plot(x,y,'linewidth',1.0,'linestyle','o','color','b')
grid
xlabel('x')
ylabel('y')
title('y = sin(x)')
legend ('sin(x)',-1) % lech cho phep hien thi ten va mau do thi ve
subplot(2,1,2) % lệnh cho phét tạo ra những khung chứa
plot(x,z,'linewidth',1.0,'linestyle','.','color','r')
grid % lenh tao mang luoi