World population | Lớp 11, Tiếng Anh - Ôn Luyện
Bạn đang xem bản rút gọn của tài liệu. Xem và tải ngay bản đầy đủ của tài liệu tại đây (220.2 KB, 19 trang )
<span class='text_page_counter'>(1)</span><div class='page_container' data-page=1>
<b>D. WRITTING</b>
</div>
<span class='text_page_counter'>(2)</span><div class='page_container' data-page=2></div>
<span class='text_page_counter'>(3)</span><div class='page_container' data-page=3></div>
<span class='text_page_counter'>(4)</span><div class='page_container' data-page=4></div>
<span class='text_page_counter'>(5)</span><div class='page_container' data-page=5>
Vocabulary
Account for (v): Chi mế
Rank (v): <sub>Put sb/sth in certain position:</sub> <sub>X p h ng</sub><sub>ế</sub> <sub>ạ</sub>
Chart (n): Bi u đ ể ồ
</div>
<span class='text_page_counter'>(6)</span><div class='page_container' data-page=6>
<b>Match the words with their meaning</b>
Account for
Rank
Chart
unevenly
Không đ ng đ u
ồ
ề
Bi u đ
ể
ồ
Chi m
ế
</div>
<span class='text_page_counter'>(7)</span><div class='page_container' data-page=7>
Task 1: Ask ss work in pairs and answer the
questions:
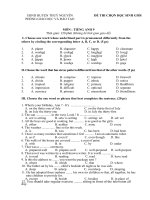
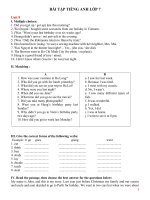
1. What the topic of the pie
chart?
2. How many region are there?
What they are?
3. Which region has the largest
population?
4. Which region has the second
largest population?
5. Which region has the smallest
population ?
6. Is the population of europe
larger or smaller than Africa
<b>Oceania</b>
<b>2%</b>
<b> South Asia </b>
<b> 32 %</b>
<b>East Asia </b>
<b> 26% </b>
<b>Europe </b>
<b> 15%</b>
<b>Africa </b>
<b>11%</b>
<b>La<sub>tin </sub></b>
<b>Am</b>
</div>
<span class='text_page_counter'>(8)</span><div class='page_container' data-page=8>
1. What is the topic of the chart?
</div>
<span class='text_page_counter'>(9)</span><div class='page_container' data-page=9>
2. How many region are there? What they are?
<i> There are 7 region. They are: Oceania, South Asia, </i>
</div>
<span class='text_page_counter'>(10)</span><div class='page_container' data-page=10>
3. Which region has the largest population?
</div>
<span class='text_page_counter'>(11)</span><div class='page_container' data-page=11>
4. Which region has the second largest
population?
</div>
<span class='text_page_counter'>(12)</span><div class='page_container' data-page=12>
5. Which region has the smallest population ?
</div>
<span class='text_page_counter'>(13)</span><div class='page_container' data-page=13>
6. Is the population of europe larger or smaller
than Africa
</div>
<span class='text_page_counter'>(14)</span><div class='page_container' data-page=14>
<i>The chart shows the distribution of world population by region. </i>
<i>It can be seen from the chart that the world population is</i>
<i> in the South-East Asia. It 58% </i>
<i>of the world population. Especially, the population of East Asia is </i>
<i> double the population of Africa. The population of </i>
<i>Northern American is the population of Africa. In </i>
<i>comparison with the other region, the Oceania </i>
<i>last, about 2%. Finally the population of Latin America is 2% more </i>
<i>than the one of Northern American, about 8%.</i>
<i>more than</i>
<i>ranks</i>
<i>accounts for </i>
</div>
<span class='text_page_counter'>(15)</span><div class='page_container' data-page=15>
1. How many part are there in a chart description?what are they?
2. How should we put the figures, in random, or in logical order?
3. what information should we pay attention to a chart?
4. Should we use personal language or impersonal language?
5. Which of the following statements should be use?
A. we can see that……..
B. I could relize that ………
C. As can be seen from the chart……….
D. it can be seen from the chart that……….
</div>
<span class='text_page_counter'>(16)</span><div class='page_container' data-page=16>
<b>Some expression are often used in the chart describing </b>
1. Three parts: introduction – body – conclision
2. In logical order
3 Pay attention in figures, rate, caption words, general trend,
4 Use impersonal language
5. Use statements:
- as can be seen from the chart ....
- it can be seen from the chart that ...
6.
- The chart show that...
- the chart presents
</div>
<span class='text_page_counter'>(17)</span><div class='page_container' data-page=17>
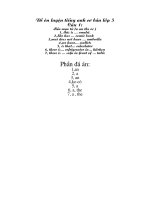
<b>The Red River Delta</b>
<b>19%</b>
<b>North Central Coast </b>
<b>13%</b>
<b>South Central Coast</b>
<b>9%</b>
<b>Central Highlands</b>
<b>5%</b>
<b>Southeast</b>
<b>The Mekong </b>
<b>Delta</b>
<b>Middle lands of </b>
<b>Northern</b>
<b>18%</b>
<b>20%</b>
</div>
<span class='text_page_counter'>(18)</span><div class='page_container' data-page=18>
• The chart shows the distribution of Vietnam population by
region. It can be seen that, the Vietnam population is
distributed unevenly.
• Central Highlands is least populated with only 5%. North
Central Coast is higher than Central Highland with the rate
of 13%. Middle Lands of Northern is more than double
population of the South Central Coast. The Red River Delta
accounts for 19 % of Vietnam population and Southeast is a
bit lower with only 16%. The Mekong Delta has the largest
population with 20% and ranks first in all regions in
Vietnam.
</div>
<span class='text_page_counter'>(19)</span><div class='page_container' data-page=19></div>
<!--links-->