DỰ BÁO KHẢ NĂNG NGẬP LỤT KHI VỠ ĐẬP THỦY ĐIỆN PẮC CÁP TRÊN SÔNG NÀ RÌ TỈNH BẮC KẠN
Bạn đang xem bản rút gọn của tài liệu. Xem và tải ngay bản đầy đủ của tài liệu tại đây (582.26 KB, 7 trang )
<span class='text_page_counter'>(1)</span><div class='page_container' data-page=1>
<b>FORECASTING THE RISK OF FLOODING WHEN THE PAC CAP </b>
<b>HYDROPOWER DAM BREAKS ON NA RI RIVER IN BAC KAN PROVINCE </b>
<b>Pham Thi To Oanh </b>
<i>Vietnam Cooperative Alliance </i>
ABSTRACT
Pac Cap hydropower was approved investment policy in Decision No.96/QĐ-UBND dated
18/01/2018 on Na Ri River, Na Ri district, Bac Kan province with the capacity of 6MW. During
the construction and operation of 02 units, dam breakdown can occur when the crests of dams,
horizontal cracking and cracking along the dam, sliding roof upstream and downstream of the
dam, etc. This study focused on simulation of breakage occurrence using the Mike Flood model.
The results show that the largest flood depth would be over 10 meters with the flooded area of
about 15 hectares, which is mainly land for annual crops, rice land and production forests; depth
from 4 to 10 meters would occupy about 10 hectares; depth of 1 to 4 meters in addition to the
forest land and inundated agricultural land would engulf about 30 houses in Luong Thanh and Lam
Son communes of Na Ri district and some other infrastructure projects. The results of the study are
the basis for introducing preventive measures to minimize the damage to the downstream area, as
well as to determine the responsibility of the plant in the compensation process if the incident
<b>occurs. </b>
<i><b>Keywords: hydropower; risk; dam break; model; inundation</b></i>
<i><b>Received: 12/8/2020; Revised: 17/11/2020; Published: 30/11/2020 </b></i>
<b>DỰ BÁO KHẢ NĂNG NGẬP LỤT KHI VỠ ĐẬP THỦY ĐIỆN PẮC CÁP </b>
<b>TRÊN SÔNG NÀ RÌ TỈNH BẮC KẠN </b>
<b>Phạm Thị Tố Oanh </b>
<i> Liên minh Hợp tác xã Việt Nam </i>
TÓM TẮT
Thủy điện Pác Cáp được phê duyệt chủ trương đầu tư tại Quyết định số 96/QĐ-UBND ngày
18/01/2018 trên sơng Na Rì, huyện Na Rì tỉnh Bắc Kạn với cơng suất 6 MW. Trong q trình thi
cơng, vận hành 02 tổ máy, vỡ đập có thể xảy ra khi lũ tràn đỉnh đập, nứt ngang nứt dọc đập, trượt
mái thượng và hạ lưu đập,… Nghiên cứu này tập trung mô phỏng sự cố vỡ đập thông qua việc sử
dụng mơ hình Mike Flood. Kết quả chỉ ra rằng: chiều sâu ngập lớn nhất >10 m với diện tích ngập
lụt khoảng 15 ha trong đó chủ yếu là đất trồng cây hàng năm, đất lúa và rừng sản xuất; chiều sâu
ngập từ 4-10 m chiếm khoảng 10 ha; chiều sâu từ 1-4 m ngoài các loại đất rừng và đất nơng
nghiệp bị ngập cịn nhấn chìm khoảng 30 ngơi nhà của xã Lương Thành và Lam Sơn thuộc huyện
Na Rì và một số cơng trình hạ tầng khác. Kết quả nghiên cứu là cơ sở đưa ra các biện pháp phòng
tránh nhằm giảm thiểu tác hại đến vùng hạ lưu cơng trình, đồng thời cũng là căn cứ để xác định
trách nhiệm của Nhà máy trong quá trình bồi thường nếu để sự cố xảy ra.
<i><b>Từ khóa: Thủy điện; rủi ro; vỡ đập; mơ hình; ngập lụt</b></i>
<i><b>Ngày nhận bài: 12/8/2020; Ngày hoàn thiện: 17/11/2020; Ngày đăng: 30/11/2020 </b></i>
<i>Email: </i>
</div>
<span class='text_page_counter'>(2)</span><div class='page_container' data-page=2>
<i>Pham Thi To Oanh </i> TNU Journal of Science and Technology 225(13): 94 - 100
<b>1. Introduction </b>
On 23/7/2018, a hydropower plant dam in
Laos broke down, killing at least 26 people,
leaving 6,000 people homeless and around
25,000 people were forced to evacuate. In
Vietnam, safety hazards in many hydropower
plants show the importance of building
preventative measures as soon as a
hydropower plant is being built. Pac Cap
hydropower plant was approved by Decision
No 96/QDD-UBND dated 18/01/2018 on Na
Ri River, Na Ri district, Bac Kan province
with the capacity of 6MW. During the
construction and operating 2 units, dam
breakdown can happen when floods pass the
top of the dam, vertical and horizontal
cracking, roof sliding at upstream and
downstream. According to the dam safety
handbook and recent research toward dam
breakdown, dam breakdown simulation, the
severity and the area of flood downstream can
be evaluated [1]-[4]. This is the basis to not
only carry out preventative measures in order
to reduce the damage dealt to downstream
areas, but also to identify the responsibility of
the plant during the indemnification process if
an incident occurs.
<b>2. Research methods </b>
This paper used multiple methods, both
traditional and modern within the field of
nature and environment to collect and process
data, statistically analyze, investigate and
field survey in combination with math models
(the primary method in this paper).
River hydraulic simulation and flooding
process has been mentioned by scientists for a
long time and specific programs have been
built such as: Mike Flood (Denmark), Hec
Ras (USA), WENDY (Holland), some
programs from Vietnam such as: VRSAP by
Nguyen Nhu Khue, KOD-01 by Nguyen An
Nien, FWQ86M by Nguyen Tat Dac,
HGKOD by Nguyen The Hung, HYDROGIS
from The Institute of Meteorology and
Hydrology... These models can all be applied
to calculate the risk of dam breakdown based
on the research on cracking lines, experiments
on physical models and retrieved data from
recent years [5], [6].
Even though each model has its good and bad
points, they all try to simulate an exact map of
flood level when the dam breaks.
Tingsanchali [7] realised that using Hec Ras
or WENDY to calculate the biggest amount
of water show about twice bigger than the
amount observable; MIKE model show the
total amount of water is as approximately 0.2
times as the measured value. At the same
time, MIKE also provides a more complete
look into the dam breakdown, simulates
flooded areas, combines with graphical maps
to help display the spread of the flood [7].
Utilizing MIKE FLOOD to simulate floods
has many advantages. For instance, it’s
dynamic in calculation and changing
scenarios; the simulated areas are quite large
and it costs less than using physical models.
However, one of its disadvantages is that it
has too much data input..
<b>3. General information about Pac Cap </b>
<b>hydropower plant and the cause of dam </b>
<b>breakdown </b>
In 2010, Bac Kan People’s Committee
approved Decision No 2461/QĐ-UBND
about Planning of medium and small
hydropower plants. Pac Cap hydropower
plant was in the list of plants with good
economic parameters: 3.2 MW capacity, total
power output Eo= 13.18 million kWh, mND =
323m on Na Ri river, Luong Thanh
commune, Na Ri district (Figure 1). However,
in 2018, the area was surveyed, recalculated
and updated with new technologies with the
new capacity of 6MW and Bac Kan People’s
Comittee approved the investment plan at
Decision No 96/QĐ-UBND on 18/01/2018.
The main parameters are as follow: MND =
246.5m, MNC = 245.5m, annually average
output Eo= 21.26 mil kWh. Coordinate:
220<sub>12’38” N, 106</sub>0<sub>07’48” E, F</sub>
</div>
<span class='text_page_counter'>(3)</span><div class='page_container' data-page=3>
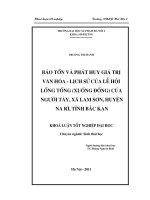
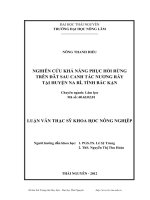
<i><b>Figure 1. Pac Cap Hydropower plant position </b></i> <i><b>Figure 2. Dam typical geological section </b></i>
<i><b>Focal area and dam topography: The dam is </b></i>
located on the section of a river that has a
cross section in V shape. Surface topography
on both side of the river bank is steep, with
the height ranging from +235m to +305m.
Topography is influenced by reformation
activities, a process in which rocks are raised,
speed up the erosion to form eroding
topography. The surface area consists of
mainly weathered ruins and not many of
accumulated terrain, mainly a thin layer of
pebble in the soil.
<i><b>Geological condition: The project is within </b></i>
Na Ri river stratum, acidic erupted rocks with
Rionit ingredients, petrology ingredients are
powder sand, rock, shale and pebbles. These
rocks usually appear on mountain slopes, Na
Ri river banks and small streams. The majority
below the surface is layers of Ruins (elQ),
alluvial (alQ) and slope (elQ). The thickness of
each layer is around 1-4m. The main ingredients
are sand or clay with a lot of dirt, in small sizes
in blue white or grey yellow. The section of the
dam is presented at Figure 2.
<i><b>Earthquake: On the map of Vietnam </b></i>
earthquake with a cycle T = 500 years on a
scale of 1:2000000, Pac Cap hydropower
plant is in the area with earthquake level VII.
Overall, the area is in the Na Kep – Pac Cap
Fx Fissures. These are fissures within the
tectonic plate differences between zones, but
their existences also create changes in the
area geological structure. The fissures
develop following North East – South West,
travelling upstream 800m from the dam and
following the right bank of the river.
<i><b>The structure of spillways and raising dam: </b></i>
<i>- Rising dam: Gravity concrete structure, core </i>
</div>
<span class='text_page_counter'>(4)</span><div class='page_container' data-page=4>
<i>Pham Thi To Oanh </i> TNU Journal of Science and Technology 225(13): 94 - 100
removed and reinforced with concrete 15m
long, 2m thick.
With the structure and design of the dam
combined with local topography evaluation, the
reasons for dam breaking are predicted as follow:
- The first cause might be flaws in design,
construction. Local geological features were
not paid attention, so some details were not
appropriate and operations failed to follow
safety procedures. Some structure details and
equipment which were not handled
appropriately also affect the safety of the
dam. In time, some parts of the dam or
equipment did not receive enough
maintenance causing a threat to the safety of
the whole dam. In addition, there was a lack
of emergency energy supply for spillways.
- The dam is on unstable ground; therefore, its
safety can be affected by sliding, erosion on
its foundation. Large and stimulate
earthquakes also make the dam unsafe.
- The amount of input water might exceed the
dam capacity, causing huge, unplanned floods.
The amount of water in the lake exceeding its
capacity can also cause landslide at the shore on
a large scale.
When operating the power plant, all of the
above possibility can happen and cause
massive damage to downstream area.
<b>4. Result and discussion </b>
This paper is written based on three steps: (1)
Calculate the amount of floods coming to the
lake, match with emergency flood scenario;
(2) Simulate dam breaking, (3) Evaluate the
scale, the level of flooding and the effect
toward downstream area.
<i><b>4.1. Calculate the amount of water </b></i>
Na Ri river is a first level tributary to Bac
Giang river and also a confluence for smaller
streams such as Ban Buoc stream (Liem Thuy
commune), Ban Chao stream (Dong Xa
commune)... Because the research area is
small, there is no hydrology station in the
area, therefore it’s necessary to refer to the
data of Thac Gieng hydropower plant data
and some nearby hydrology stations such as
Van Mich, Pac Luong as the basis to
calculate.
Pac Cap hydropower station is a level III
construction project, according to Viet Nam
building regulations (QCVN
04-05:2012/BNNPTNT: National technical
standards, Hydrology construction standard in
design) the design frequency with the main
building is 1,5%, control flood frequency is
0,5%. According to Hydrology design
calculation norm QPTL.C-6-77 to area with
more than 100km2<sub> in size can use shortened </sub>
or Sokolovsky equation to determine amount
of designed floods. The calculation is done by
Sokolovsky equation [8]:
In which, α = 0,77; H0 = 22; f = 0,7; The time
floods rise equal to the time to concentrate
water in the river Tl = , with determined
by the following:
With: the speed in which water is
concentrated is determined by the following
formula = (0,6-0,7) .In which, max is
the maximum average speed at the exit of the
spillways downstream max = 2,8 (m/s).
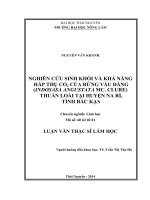
Result is shown at Figure 3.
The relation between the lake and
downstream of the plant: Documents used to
build Q = f(H) line for the plant include
horizontal and vertical cut of the dam and the
plant (from field trip and from 1/2000, 1/500
máp). The relationship of Q = f(H) is
calculated following Sedi-Manhing equation:
</div>
<span class='text_page_counter'>(5)</span><div class='page_container' data-page=5>
<b>Figure</b><i><b> 3. Designed flood at the dam by time </b></i> <b>Figure</b><i><b> 4. The relation between Q =f(H) at </b></i>
<i>downstream Pac Cap hydropower plant </i>
Results are shown in table 1 and Figure 2.
<i><b>Table 1. Q =f(H) at downstream Pac Cap Hydropower plant </b></i>
<b>Q (m3<sub>/s) </sub></b> <sub>0.2 </sub> <sub>9.7 </sub> <sub>51.2 </sub> <sub>129.9 </sub> <sub>241.9 </sub> <sub>385.4 </sub> <sub>556 </sub> <sub>755.8 </sub> <sub>988.2 </sub>
<b>Z(m) </b> 229 230 231 232 233 234 235 236 237
<b>Q (m3<sub>/s) </sub></b> <sub>1247 </sub> <sub>1532 </sub> <sub>1837 </sub> <sub>2170 </sub> <sub>2380 </sub> <sub>2681 </sub> <sub>3002 </sub> <sub>3204 </sub> <sub>3580 </sub>
<b>Z(m) </b> 238 239 240 241 242 243 244 245 246
<i><b>4.2. Simulate dam breaking because of the </b></i>
<i><b>flood </b></i>
This research focus on the danger when Pac
Cap dam broke. The area downstream is
mainly half mountain terrain with no big
river, water will first overflow and after that
concentrate on smaller streams, springs,
creeks in the area and finally will come down
the Delta area. Input data for the simulation:
- Map of the area on a scale of 1/2000.
- Na Ri river horizontal cut section.
- Data on daily, monthly, yearly amount of
rainfall at the dam area (Figure 5,6).
- Relation between H~Q at Thac Gieng hydro
station (Figure 2).
- Data on the frequency line of yearly water
flow (Figure 6), design and control floods at
Pac Cap dam (Figure 3).
- Indexes such as: MNDBT, MNLKT,
MNLTK... taken after design specification of
Pac Cap hydropower plant.
- Hydrology data taken from weather and
hydrology station (Bac Kan and Thac Gieng)
from 1960-1979 and some nearby
hydropower plant such as Van Mich, Pac
Luong with data from 190 to the present day.
Na Ri river hydrological conditions from
1960 to present day is as follow::
+ The amount of water flow daily through the river.
+ The amount of floods and floods process
</div>
<span class='text_page_counter'>(6)</span><div class='page_container' data-page=6>
<i>Pham Thi To Oanh </i> TNU Journal of Science and Technology 225(13): 94 - 100
<b>Figure</b><i><b> 5. Frequency line of the heaviest 1 day rain </b></i>
<i>at Bac Kan station </i>
<b>Figure</b><i><b> 6. Frequency line of yearly water flow at </b></i>
<i>Pac Cap hydropower plant </i>
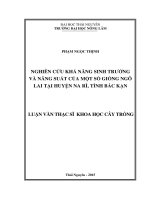
<b>Figure</b><i><b> 7. Simulated flooded areas in case Pac Cap hydropower plant dam break </b></i>
<i><b>4.3 Damage evaluation </b></i>
Simulated results show that, in the case of
dam failure, part of the communes of Van
Minh, Luong Thanh, Lam Son may be
affected with the lowest flood depth of about
1m and the highest of over 10m.
Maximum inundation depth is> 10m, affected
objects are the villages of Na Du, Pac Lieng,
Pac Ban, Na Ngoa, Na Deng, Na Muc, Khuoi
Tuc, Na So, Na Piet, Van Minh commune and
a part of the lower side. The total flooded area
would be around 15ha including 5-7 ha of
annual crops, 4-5 ha of production forest, 2-3 ha
of rice paddies. In the area flooded deeper than
10m, there are no house or people living inside
it and there aren’t any sensitive structure.
The area under 4-10m deep is around 10ha,
all within administration boundary of Luong
Thanh commune, including 2-3ha of rice
paddies, 3-4ha of annual crops, 2.5ha of
production woods and 0.5-1ha of old trees. In
this area, there are 10-20 house scattered near
the river banks, mainly 4-level houses and
semi durable houses would be flooded.
</div>
<span class='text_page_counter'>(7)</span><div class='page_container' data-page=7>
trees, and 1-2 ha of various usage. In addition,
around 50-100 houses with local road,
electricity and other infrastructure in the area
would also be flooded. Even though the water
may not be very deep, it would still cause
major damage in man and properties.
In general, the chance for a dam to break can
happen at any hydropower plant and it’ll
cause many negative effects to local society
and economy, including endangering the lives
of people downstream and workers of the
power plant; damage to the economy,
destroying local infrastructures (traffics,
schools, water, electricity...); polluting the
environment..
Proposals to lessen the chance of dam break
down can be given as follows:
- Before operation, the plant should form
detailed plans for each situation that can
happen. In case the dam loses its safety, workers
and people living downstream have to begin
evacuation to reduce damage to life. It is
necessary to support the local population to
move their belonging from the flooded areas
identified as above.
- It is important to identify the evacuation
limit, where landslides happen and how to
strengthen the shore at downstream and exam
the area to discharge water when there is
flood after the dam breaks.
- It is also necessary to set up alarms, notice
and work with local government to ensure the
safety for people and their properties, boats
and other water travel vehicles downstream to
get to safety. Work with BCH-PCLB and
local authorities to set up rescue attempt when
needed.
<b>5. Conclusion </b>
Results from calculating the research area,
determining areas affected by the incident are
the basis to create methods to prevent and
reduce the damage to the people such as:
evacuation to higher ground based on the
flood activity and priority to heavily flooded
area first and area that lie on the way water
flow. These are also the basis to govern and
find out who’s responsible for the plant when
the indemnification process happens.
Limit: (1) The article has not done the
calibration and model testing. If it is possible
to continue the research direction, after the
plant goes into operation, we will make a
modification of the model. (2) The article has
not determined the time of flooding due to its
large dependence on the Plant's incident
prevention and response plans.
REFERENCES
[1]. Irrigation Project Central Management Board,
<i>Handbook dam safety, 2012. </i>
<i>[2]. D. D. Do, Research and evaluation of the </i>
<i>Ham Thuan - Da Mi dam failure model to the </i>
<i>downstream of La Nga river, proposing </i>
<i>measures to prevent and minimize damage, </i>
Southern Institute of Water Resources
Planning, 2009.
<i>[3]. Ha Tinh provincial people’s committee, ESIA, </i>
<i>Subproject 1: Dam rehabilitation and safety </i>
<i>improvement project – Ha Tinh province, Ha </i>
Tinh, 2018.
<i>[4]. Institute of Mechanics, Topic KC 08-13, Book </i>
<i>5: Models 1D and 2D simulate the flood </i>
<i>prediction of dam failure, 2004. </i>
[5]. K. Beven, “On the future of distributed
modelling in hydrology,” <i>Hydrological </i>
<i>Processes, vol. 14, no. 14, pp. 16-17, 2000. </i>
<i>[6]. Halcrow Group Limited, Development of </i>
<i>Basin Modelling Package and Knowledge </i>
<i>Base (WUP-A), Mekong River Commission, </i>
<i>Phnom Penh, Cambodia, Technical Reference </i>
Report DSF 620 SWAT and IQQM, ISIS
Models Water Utilisation Project Component
A, 2004.
[7]. T. Tingsanchali, and M. N. Khan, “Prediction
of flooding due to assumed breaching of
<i>Mangla Dam,” 3rd <sub>International Conference </sub></i>
<i>on </i> <i>Hydro-Science </i> <i>and </i> <i>Engineering, </i>
Brandenburg University of Technology,
Cottbus, Berlin, Germany, 1998.
</div>
<!--links-->
Mô hình 1d và 2d mô phỏng dự báo tình trạng ngập lụt khi vỡ đập, đê
- 81
- 518
- 1


.push({});</script></div> </p><!-- <p class="text-xl pb-40 overlay-read-more absolute bottom-0 left-0 w-full text-center bg-gradient-to-t from-white to-transparent">--><!----><!-- </p>--><!-- </div>--><!-- <a href="javascript:" class="bg-secondary px-6 py-2 rounded text-white absolute bottom-0 left-1/2 mb-4 transform -translate-x-1/2" id="showmore">Xem Thêm</a>--> </div> <div style="position: relative;" class="col-span-3 hidden md:block px-1 text-center"> <div style="position: sticky;top: 10px;width: 300px; height: 600px;"> <ins class="adsbygoogle" style="display:inline-block;width:300px;height:600px" data-ad-client="ca-pub-2979760623205174" data-ad-slot="8377321249"></ins><script defer>(adsbygoogle = window.adsbygoogle || []).push({});</script> </div> </div> </div> <div class="vf_link_relate px-2 my-2"> <h2 class="vf_doc_relate text-2xl font-bold my-4">Tài liệu liên quan</h2> <ul class="grid grid-cols-12 gap-2"> <li class="col-span-6 md:col-span-2"> <div class="card-doc " onclick="actionDocRelated(this)"> <a class="card-doc-img" href="https://text.123docz.com/document/892012-mo-hinh-1d-va-2d-mo-phong-du-bao-tinh-trang-ngap-lut-khi-vo-dap-de.htm" title="Mô hình 1d và 2d mô phỏng dự báo tình trạng ngập lụt khi vỡ đập, đê "> <i class="icon i_type_doc i_type_doc2"></i> <img class="lazy" src="data:image/gif;base64,R0lGODlhAQABAIAAAP///wAAACH5BAEAAAAALAAAAAABAAEAAAICRAEAOw==" data-src="https://media.store123doc.com/images/document/13/ce/us/medium_usm1387298871.jpg" width="124" height="179" alt="Mô hình 1d và 2d mô phỏng dự báo tình trạng ngập lụt khi vỡ đập, đê " onerror="this.src=)