Real-time RT-PCR
Bạn đang xem bản rút gọn của tài liệu. Xem và tải ngay bản đầy đủ của tài liệu tại đây (339.03 KB, 24 trang )
Real-time RT-PCR
9.1 Introduction
The importance of mRNA (transcript) quantification and profiling in basic
research, molecular diagnosis and biotechnology has led to a rapid advance
in quantitative RT-PCR technologies in terms of instrumentation, auto-
mation and chemistries. Real-time RT-PCR represents an advance which has
several advantages over conventional quantitative RT-PCR. The main
advantage of real-time RT-PCR is that it sensitively and reproducibly
quantifies the initial amount of starting template (transcript) by monitor-
ing PCR amplification product (amplicon) accumulation during each PCR
cycle, in contrast to conventional methods which detect the final end
product. Furthermore, real-time RT-PCR is rapid, it is possible to analyze
several transcripts (genes) simultaneously and post-PCR quantification
procedures are eliminated. Because post-PCR analysis is eliminated carry-
over contamination is reduced and a higher throughput can be achieved.
In addition, the dynamic range of real-time RT-PCR is higher (up to 10
10
-
fold) than conventional quantitative RT-PCR (1000-fold), which means that
a wide range of amplification products can be accurately and reproducibly
quantified. Although real-time RT-PCR does have numerous advantages
over conventional methods there are also some disadvantages: higher costs
and the inability to detect amplicon size can make differentiation between
cDNA and DNA amplification difficult.
This Chapter deals with various aspects of real-time RT-PCR including
detection systems and chemistries, oligonucleotide primer and probe
design, real-time thermal cyclers, quantification and control selection,
common pitfalls and applications. There is also a glossary of frequently used
terms (Table 9.1) which will help you to familiarize yourself with the jargon
of real-time RT-PCR.
9.2 Basic principles of real-time RT-PCR
The basic principle of real-time RT-PCR is much like conventional RT-PCR:
cDNA is synthesized from mRNA using reverse transcriptase followed by
cDNA PCR amplification and amplicon quantification. However, there are
two fundamental differences: (i) amplicon accumulation is detected and
quantified using a fluorescent reporter and not by conventional gel electro-
phoresis (Chapter 5); and (ii) amplicon accumulation is measured during
each PCR cycle in contrast to standard end-point detection (Chapters 1 and
5). In addition, real-time RT-PCR is performed in 96-well microtiter plates
and the fluorescent signal (amplicon accumulation) is detected and quanti-
fied using a real-time PCR thermocycler (Section 9.5).
A real-time RT-PCR reaction contains all the components used for
conventional RT-PCR (Chapter 8) but in addition contains a fluorescent
9
reporter either in the form of a fluorescent DNA-binding dye or as a
fluorescent oligonucleotide primer (Section 9.3). Because the fluorescent
reporter only fluoresces when associated with the product amplicon
(Section 9.3), the increase in recorded fluorescence signal during ampli-
fication is in direct proportion to the amount of amplification product in
the reaction. So how can this be related back to the initial starting
amount of nucleic acid template in your sample? Because the intensity of
the fluorescence emission is monitored and recorded during each PCR
cycle it is possible to identify the exact PCR cycle at which the
fluorescent signal significantly increases, and this correlates to the initial
starting amount of the template. One easy way of thinking about this is
that the higher the template concentration the earlier a significant
increase in fluorescence will be observed. So what is a significant increase
in fluorescence? During the early stages of the amplification reaction
(3–15 cycles as a general rule) the fluorescence signal will show no or
little change and this is taken as the background fluorescence or baseline
(Table 9.1). By setting a fixed fluorescence threshold value above the
baseline a significant increase in fluorescence is recorded when the signal
210 PCR
Table 9.1
Glossary of frequently used terms
Term Explanation
Amplification plot A plot showing the cycle number versus the fluorescent signal which
correlates with the initial amount of RNA during the exponential phase of the
PCR amplification
Baseline The initial cycles of PCR when the fluorescent signal shows no or little change
C
T
value/number The threshold cycle (C
T
) indicates the cycle number where the reaction
fluorescence crosses the threshold. This reflects the point in the reaction
when sufficient amplicons have been generated to give a significant
fluorescent signal over the baseline
Linear dynamic range Range of initial template concentration giving accurate C
T
values
Melting curve analysis The melting point (T
m
) of double-stranded DNA is the temperature at which
50% of the DNA is single-stranded and this temperature depends on the
DNA length and GC content. When using SYBR® Green I a sudden decrease
in fluorescence is detected when T
m
is reached (dissociation of DNA strands
and release of SYBR® Green I)
Multiplex analysis Multiple RNA target analysis within one reaction well using gene-specific
probes containing different reporter fluorophores
Passive reference An internal reference dye to which the reporter dye can be normalized
during analysis to correct for fluctuations between reaction wells. The most
commonly used reference dye is ROX
Rn value The normalized reporter (Rn) value represents the reporter dye fluorescence
emission intensity divided by the passive reference dye. The Rn+ value is the
Rn of a complete reaction sample whilst the Rn– value is the Rn of an
unreacted sample. Rn– values are obtained during early amplification cycles
(baseline)
∆Rn (Rn+) – (Rn–) = the fluorescent signal intensity generated at each time point
during PCR given a certain set of conditions
Standard curve A curve consisting of C
T
values plotted against the log of standard
concentrations. The concentration/quantity of unknown samples are
extrapolated from the standard curve
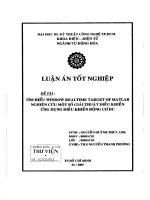
intensity is higher than the threshold value, which in turn determines
the threshold cycle or C
T
(Table 9.1; Figure 9.1(A)). By knowing the C
T
value for a reaction and by generating a standard cDNA concentration
curve (fluorescence vs cDNA concentration) the concentration of the
initial starting template can be extrapolated (Figure 9.1(B)). Although the
overall principle of real-time RT-PCR can sound a little complicated the
technique is relatively simple because of recent improvements in
chemistries and instrumentation.
Real-time RT-PCR 211
(A)
(B)
Fluorescence
C
T
= 12 C
T
= 21
C
T
= 26
Threshold
Baseline
Sample 1
Sample 2
Sample 3
Cycle number
0246810121416182022242628303234363840
40
35
30
25
20
15
10
5
0246810
Log (copy number)
C
T
Sample 1
Sample 2
Sample 3
Figure 9.1
A schematic diagram showing a typical real-time RT-PCR reaction data set from
three unknown samples. (A) The measured fluorescence signal at each
amplification cycle is plotted against cycle number. The baseline where there is no
or little change in fluorescence is indicated, as is the threshold value. The C
T
value
for each sample represents the cycle number when the fluorescence signal is
higher than the threshold value. (B) A standard curve showing C
T
versus the log of
the copy number of standard cDNA samples. The initial starting concentration
(copy number) of samples 1, 2 and 3 can be determined based on their C
T
values.
From this data set it is clear that sample 1 contains more starting template than
sample 2 and that sample 3 has the least amount of starting template.
9.3 Detection methods
During the last 5 years there have been several advances in real-time RT-PCR
detection methods in terms of both instrumentation and chemistries. Two
general amplicon-detection methods are used which are based on either
fluorescent DNA-binding dyes or fluorescent probes. The different detec-
tion systems, and their advantages and disadvantages, will now be
described in detail.
SYBR
®
Green I
SYBR
®
Green I is a fluorescent DNA intercalating agent that binds to the
minor groove of double-stranded DNA and upon excitation (498 nm) emits
light (522 nm) that can be recorded by real-time PCR thermocyclers
(Section 9.5). Because SYBR
®
Green I does not bind to single-stranded DNA
and because the dye only emits weak fluorescence in solution, SYBR
®
Green
I is widely used as a fluorescent reporter in real-time RT-PCR experiments
to monitor double-stranded amplicon production (Figure 9.2). SYBR
®
Green
I has numerous advantages over fluorescent probe approaches (covered in
the remainder of this Section). First, SYBR
®
Green I is a nonsequence-
specific dye which means that it will bind to any double-stranded piece of
DNA. The advantage of this feature is that SYBR
®
Green I can be used for
the amplification and monitoring of any gene. Second, because of the
212 PCR
Denature
Anneal
Extension
Ta q
Figure 9.2
A schematic diagram showing how SYBR
®
Green I acts as a double-stranded-
specific fluorescent reporter during PCR amplification. During the denaturation
step when the DNA is single-stranded SYBR® Green I is free in solution in a
nonfluorescent state ( ). Upon annealing of the primer to the target template
and during the extension phase the nonfluorescent SYBR® Green I ( ) binds to
the double-stranded amplicon and becomes fluorescent ( ).
nonsequence-specific nature of SYBR
®
Green I it represents a cheap alter-
native to fluorescent probes. Third, SYBR
®
Green I is simple to use. Fourth,
SYBR
®
Green I is temperature stable and does not interfere with DNA
polymerase.
Although the advantages of SYBR
®
Green I are clear there are also a few
disadvantages compared with the fluorescent probe approach. Because
SYBR
®
Green I binds to any double-stranded piece of DNA it will also bind
to primer-dimers and any nonspecific amplification product. However, the
nonspecific binding to primer-dimers can be overcome by melting curve
analysis (Table 9.1) which will determine at which temperature primer-
dimers are denatured (and therefore will stop fluorescing), allowing the
identification of the target amplicon at an appropriate higher temperature.
Melting curve analysis can also be used to eliminate the detection of
nonspecific amplification products. Because of these potential problems
SYBR
®
Green I-based real-time RT-PCR does need optimization and some-
times independent verification. Another potential problem that may occur
is related to amplicon size. Long amplicons can generate a very strong
fluorescence signal which may in turn saturate the camera situated inside
the real-time PCR thermocycler. However, this is a minor problem since the
size of the amplicon can easily be controlled by designing oligonucleotide
primers that will amplify a 200–300 bp amplicon. SYBR
®
Green I is also
most frequently used for single-amplicon monitoring (singleplex reaction)
because of its nonsequence specificity, although multiplex reactions are
possible if it is combined with melting curve analysis.
General principle of fluorescent probes
In contrast to fluorescent DNA-binding dyes such as SYBR
®
Green I,
fluorescent probe approaches are based on amplicon detection using DNA
sequence-specific oligonucleotide probes. These probes contain both a
fluorogenic dye and a quencher dye and are designed to hybridize to the
target gene either in between the two oligonucleotide primers used for the
PCR amplification (TaqMan and Molecular Beacons; see below) or as part
of one of the oligonucleotide primers used for the amplification reaction
(Scorpions; see below). The general principle of amplicon detection using
such probes is based on the fact that if a fluorescent dye is in close
proximity to a quencher dye the fluorescent signal generated by the
fluorescent dye in response to excitation is ‘absorbed’ by the nearby
quenching dye, resulting in no fluorescent signal. This phenomenon is
termed fluorescence resonance energy transfer (FRET). However, upon PCR
amplification the fluorescent dye and the quenching dye become spatially
separated either by probe displacement (TaqMan) or by probe rearrange-
ment (Molecular Beacons and Scorpions), resulting in loss of FRET
between the fluorescent dye and quenching dye, ultimately producing a
fluorescent signal.
There are two main advantages of fluorescent probes over fluorescent
DNA-binding dyes. First, because of the sequence specificity between the
fluorescent probe and the target gene, detection of nonspecific ampli-
fication products and primer-dimers is eliminated. This reduces the need
for extensive PCR optimization as is the case when using fluorescent DNA-
Real-time RT-PCR 213
binding dyes. Second, multiple probes containing different fluorogenic dyes
emitting different wavelengths of light can be used in a single reaction,
allowing for the detection of several amplicons simultaneously (multiplex-
ing). As with any system, fluorescent probes also have disadvantages.
Firstly, the coupling of a fluorescent dye and a quenching dye to an
oligonucleotide can be costly, and secondly, the designed oligonucleotide
probe can only be used for a single target gene. If the transcript levels of
several genes are to be analyzed the use of fluorescent probes can soon
become a costly exercise.
TaqMan probes
The TaqMan real-time RT-PCR assay was first reported in 1996 in two articles
published by Williams’ research group at Genentech in California (1,2) and
is used widely in both basic and applied research programmes. The TaqMan
assay combines the fact that Taq DNA polymerase has 5′→3′ exonuclease
activity and that dual-labeled oligonucleotide probes only fluoresce when
cleaved/degraded by this exonuclease activity. In a typical TaqMan reaction
three oligonucleotides are included: one forward primer, one reverse primer
and one nonextendable internal TaqMan probe (Figure 9.3). The TaqMan
probe is a standard oligonucleotide which has a covalently attached
fluorescent reporter dye, such as FAM (6-carboxyfluorescein) at its 5′-end and
a quencher dye, such as TAMRA (6-carboxytetramethylrhodamine) at its
3′-end (Figure 9.3). In addition to the most commonly used FAM and TAMRA
dyes, 4,7,2′,4′,5′,7′-hexachloro-6-carboxyfluorescein (HEX) and 4,7,2′,7-
tetrachloro-6-carboxyfluorescein (TET) can be used as fluorescent dyes
together with rhodamine or DABCYL as the 3′-quencher. When the TaqMan
probe is intact, either free in solution or hybridized to its target DNA, the
reporter dye fluorescence is absorbed by the quencher dye, because their
close proximity allows FRET to occur (Figure 9.3). However, as the PCR
reaction proceeds, the Taq polymerase will reach the 5′-end of the TaqMan
probe and will strand displace it from the template. The 5′→3′ exonuclease
activity of the Taq polymerase will cleave the 5′-FAM dye from the probe
thereby liberating the fluorescent reporter from its association with the
quencher dye which leads to an increase in fluorescence (Figure 9.3). The
increase in fluorescence is measured during each cycle and is proportional
to the rate of probe displacement and hence the amount of amplification
product in the reaction.
Although the TaqMan assay uses universal thermal cycling parameters
and PCR reaction conditions, care should be taken when designing a
TaqMan oligonucleotide probe. TaqMan probes should generally be
longer than the amplification primers and typically between 20 and 30
nucleotides. In addition, the melting temperature (T
m
) of a TaqMan
oligonucleotide should be approximately 10°C higher than for the
amplification primers, which allows hybridization to the target gene
during the extension step. This is critical to ensure that the emitted
fluorescence after TaqMan probe displacement is directly proportional to
the amount of target DNA present in the reaction. Another critical factor
when designing TaqMan probes is to avoid guanidine at the 5′-end
214 PCR
because this results in quenching of the fluorescent signal even after
probe cleavage. Furthermore, the probe should contain more cytosine
than guanidine and this can be achieved by designing either a sense or an
antisense probe. Another critical factor when designing TaqMan probes is
the possibility of coamplification of genomic DNA together with the
target cDNA. To avoid this the probe should be designed so that it spans
two exons, so that only correctly spliced versions of the cDNA are
amplified. However, if the DNA sequence of the target cDNA has not been
Real-time RT-PCR 215
Denaturation
Extension and TaqMan
probe hydrolysis
Target gene
Excitation
No fluorescence
FRET
FAM
Taq
TaqMan
probe
TAMRA
Probe
annealing
TA MRA
FA
M
Target gene
Ta q
Taq
Primer 2
Primer 1
Figure 9.3
A schematic diagram showing the principle of real-time RT-PCR using the TaqMan
approach. In addition to general PCR components the reaction also contains a
target gene-specific probe containing a fluorescent dye ( ) at the 5′-end and a
quencher dye ( ) at the 3′-end. During the annealing step both the primers
and the probe anneal to the target gene and because the quencher dye is in close
proximity to the fluorescent reporter dye (on the same oligonucleotide) no
fluorescence is generated. During the extension step the 5′
→
3′ exonuclease
activity of Taq DNA polymerase displaces (degrades) the TaqMan probe resulting
in loss of quenching and a fluorescence signal is generated ( ).
F
A
M
TAMRA
FAM
determined the only way to avoid genomic DNA amplification is to treat
the RNA with RNAse-free DNAse.
Once the TaqMan probe has been designed, following the simple guide-
lines described above, little optimization is needed. Despite this, TaqMan
probes can be expensive to synthesize and a separate probe is needed for
each target gene. In addition, the TaqMan approach is not as sensitive as
other more recent approaches such as molecular beacons (see below) and
often has high background fluorescence.
Molecular beacons
As for TaqMan probes, molecular beacons contain a fluorescent and a
quenching dye. Although molecular beacons make use of the fact that FRET
occurs between a fluorescent and quenching dye when in close proximity,
their design varies from that of TaqMan probes. During the annealing step
the molecular beacon hybridizes to the target DNA, thereby separating the
fluorescent reporter and the quenching dye, resulting in loss of FRET and
an increase in fluorescence. During the PCR, molecular beacons remain
intact and rehybridize during each cycle and because of this the fluorescence
emission after hybridization is proportional to the concentration of target
DNA (Figure 9.4).
Molecular beacons contain two parts: the probe, which can specifically
hybridize to the target DNA; and the stem, which forms a hairpin structure
whilst free in solution, ensuring that the fluorescent dye and the quench-
ing dye are in close proximity, allowing FRET to occur (Figure 9.4). The first
consideration when designing a molecular beacon is the selection of
the probe sequence. The probe sequence can be any sequence within the
amplicon that lies between the two oligonucleotide primers used for the
amplification. The probe sequence should be between 15 and 30
nucleotides long and should be able to hybridize to the target DNA during
the annealing phase of the PCR (Figure 9.4). The probe length may vary but
should allow the dissociation from the target DNA at temperatures of
7–10°C higher than the annealing temperature. It is important to consider
only the probe sequence of the molecular beacon and not the arms when
calculating the T
m
, because the arms are not involved in the hybridization
event.
Once the probe sequence has been selected, two complementary arm
sequences are designed and added on either side of the probe sequence. The
two arm sequences allow molecular beacons to adopt a hairpin structure that
forms a stable stem (Figure 9.4). The length of the arms may vary but short
arms, containing 5–8 base pairs, have been shown to be stable in the
presence of 1 mM MgCl
2
(3). Although the more economical solution is to
design short arms, it is important that the arms have the correct length and
DNA sequence to allow for a T
m
similar to the probe (i.e. 7–10°C higher than
the annealing temperature). It is advisable to design the arms with a
75–100% GC content, which will keep the length to a minimum; however,
as for TaqMan probes a guanidine residue should not be present next to the
fluorescent reporter as this quenches the fluorophore. Because the hairpin
structure of a molecular beacon is formed by an intramolecular hybridiza-
tion event the GC rule (Chapter 3) cannot be applied to calculate the T
m
.
216 PCR
To calculate the T
m
DNA folding software should be used, such as the Zuker
DNA folding program ( old/
dna/form1.cgi). As a rule of thumb a five base pair-long GC-rich stem will
melt between 55 and 60°C and a six base pair-long GC-rich stem will melt
between 60 and 65°C, whilst a seven base pair-long GC-rich stem will melt
between 65 and 70°C. The Zuker DNA folding program can also be used to
assess the probability of the free molecular beacon forming a hairpin struc-
ture rather than alternative structures. If alternative structures form, the
fluorescent reporter and the fluorescent quencher may not be placed in the
immediate vicinity, resulting in background fluorescence. Alternatively,
longer stems may form, resulting in slow binding to the target DNA.
In parallel with the molecular beacon design the amplification primers
should also be considered and it is important that there is no comple-
mentarity between the amplification primers and the molecular beacon.
This may cause the molecular beacon to hybridize to one of the primers,
resulting in primer extension by the DNA polymerase. It is also advisable
to design amplification primers that will result in an amplicon of approxi-
Real-time RT-PCR 217
Denaturation
Nonfluorescent
molecular beacon
Target gene
FRET
FAM
DABCYL
DABCYL
Annealing
Loss of FRET
FAM
Figure 9.4
A schematic diagram showing the principle of molecular beacons as a reporter
during real-time RT-PCR. In addition to general PCR components the reaction also
contains a target gene-specific molecular beacon containing a fluorescent dye
( ) at the 5′-end and a quencher dye ( ) at the 3′-end. Because the
molecular beacon adopts a hairpin stem structure when free in solution the
fluorescent dye and the quencher dye are in close proximity, allowing FRET to
occur resulting in no fluorescence. During the annealing step the hairpin structure
dissolves and the molecular beacon anneals to the target amplicon resulting in
loss of FRET and increased fluorescence ( ).
F
A
M
DABCYL
FAM