Identification of TRPC6 as a possible candidate target gene within an amplicon at 11q21-q22.2 for migratory capacity in head and neck squamous cell carcinomas
Bạn đang xem bản rút gọn của tài liệu. Xem và tải ngay bản đầy đủ của tài liệu tại đây (1.06 MB, 11 trang )
Bernaldo de Quirós et al. BMC Cancer 2013, 13:116
/>
RESEARCH ARTICLE
Open Access
Identification of TRPC6 as a possible candidate
target gene within an amplicon at 11q21-q22.2
for migratory capacity in head and neck
squamous cell carcinomas
Sandra Bernaldo de Quirós1, Anna Merlo1, Pablo Secades1, Iriana Zambrano1, Ines Saenz de Santa María1,
Nerea Ugidos1, Eloisa Jantus-Lewintre2, Rafael Sirera3, Carlos Suarez1 and María-Dolores Chiara1*
Abstract
Background: Cytogenetic and gene expression analyses in head and neck squamous cell carcinomas (HNSCC) have
allowed identification of genomic aberrations that may contribute to cancer pathophysiology. Nevertheless, the
molecular consequences of numerous genetic alterations still remain unclear.
Methods: To identify novel genes implicated in HNSCC pathogenesis, we analyzed the genomic alterations present
in five HNSCC-derived cell lines by array CGH, and compared high level focal gene amplifications with gene
expression levels to identify genes whose expression is directly impacted by these genetic events. Next, we
knocked down TRPC6, one of the most highly amplified and over-expressed genes, to characterize the biological
roles of TRPC6 in carcinogenesis. Finally, real time PCR was performed to determine TRPC6 gene dosage and mRNA
levels in normal mucosa and human HNSCC tissues.
Results: The data showed that the HNSCC-derived cell lines carry most of the recurrent genomic abnormalities
previously described in primary tumors. High-level genomic amplifications were found at four chromosomal sites
(11q21-q22.2, 18p11.31-p11.21, 19p13.2-p13.13, and 21q11) with associated gene expression changes in selective
candidate genes suggesting that they may play an important role in the malignant behavior of HNSCC. One of the
most dramatic alterations of gene transcription involved the TRPC6 gene (located at 11q21-q22.2) which has been
recently implicated in tumour invasiveness. siRNA-induced knockdown of TRPC6 expression in HNSCC-derived cells
dramatically inhibited HNSCC-cell invasion but did not significantly alter cell proliferation. Importantly, amplification
and concomitant overexpression of TRPC6 was also found in HNSCC tumour samples.
Conclusions: Altogether, these data show that TRPC6 is likely to be a target for 11q21–22.2 amplification that
confers enhanced invasive behavior to HNSCC cells. Therefore, TRPC6 may be a promising therapeutic target in the
treatment of HNSCC.
Keywords: Head and neck squamous cell carcinoma, TRPC6, Invasion, Gene amplification
* Correspondence:
1
Servicio de Otorrinolaringología, Hospital Universitario Central de Asturias,
Instituto Universitario de Oncología del Principado de Asturias, Universidad
de Oviedo, Oviedo, Spain
Full list of author information is available at the end of the article
© 2013 Bernaldo de Quirós et al.; licensee BioMed Central Ltd. This is an Open Access article distributed under the terms of
the Creative Commons Attribution License ( which permits unrestricted use,
distribution, and reproduction in any medium, provided the original work is properly cited.
Bernaldo de Quirós et al. BMC Cancer 2013, 13:116
/>
Background
The broad application of cytogenetic and molecular genetics methods has led to the identification of tumorassociated chromosomal regions substantial for the
tumorigenesis and progression of head and neck squamous cell carcinomas (HNSCC) [1-3]. Comprehensive
analysis of recurrent amplified chromosomal regions has
allowed identification of oncogenes and other cancerrelated gene such as EMS1, CCND1, PPFIA1, TAOS1
(11q13), LOXL4 (10q24), PAK4 (19q13), and HIF1A
(14q23-q24) which have been associated with different
clinical behaviors [4-10]. Therefore, associations of
high-level genomic amplifications with altered gene expression and functional analysis of the affected genes
represents an excellent approach to identify novel genes
involved in tumor progression and carcinogenesis.
Here, we compared the genome-wide DNA copy number alterations present in five HNSCC-derived cell lines
with those previously reported in tumour tissues. Remarkably, our data showed that the cell lines analyzed
here resemble most of the important genomic alterations
previously described in primary HNSCC. It also revealed
the presence of several regions with high level focal amplifications (11q21-22.2, 18p11.31-p11.21, 19p13.2-p13.13,
and 21q11) that have been previously identified in
HNSCC [1,11].
Although rarely detected in solid tumors, high level
amplification at 11q22-q23 has been described not only
in HNSCC [12,13] but in many malignancies including
glioblastomas, renal cell carcinomas, sarcomas, and
cervical, lung and pancreatic cancers [14-19] thus
suggesting that this region may harbor gene(s) that,
when amplified, have an active role in tumorigenesis
and/or cancer progression. YAP gene has been identified
as a candidate target gene in 11q22 amplicon in several
human cancers [20-22]. However, to date, no specific
genes have been proposed as targets in HNSCC.
In the present report, we performed gene expression
analysis of the amplified genes in each amplicon identified in HNSCC-derived cell lines what allowed the identification of 12 novel genes with potential implications
in HNSCC biology. One of the most dramatically amplified and overexpressed gene identified here is TRPC6, a
member of the transient receptor potential (TRPC) subfamily, located at 11q22.1. This novel genetic change
was also identified in primary HNSCC-tumour samples.
Remarkably, recent studies have revealed that TRPC6
has an essential role in glioma growth, invasion, and angiogenesis [23,24]. We show here that TRPC6 overexpression
confers enhanced invasive behavior to HNSCC cells.
Therefore, TRPC6 may have an essential role in the
development of the aggressive phenotype of HNSCC
and may be a promising therapeutic target in the
treatment of HNSCC.
Page 2 of 11
Methods
Cell lines
The five established human HNSCC cell lines used in this
study were kindly provided by Dr. Grenman [25]. Cell
lines were derived from primary tumors located at the oral
cavity (SCC2 and SCC40 cell lines) and larynx (SCC29,
SCC38 and SCC42B cell lines). Cells were grown in
Dulbecco’s modified Eagle’s medium supplemented with
10% fetal bovine serum, 100 units/ml penicillin, 200 μg/ml
streptomycin, 2 mM L-glutamine, 20 mM Hepes pH 7.3
and 100 μM non-essential aminoacids. All cells were
maintained at 37°C in 5% CO2.
Tissue samples
Surgical tissue specimens from 24 patients with HNSCC
were obtained, following institutional review board
guidelines, from the Hospital Universitario Central de
Asturias and Hospital General Universitario de Valencia.
All the procedures utilized in this study are in agreement
with the 1975 Helsinki Declaration. Informed consent
was obtained from each patient. All the patients included in our study underwent surgical resection of their
tumor and bilateral neck dissection (functional or radical
based on surgical findings). All of them had a single primary tumor; none had undergone treatment prior to
surgery, and had microscopically clear surgical margins.
A portion of the surgical tissue specimen was sharply excised, placed in sterile tubes, and stored at −80°C in
RNAlater (Ambion) for DNA and RNA analysis. Clinically normal adjacent mucosa and normal mucosa from
non-cancer patients were also collected. All patients
were habitual tobacco and alcohol consumers.
DNA and RNA isolation
Genomic DNA was isolated using the QIAmp DNA Mini
kit (Qiagen, Inc., Chatsworth, CA) and subsequently
treated with RNase A (1unit/mL) at 37°C for 5 minutes.
Total RNA was isolated from HNSCC cell lines and
tumour tissues with Nucleospin RNA II (Macherey-Nagel,
Easton, PA) following the manufacturer’s instructions with
the addition of an extra acid phenol/chloroform extraction
followed by RNA precipitation.
Array-CGH
Arrays-CGH were performed as described by van den
Ijssel et al. [26]. Briefly, tumour cell lines and reference
DNAs (pooled from 10 different donors) were differently
labelled by random priming. Three hundred ng test and
reference DNA were hybridized to an array containing
approximately 30,000 DNA oligos spread across the
whole genome printed on Codelink activated slides
(Amersham Biosciences, Barcelona, Spain). This array
contained 29,134 oligos covering 28,830 unique genes.
Hybridization and washing took place for two nights in a
Bernaldo de Quirós et al. BMC Cancer 2013, 13:116
/>
specialized hybridization chamber (GeneTAC/HybArray12
hybstation; Genomic Solutions/Perkin Elmer). Images were
acquired using a Microarray Scanner G2505B (Agilent
Technologies). Analysis and data extraction were quantified
by BlueFuse (BlueGnome, Cambridge, UK). Gains were
defined as at least two neighbouring oligonucleotides with
deviations of 0.2 or more from log2 ratio = 0.0. High-level
amplification was considered when at least two neighbouring clones reached a log2 ratio of 1.0 or higher.
qPCR
Real-time PCR was done in an ABI Prism 7500 Real Time
PCR System (Applied Biosystems, Foster City, CA) using
Power SYBR Green PCR Master mix (Applied Biosystems)
and the thermocycler conditions recommended by the
manufacturer. Primers, designed using the computer program Primer Express (Applied Biosystems), were as described in Table 1.
To perform mRNA quantifications, first-strand cDNA
was synthesized from 2 μg of total RNA using the
Superscript first-strand synthesis system for reverse transcriptase (Invitrogen, Carlsbad, CA) with random primers
and oligodT according to the manufacturer’s directions.
Cyclophilin was used to normalize for RNA input amounts
and to perform relative quantification. To perform genomic
DNA amplification, tyrosine hydroxylase gene was used to
normalize for DNA input amounts and to perform relative
quantification. Melting curve analysis showed a single sharp
peak with the expected Tm for all samples and genes tested. Relative quantities were obtained using the 2–ΔΔCt
method [27].
Western blot
Protein extracts were obtained from SCC42B cells at 70%
to 80% confluence by scraping on ice in lysis buffer
containing 50 mmol/l HEPES (pH 7.9), 250 mmol/l NaCl,
5 mmol/l EDTA, 0.2% NP40, 10% glycerol, and protease inhibitors (0.5 mmol/l phenylmethylsulfonyl fluoride, 1 μg/ml
aprotinin, 10 μg/ml leupeptin and 1 mmol/l Na3VO4).
Equal amounts of proteins were fractionated on SDS-PAGE
and transferred to PVDF membranes. Membranes were
probed with anti-TRPC6 antibody (Abcam) or anti-β-actin
(Sigma-Aldrich) at 1:100 and 1:5000 dilutions, respectively.
Bound antibodies were detected using Enhanced Chemiluminescence Reagent (Amersham Pharmacia Biotech) according to the protocol of the manufacturer.
siRNA treatment
siRNA duplex oligonucleotides (ON-TARGETplus
SMARTpool Human TRPC6) were purchased from
Dharmacon Research (Lafayette, CO). siCONTROL Nontargeting pool (Dharmacon) were used as control siRNA.
SCC42B cells were transfected with 35 pmol/ml siRNAs
using Lipofectamine 2000. TRPC6 mRNA analyses revealed
Page 3 of 11
a substantial inhibition (more than 60–70%) of TRPC6 expression 48–72 hours after transfection. The transfected
cells were used for subsequent experiments within that
interval of time.
Wound healing assay
Cells were grown to confluence in 35-mm tissue culture
dishes. Cell monolayers were wounded using a micropipette tip, and floating cells were removed by extensive
washing with DMEM. Photographs of the wounded area
were taken immediately after making the scratch (0 h
time point) and after 8 h using a Leica DMIL microscope to measure the migration rate of cells into the
wounded area. At least 15 different fields were randomly
chosen across the wound length. For the analysis of the
differential cell migration capacity of SCC38, SCC40,
and SCC42B cells, the rate of front migration of cell
monolayers was analyzed in an AxioObserver.Z1 microscope (Zeiss), equipped with an incubation module, by
taking pictures at 0 h and 8 h using an EC PlanNeofluor 10x/0.30 Ph1 objective.
Matrigel invasion assays
In vitro invasion assays were performed by using a 24well invasion chamber coated with Matrigel (Becton
Dickinson). Cells were trypsinized, washed with PBS,
suspended in DMEM containing 5% BSA, and plated in
the invasion chamber (3 x 10⁴ cells per well). The lower
chambers were filled with DMEM containing 5% BSA
with 10% FBS. After 24 h, the cells remaining in the
upper chamber were removed by scraping, whereas the
cells that invaded through Matrigel were fixed and
stained by using 0.5% Crystal Violet in methanol. All invading cells were counted by microscopic visualization.
All analyses were performed in triplicate.
MTS-based cell proliferation assay
MTS assays were performed using CellTiter 96 Cell
Non-Radioactive Proliferation Assay following the protocol recommended by the manufacturer (Promega,
Madison, WI). Briefly, 1000 cells were seeded in each
well of 96-well plates, and allowed to growth for 48, 72 or
96 hours. MTS assay was performed at each time point.
Results and discussion
Array CGH analysis of HNSCC-derived cell lines
Array CGH was used to characterize genome-wide DNA
copy number alterations in five HNSCC-derived cell
lines. Visual inspection of the array CGH profiles revealed the presence of an overall pattern that is broadly
consistent with the literature in HNSCC (a summary of
the chromosomal aberrations is shown in Table 2). Some
degree of gain and/or loss was detected in every cell line.
The data predicted frequent copy number gains (present
Bernaldo de Quirós et al. BMC Cancer 2013, 13:116
/>
Page 4 of 11
Table 1 Oligonucleotides used for real time PCR
Gene
Oligonucleotides
Table 1 Oligonucleotides used for real time PCR
(Continued)
JRKL
Forward: 50CGCGATAGTCAGGGAGCTGT 30
JUNB
Reverse: 50GGGTTGGCTGGCAAATAGAC 30
CNTN5
0
Forward: 5 CACCCCATCTCGAATGATCC 3
Reverse: 50CGCTTTGAGACTCCGGTAGG 30
0
STCH
Reverse: 50GGTGCTGTCTTCGGAACTGC 30
AD031
0
Forward: 5 TCTCCTGTTGATTCGCAGATGT 3
NRIP1
0
Forward: 5 AACTTCTTGATAACTTGCATGATCTTG 3
0
Forward: 50GGGATCAGGTACTGCCGTTG 30
Reverse: 50TCCTCTTCATTATGCCCAGCA 30
0
Reverse: 50AGCAGTACAGATGAAGTTGTTTGACA 30
TRPC6
Forward: 50AACCCGAGCAATGTCTGGAA 30
Reverse: 50TGATTGAAGTCCTGTCCTCCAA 30
0
Reverse: 50 TTGAGACCAGTTGATGAATACTCGA 30
PGR
Forward: 50AAACTCCTGAAACCGAGCCTG 30
CYPA
Forward: 50CATCTGCACTGCCAGACTGA 30
Reverse: 50TTGCCAAACACCACATGCTT 30
0
Forward: 5 TTCTCATGGATGGAGATGCTCA 3
Reverse: 50CCATATCATGCCTATTACCCAGGA30
YAP1
Forward: 50GACTTCCTGAACAGTGTGGATGAG 30
Reverse: 50TGCTTTGGTTGATAGTATCACCTGTAT 30
BIRC3
Forward: 50CATCCGTCAAGTTCAAGCCA 30
Reverse: 50GATAGCAGCTGTTCAAGTAGATGAGG 30
PORIMIN
Forward: 50TGCTTCATCAGTAACAATCACAACA 30
Reverse: 50CCTTTCTTTGCTTCAGAATGCAT 30
MMP7
Forward: 50CCAGGATGATATTAAAGGCATTCA 30
Reverse: 50TGAATTACTTCTCTTTCCATATAGTTTCTGA 30
MMP20
Forward: 50CTGCTCTTCAAGGACCGGATT 30
Reverse: 50TGTCCGCAAGTGAACCTGC 30
MMP27
Forward: 50GCATTTGGTGCTGGAGGTTT 30
Reverse: 50ACCCTTTGTCCATGGTTTGG 30
MMP8
Forward: 50AGTTGATGCAGTTTTCCAGCAA 30
Reverse: 50GGTCCACTGAAGACATGGAAGAA 30
MMP10
Forward: 50TGCATCAGGCACCAATTTATTC 30
Reverse: 50GAGTGGCCAAGTTCATGAGCA 30
MMP1
Forward: 50TGGACCAACAATTTCAGAGAGTACA 30
Reverse: 50TTCATGAGCTGCAACACGATG 30
MMP3
Forward: 50TCTTTGTAGAGGACAAATACTGGAGATT 30
Reverse: 50CCATGGAATTTCTCTTCTCATCAA 30
MMP12
Forward: 50CGATGAGGACGAATTCTGGAC 30
Reverse: 50CAGTGAGGAACAAGTGGTGCC 30
MMP13
Forward: 50GCCATTACCAGTCTCCGAGG 30
Reverse: 50GCAGGCGCCAGAAGAATCT 30
RNMT
Forward: 50GTTCCTGAATTCTTGGTCTATTTTCC 30
Reverse: 50CTTCTTTGCCATTTCATTTAGCAAT 30
MC5R
Forward: 50TTGGATCTCAACCTGAATGCC 30
Reverse: 50TTGACATTGGGTCCTGAAAGG 30
MC2R
Forward: 50CCTTCTCATTCATTTTGCCCA 30
Reverse: 50TCCCAATCACCTTCAGCTCG 30
ZNF443
Forward: 50GAACCTGGATTGTGTAGTAATGAAATG 30
Reverse: 50TGATCTTCAATGTTCTGGTCTTTCC 30
MAN2B1
Forward: 50GCTCAAAACCGTGGACCAGT 30
Reverse: 50GGCGTGCTGGATGTCATTCT 30
in three or more cell lines) for specific segments in 3q,
5p, 7p, 8q, 9q, 11q, 14q, 18p, and 20q; and losses for 3p,
9p, 11q, and 18q. These copy number alterations, revealed through CGH-array, had been previously detected
with conventional metaphase CGH analysis in HNSCC
primary samples [1,28]. High-level amplifications were
detected at four chromosomal sites including 11q21-q22.2,
18p11.31-p11.21, 19p13.2-p13.13, and 21q11 (see Figure 1).
Gains encompassing these genomic regions have been
described in previous reports [11,12,29,30]. In addition to
known regions, our CGH-array analysis disclosed alterations that had never been reported using conventional
techniques, such as small gains in 4p12, 13q12, 21q21,
and losses in 22q13 (Table 3).
In general, the array CGH data showed that the recurrent genome aberrations described in primary HNSCC
tissues are well preserved in the cell lines analyzed here.
It also indicates that these cell lines have not accumulated substantial novel recurrent aberrations during extended culture. These data, together with our previous
molecular and functional studies [31,32], suggest that
analysis of genomic aberrations in the HNSCC-derived
cell lines used here might be a useful approach to identify tumor-associated chromosomal regions substantial
for the tumorigenesis and progression of HNSCC.
Impact of focal high-level amplifications on gene
expression
To gain some insights into the role of genomic aberrations in HNSCC pathophysiology, we focused in focal
amplification events for which it may be easier to pinpoint target genes involved in the pathogenesis of
HNSCC.
The present analysis allowed narrowing down and delineating the boundaries of high-level amplification
events. Boundaries from the p-telomere span from 95 to
102 Mb (11q21-q22.2), 3,44 to 16,81 Mb (18p11.31p11.21), 11 to13 Mb (19p13.2-p13.13), and 14,1 to
15,3 Mb (21q11). These are relatively small genomic segments containing 20 or fewer genes (listed in Figure 1)
Bernaldo de Quirós et al. BMC Cancer 2013, 13:116
/>
Page 5 of 11
Table 2 Most frequently reported chromosomal gains and losses present in HNSCC-derived cell lines
Chro Region
Size
(Mb)
Frequency Known proto-oncogenes
Cell line with minimal region of
change
Chromosomal gains
1p
1p32.1-p21.1
47,25
2/5
-
SCC40
3q
3q13.2-qter
84,9
4/5
BCL6, EIF4A2, EVI1, GMPS, LPP, MDS1, MLF1, PI3K3CA, RPN1,
TFRC, ZNF9
SCC2
5p
5pter-p12
45
3/5
LIFR
SCC38
6q
6q16.3-q23.3
38,82
1/5
FOXOA3, GOPC, ROS1, STL
SCC40
7p
7pter-p14.3
32
3/5
ETV1, HOXA9, HOXA11, HOXA13, HNRPA2B1, JAZF1, PMS2
SCC29
7q
7q21.13-q31.1
22,87
1/5
AKAP9, CDK6
SCC2
8q
8q21.1-q24.22
64,6
5/5
COX6C, EXT1, MYC, NBS1
SCC29
9p
9p21.2-p13.2
12,28
2/5
PAX5, FANCG
SCC29
9q
9q21.33q34.11
43
4/5
FANCC, NR4A3, OMD, PTCH1, SYK, TAL2, XPA
SCC29
11q
11q12.2-q12.3
1,9
4/5
-
SCC42B
11q13.2-q22.2
33,1
4/5
PRAD1, NUMA1, PICAM, MAML2, BIRC3
SCC40
11q23.3
0,20
3/5
SCC40
DDX6
14q
14q23.1-q24.2
13,23
1/5
GPHN, RAD51L1
SCC2
14q31.1
0,72
3/5
TSHR
SCC2
18p
18p11.31p11.21
13.37
4/5
-
SCC40
19p
19p13.2p13.13
1,64
1/5
LYL1
SCC42B
20q
20q11.21q11.23
4,86
3/5
-
SCC42B
Chromosomal losses
1p
1p13.2-p12
7,35
2/5
NRAS, TRIM33
3p
3p23-p22.3
2,5
4/5
MLH1
5q
5q11.1-q12.3
13,11
2/5
-
8p
8pter-q11.21
47,1
2/5
PCM1, FGFR1, WRN, WHSC1L1
SCC29, SCC40
SCC2
SCC29, 38
SCC40
9p
9p21.3
2,61
3/3
CDKN2A, CDKN2B, MLLT3
SCC29
10p
10pter-p11.21
37,35
2/5
COPEB, MLLT10, SH3BP1
SCC2, SCC40
11q
11q22.3-qter
15,29
3/5
ATM, CBL, DDX10, PAFAH1B2, POU2AF1, SDHD, ZNF145, FLI1,
PRO1073
SCC42B
18q
18q21.1-qter
29,97
3/5
BCL2, FVT1, SMAD4, MALT1
SCC40
BCR, CLTCL1, PNUTL1, SMARCB1
22q
22q11.21
1,03
2/5
22q12.1-q12.2
1,96
2/5
suggesting that any of them may be the target(s) of the
amplification. These amplicons do not contain wellestablished oncogenes in HNSCC. To identify putative
driver genes in these genomic regions, we compared the
expression levels of candidate genes mapping in the
amplicons with their DNA copy number status. Figure 1
illustrates genome-wide copy number plots of the gene
amplifications and the gene expression data.
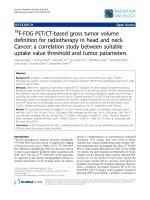
Interestingly, a high degree of correlation between DNA
and mRNA levels was found for most of the genes selected
SCC29
SCC40
at 11q, 18p, 19p, and 21q amplicons. This is in agreement
with previous studies showing that amplification has a
strong impact on transcription levels [33-35]. Expression
of RNMT, MC5R, and MC2R genes at 18p11.31-p11.21
amplicon was significantly up-regulated in SCC40 cells
that had shown high-level amplification at that locus,
compared with cell lines without gene amplification
(p < 0,0001) (Figure 1B). Similarly, the expression levels of
the STCH and NRIP1 genes at 21q11 were significantly
higher in SCC29 cells, which harbored amplification at
Bernaldo de Quirós et al. BMC Cancer 2013, 13:116
/>
Page 6 of 11
A
B
C
D
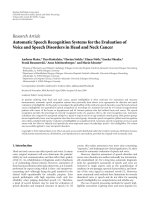
Figure 1 Genome-wide copy number plots of gene amplifications and relative mRNA expression data in HNSCC-derived cell lines. Left
panels show the profiles as normalized log2 signal intensity ratios of each spot on the array to the genomic position at chromosome 11 (A),
chromosome 18 (B), chromosome 19 (C) from p-to t-telomere, and chromosome 21 (D) from chromosomal band 11p11.2 to t-telomere. Right
panels show the relative mRNA levels of the indicated genes in the HNSCC-derived cell lines. Total RNA was extracted from HNSCC-derived cell
lines grown to 80–90% confluence. mRNA levels were analyzed by RT-qPCR.
Table 3 Non previously identified altered chromosomal regions
Chro
Alteration
Region
Size (Mb)
Frequency
Known proto-oncogenes
Cell line with minimal region of change
4
gain
4p12
7,08
1/5
TEC
SCC29
13
gain
13q12.12-q12.3
5,49
2/5
CDX2, FLT3
SCC29, SCC40
21
22
amplification
21q11
1,20
1/5
-
SCC29
gain
21q21.1
1,36
5/5
-
SCC29, SCC40
gain
21q21.3
4,59
2/5
-
SCC29, SCC38
loss
22q13.2
0,62
5/5
-
SCC2, SCC29
Bernaldo de Quirós et al. BMC Cancer 2013, 13:116
/>
that locus, than in the other cell lines without gene alteration (p < 0,01) (Figure 1D). Amplification of the ZNF443,
and MAN2B1 genes at 19p13.2-p13.13, detected in SCC42B
cells, also correlated with higher expression at the mRNA
levels as compared with the other cell lines (p < 0,05)
(Figure 1C). However, quantification of the mRNA levels
of the JUNB proto-oncogene (19p13.2-p13.13) revealed
that SCC42B cells had similar levels of expression than
SCC29 cells, which did not show amplification of the
19p13.2-p13.3 locus. These data indicate that ZNF443
and/or MAN2B1 genes, but not JUNB, might be candidates of the selection pressure for structural amplification
of the 19p13.2-p13.3 region, at least in SCC42B cells. In
general, any of the amplified and over-expressed genes
identified here (RNMT, MC5R, MC2R, ZNF443, MAN2B1,
NRIP1, and STCH) might be up-regulated in a DNA copy
number-dependent manner and could possibly contribute
to HNSCC pathogenesis. To our knowledge, no previous
evidence is available on the association of these genes in
HNSCC biology. Of all the genes analyzed here, only JUNB
has been previously found up-regulated at the mRNA and
protein level in HNSCC tumour tissues [36-39]. Our data
suggest that its over-expression is caused by mechanisms
other than gene amplification. Nevertheless, further studies
are required to demonstrate unequivocally whether an association exists between the genetic and expression data in
tumour tissue samples.
With regard to the 11q21-q22.2 amplicon, recent studies
reported high copy number amplification at this locus in
HNSCC [12,13,30]. This region contains 18 known genes
harbouring two gene clusters, one with nine matrix
metalloproteinase (MMP) genes, and other with two
baculoviral IAP repeat-containing protein (BIRC) genes. Expression analysis of BIRC and MMP genes in the HNSCCderived cell lines showed no correlation between their
mRNA levels and DNA copy number status. In contrast,
expression of JRKL, AD031, TRPC6, (Figure 1A), YAP1 and
PORIMIN (data not shown) genes were significantly upregulated in SCC42B cells that had shown high-level amplification at that locus, compared with cell lines without gene
amplification (p < 0,01). Specifically, mRNA levels of JRKL,
AD031, TRPC6, YAP1, and PORIMIN were, respectively,
30, 50, 600, 10, and 8-fold higher in SCC42B cells than
in the other cell lines. mRNA expression of other candidate
genes at 11q21-q22.2 amplicon (CNTN5, PGR, and
MMP27) was not detected in any of the cell lines. These
data exclude CNTN5, PGR, MMP and BIRC genes and
point to any of the 5 amplified and over-expressed genes as
critical gene-amplification “driver/s”. Of them, only TRPC6
and YAP1 genes have been previously found deregulated
in several types of cancer. Amplification and mRNA upregulation of YAP1 has been previously described in several
cancers including HNSCC of the oral cavity [20,30,40], sarcomas, meduloblatomas, and mesotheliomas [20,21,41,42].
Page 7 of 11
In addition, recent studies showed that over-expression
of YAP1 induces phenotypic alterations that are commonly
associated with potent transforming oncogenes [40,42-44].
TRPC6 is a member of the TRP family of Ca2+- and
Na+-permeable channels shown to be up-regulated in glioblastomas and breast, prostate, gastric, and oesophageal
cancer cells [23,45-48]. Our data revealed that this was the
most dramatically up-regulated gene in SCC42B cells.
However, to the best of our knowledge, up-regulation of
TRPC6 has not been previously identified in HNSCC.
TRPC6 gene is amplified and over-expressed in HNSCCtissue specimens
TRPC6 DNA and mRNA levels were analyzed in a panel
of 24 primary tumors (Table 4). Eight out of 24 tumor samples displayed increased gene copy number as compared
with a pool of DNA samples obtained from normal mucosa
of five healthy individuals. Analysis of TRPC6 mRNA levels
revealed that it was absent in normal mucosa from noncancer patients. Similarly, it was either absent or barely
Table 4 Relative TRPC6 DNA and mRNA levels in HNSCC
primary tumors
Tumor sample Genomic TRPC6 DNA levels* TRPC6 mRNA Levels*
*
7T
5.70
1.7
8T
0.67
1.2
11 T
2.01
2,85
12 T
1.60
1.38
13 T
3.90
1.9
14 T
0.60
0.56
17 T
2.00
1.01
21 T
3.00
5.77
23 T
1.27
7.5
25 T
1.27
1.05
26 T
1.75
5.91
27 T
1.55
1.84
32 T
2.60
1.7
33 T
1.40
9.53
95 T
0.37
1.46
110 T
1.60
1.38
112 T
2.90
4.14
124 T
0.80
2.87
127 T
0.86
1.76
141 T
3.59
19.02
143 T
0.60
1.03
147 T
0.60
0.16
154 T
1.40
0.41
155 T
0.61
0.16
Values showing gene gain (#2) and increased mRNA levels (#1.7) are indicated
in bold.
Bernaldo de Quirós et al. BMC Cancer 2013, 13:116
/>
Page 8 of 11
detectable in all clinically normal mucosa adjacent to tumors, and in 11/24 tumor samples. In contrast, 13 tumor
tissues displayed TRPC6 mRNA levels that were 1.7- to
19-fold above the highest level found in normal mucosa.
All but one tumor showing increased TRPC6 gene dosage
also harbored TRPC6 mRNA over-expression. These data
suggest that TRPC6 amplification may be responsible for
TRPC6 over-expression and is a candidate driver gene in
11q21-q22.2 amplicon that may play a role in HNSCC
pathophysiology.
Inhibition of TRPC6 expression does not induce changes
in SCC42B cell proliferation
Previous studies have shown that inhibition of TRPC6 expression results in decreased cell proliferation in cancer
cells [23,24,47,49,50]. To investigate the possible role of
TRPC6 on cell proliferation of HNSCC cells, MTS assays
and cell counting were performed in SCC42B cells expressing siRNA against TRPC6, and in their corresponding control cells. As shown in Figure 2, inhibition of TRPC6
expression did not affect significantly the cell growth rates.
Accordingly, the number of cells in each phase of the cell
cycle was similar in SCC42B cells transfected with TRPC6
siRNA versus control siRNA (data not shown). We did not
A
find association between the proliferation rate of SCC cells
and the presence of TRPC6 gene amplification and overexpression. SCC42B cells carrying 11q21-q22.2 amplification proliferate more rapidly than SCC29 and SCC40 cells,
but they growth at similar rates than SCC38 and SCC2
cells (data not shown). These data show that, in the
tumour background examined here, TRPC6 is not important for cell proliferation.
Inhibition of TRPC6 expression impairs cell migration and
invasion
In addition to cell proliferation, Ca2+ signaling is known to
be involved in cell locomotion. It was therefore tempting
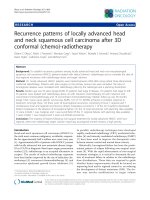
to speculate that SCC42B cells have a high migratory capacity. Comparison of the cell migration behavior of
SCC38, SCC40 and SCC42B cells revealed that the migratory potential of SCC42B cells, which express high levels
of TRPC6 and harbor 11q21-q22.2 amplification, was significantly higher than that of SCC38 and SCC40 cells,
containing lower levels of TRPC6 mRNA and genomic
DNA (Figure 3A and B). This different phenotype may be
the result of different levels of TRPC6 gene expression or,
alternatively, could be caused by other gene(s)/protein(s)
structural or functional alterations in the cell lines
B
1.6
Kd
mRNA relative levels
*
100
50
1.2
Ci
TRPC6i
TRPC6
-actin
0.8
0.4
0
Ci
TRPC6i
Cell growth (% of control)
C 120
100
80
Ci
60
TRPC6i
40
20
0
19
48
Time (hours)
72
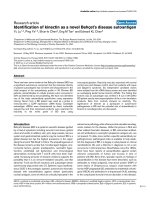
Figure 2 TRPC6 inhibition does not affect cell proliferation in SCC42B cells. SCC42B cells were transfected with control (Ci) or TRPC6-siRNA
(TRPC6i) 48 hours before MTS assay. (A and B) Reduction of TRPC6 mRNA (A) and protein (B) levels by siRNA treatment. Transcripts were
quantified using RT–qPCR. The mean of relative expression to cyclophilin A housekeeping gene of at least three independent experiments is
shown. (C) Cell growth was determined using a colorimetric MTS assay. Columns, mean cell growth relative to control of three independent
experiments. * p < 0.05 paired Student’s t test.
Bernaldo de Quirós et al. BMC Cancer 2013, 13:116
/>
Page 9 of 11
explored here. We therefore sought to determine whether
inhibition of TRPC6 expression by siRNAs affects cell migration in SCC42B cells. As shown in Figure 3D, knock
down of TRPC6 expression by siRNA resulted in a 36% decrease in cell migration as compared with cells transfected
with nonspecific siRNAs. SCC42B cells were also analyzed
for their invasive potential through a B1-mm Matrigel barrier compared with cells transfected with TRPC6 siRNA.
The data revealed that invasion was dramatically inhibited
with TRPC6 siRNA expression showing a ~90% decrease in
invasiveness (Figure 3C and E).
Plasma membrane ion channels contribute to virtually all
basic cellular processes and are also involved in the malignant phenotype of cancer cells by modulating different hallmarks of cancer such as proliferation, cellular locomotion,
and tissue invasion. Specifically, the morphological and adherence changes of metastatic cells involve Ca2+ signaling
supported by enhanced Ca2+ influx. Recently, TRPC6 has
emerged as an important player in the control of the aggressive phenotype of glioblastoma cells [23]. Our analysis
A
0h
8h
of the functional significance of TRPC6 overexpression in
HNSCC showed that TRPC6 also modulates cell invasion
in HNSCC cells. This finding is of interest as it provides
the opportunity to therapeutically target TRPC6 to interfere
with Ca2+-dependent signaling involved in cell invasion.
Conclusions
In the present study, we report that TRPC6 (11q22) is
overexpressed in HNSCC, and provide new evidence that
increase in gene dosage is a novel mechanism to activate
TRPC6 expression in cancer. Increased TRPC6 mRNA and
gene dosage was detected in both, cell lines and tumor tissues, revealing that this molecular alteration can be pathologically relevant in HNSCC. In addition, siRNA-induced
knockdown of TRPC6 expression in HNSCC-derived cells
dramatically inhibited HNSCC-cell invasion. Therefore,
TRPC6 is likely to be a target for amplification that confers
enhanced invasive behavior to HNSCC cells and, therefore,
may be a promising therapeutic target in the treatment of
HNSCC. These data provide the foundation for further
B
µm/h
SCC38
30
25
20
15
10
5
0
SCC38 SCC40 SCC42B
C
SCC40
SCC42B
Ctrli
D
150
100
50
0
Ci
TRPC6i
Relative invaded cells (%)
200
m/h
TRPC6i
E
120
100
80
60
40
20
0
Ci
TRPC6i
Figure 3 Inhibition of TRPC6 gene expression decreases cellular migration and invasion. (A and B) Wound healing assays were performed
in SCC38, SCC40 and SCC42B cells. The rate of front migration of cell monolayers was analyzed by time-lapse video microscopy. At least 15
different fields were randomly chosen across the wound length. Values are mean of average ± s.d. from three independent experiments. (C and
E) SCC42B cells treated with control (Ci) or TRPC6 siRNA (TRPC6i) were seeded in serum-free media in the upper chamber of Matrigel transwells.
The lower chamber was loaded with regular media supplemented with 10% fetal bovine serum and 5% BSA. After 24 h at 37°C in 5% CO2, the
top filter was scraped, and invading cells were fixed and stained. (C) Representative images captured with a 10 objective 24 h after seeding. (E)
All invading cells were counted under x10 magnification. Values are mean of average ± s.d. from three independent experiments done in
triplicate. (D) Inhibition of TRPC6 expression in SCC42B cells attenuates cell migration. Wound healing assays were performed in cells treated with
TRPC6- (TRPC6i) or control-siRNA (Ci). Values are mean of average ± s.d. from three independent experiments.
Bernaldo de Quirós et al. BMC Cancer 2013, 13:116
/>
functional validation of this putative candidate gene in
tumor tissues to determine whether it is crucial for tumor
development or progression.
Competing interests
The authors declare that they have no competing interests.
Authors’ contributions
SBQ and AM carried out the functional assays and the molecular genetic
studies. PS and IZ carried out the gene expression studies. ISS and ND
participated in the invasion assays. CS, EJ and RS participated in the acquisition
of the data and performed the statistical analysis. MDC conceived of the study,
participated in its design and coordination, and drafted the manuscript. All
authors read and approved the final manuscript.
Page 10 of 11
11.
12.
13.
14.
15.
Acknowledgements
This work was supported by Instituto de Salud Carlos III-Fondo de Investigación
Sanitaria [FIS PI11/929 to M.-D.C and C.S.]; Red Temática de Investigación
Cooperativa en Cáncer [RD12/0036/0015] Instituto de Salud Carlos III (ISCIII),
Spanish Ministry of Economy and Competitiveness & European Regional
Development Fund (ERDF); and Obra Social CajAstur-Instituto Universitario de
Oncología del Principado de Asturias.
Author details
1
Servicio de Otorrinolaringología, Hospital Universitario Central de Asturias,
Instituto Universitario de Oncología del Principado de Asturias, Universidad
de Oviedo, Oviedo, Spain. 2Laboratorio Oncología Molecular, Fundación para
la Investigación del Hospital General Universitario de Valencia, Valencia,
Spain. 3Departamento de Biotecnología, Universidad Politécnica de Valencia,
Valencia, Spain.
16.
17.
18.
19.
Received: 5 October 2012 Accepted: 7 March 2013
Published: 14 March 2013
20.
References
1. Akervall J: Genomic screening of head and neck cancer and its
implications for therapy planning. Eur Arch Otorhinolaryngol 2006,
263:297–304.
2. Squire JA, Bayani J, Luk C, Unwin L, Tokunaga J, MacMillan C, Irish J, Brown
D, Gullane P, Kamel-Reid S: Molecular cytogenetic analysis of head and
neck squamous cell carcinoma: by comparative genomic hybridization,
spectral karyotyping, and expression array analysis. Head Neck 2002,
24:874–887.
3. Perez-Ordonez B, Beauchemin M, Jordan RC: Molecular biology of
squamous cell carcinoma of the head and neck. J Clin Pathol 2006,
59:445–453.
4. Tan KD, Zhu Y, Tan HK, Rajasegaran V, Aggarwal A, Wu J, Wu HY, Hwang J,
Lim DT, Soo KC, Tan P: Amplification and overexpression of PPFIA1, a
putative 11q13 invasion suppressor gene, in head and neck squamous
cell carcinoma. Genes Chromosomes Cancer 2008, 47:353–362.
5. Rodrigo JP, Garcia LA, Ramos S, Lazo PS, Suarez C: EMS1 Gene
amplification correlates with poor prognosis in squamous cell
carcinomas of the head and neck. Clin Cancer Res 2000, 6:3177–3182.
6. Callender T, el-Naggar AK, Lee MS, Frankenthaler R, Luna MA, Batsakis JG:
PRAD-1 (CCND1)/cyclin D1 oncogene amplification in primary head and
neck squamous cell carcinoma. Cancer 1994, 74:152–158.
7. Huang X, Gollin SM, Raja S, Godfrey TE: High-resolution mapping of the
11q13 amplicon and identification of a gene, TAOS1, that is amplified
and overexpressed in oral cancer cells. Proc Natl Acad Sci U S A 2002,
99:11369–11374.
8. Gorogh T, Weise JB, Holtmeier C, Rudolph P, Hedderich J, Gottschlich S,
Hoffmann M, Ambrosch P, Csiszar K: Selective upregulation and
amplification of the lysyl oxidase like-4 (LOXL4) gene in head and neck
squamous cell carcinoma. J Pathol 2007, 212:74–82.
9. Begum A, Imoto I, Kozaki K, Tsuda H, Suzuki E, Amagasa T, Inazawa J:
Identification of PAK4 as a putative target gene for amplification within
19q13.12-q13.2 In oral squamous-cell carcinoma. Cancer Sci 2009,
100:1908–1916.
10. Secades P, Rodrigo JP, Hermsen M, Alvarez C, Suarez C, Chiara MD: Increase
in gene dosage is a mechanism of HIF-1alpha constitutive expression in
21.
22.
23.
24.
25.
26.
27.
28.
29.
30.
head and neck squamous cell carcinomas. Genes Chromosomes Cancer
2009, 48:441–454.
Singh B, Gogineni SK, Sacks PG, Shaha AR, Shah JP, Stoffel A, Rao PH:
Molecular cytogenetic characterization of head and neck squamous cell
carcinoma and refinement of 3q amplification. Cancer Res 2001,
61:4506–4513.
Baldwin C, Garnis C, Zhang L, Rosin MP, Lam WL: Multiple microalterations
detected at high frequency in oral cancer. Cancer Res 2005, 65:7561–7567.
Roman E, Meza-Zepeda LA, Kresse SH, Myklebost O, Vasstrand EN, Ibrahim
SO: Chromosomal aberrations in head and neck squamous cell
carcinomas in Norwegian and Sudanese populations by array
comparative genomic hybridization. Oncol Rep 2008, 20:825–843.
Weber RG, Sommer C, Albert FK, Kiessling M, Cremer T: Clinically distinct
subgroups of glioblastoma multiforme studied by comparative genomic
hybridization. Lab Invest 1996, 74:108–119.
Knuutila S, Bjorkqvist AM, Autio K, Tarkkanen M, Wolf M, Monni O,
Szymanska J, Larramendy ML, Tapper J, Pere H, et al: DNA copy number
amplifications in human neoplasms: review of comparative genomic
hybridization studies. Am J Pathol 1998, 152:1107–1123.
Menghi-Sartorio S, Mandahl N, Mertens F, Picci P, Knuutila S: DNA copy
number amplifications in sarcomas with homogeneously staining
regions and double minutes. Cytometry 2001, 46:79–84.
Imoto I, Tsuda H, Hirasawa A, Miura M, Sakamoto M, Hirohashi S, Inazawa J:
Expression of cIAP1, a target for 11q22 amplification, correlates with
resistance of cervical cancers to radiotherapy. Cancer Res 2002,
62:4860–4866.
Dai Z, Zhu WG, Morrison CD, Brena RM, Smiraglia DJ, Raval A, Wu YZ, Rush
LJ, Ross P, Molina JR, et al: A comprehensive search for DNA amplification
in lung cancer identifies inhibitors of apoptosis cIAP1 and cIAP2 as
candidate oncogenes. Hum Mol Genet 2003, 12:791–801.
Bashyam MD, Bair R, Kim YH, Wang P, Hernandez-Boussard T, Karikari CA,
Tibshirani R, Maitra A, Pollack JR: Array-based comparative genomic
hybridization identifies localized DNA amplifications and homozygous
deletions in pancreatic cancer. Neoplasia 2005, 7:556–562.
Helias-Rodzewicz Z, Perot G, Chibon F, Ferreira C, Lagarde P, Terrier P,
Coindre JM, Aurias A: YAP1 And VGLL3, encoding two cofactors of
TEAD transcription factors, are amplified and overexpressed in a
subset of soft tissue sarcomas. Genes Chromosomes Cancer 2010,
49:1161–1171.
Fernandez LA, Northcott PA, Dalton J, Fraga C, Ellison D, Angers S, Taylor
MD, Kenney AM: YAP1 Is amplified and up-regulated in hedgehogassociated medulloblastomas and mediates sonic hedgehog-driven
neural precursor proliferation. Genes Dev 2009, 23:2729–2741.
Muramatsu T, Imoto I, Matsui T, Kozaki K, Haruki S, Sudol M, Shimada Y,
Tsuda H, Kawano T, Inazawa J: YAP is a candidate oncogene for
esophageal squamous cell carcinoma. Carcinogenesis 2010, 32:389–398.
Chigurupati S, Venkataraman R, Barrera D, Naganathan A, Madan M, Paul L,
Pattisapu JV, Kyriazis GA, Sugaya K, Bushnev S, et al: Receptor channel
TRPC6 is a key mediator of notch-driven glioblastoma growth and
invasiveness. Cancer Res 2010, 70:418–427.
Ding X, He Z, Zhou K, Cheng J, Yao H, Lu D, Cai R, Jin Y, Dong B, Xu Y,
Wang Y: Essential role of TRPC6 channels in G2/M phase transition and
development of human glioma. J Natl Cancer Inst 2010, 102:1052–1068.
Lansford CDGR, Bier H, et al: Head and neck cancers. Dordrecht: Kluwer
Academic Press; 1999.
van den Ijssel P, Tijssen M, Chin SF, Eijk P, Carvalho B, Hopmans E, Holstege
H, Bangarusamy DK, Jonkers J, Meijer GA, et al: Human and mouse
oligonucleotide-based array CGH. Nucleic Acids Res 2005, 33:e192.
Livak KJ, Schmittgen TD: Analysis of relative gene expression data using
real-time quantitative PCR and the 2(−delta delta C(T)) method.
Methods 2001, 25:402–408.
Gollin SM: Chromosomal alterations in squamous cell carcinomas of the
head and neck: window to the biology of disease. Head Neck 2001,
23:238–253.
Smeets SJ, Braakhuis BJ, Abbas S, Snijders PJ, Ylstra B, van de Wiel MA,
Meijer GA, Leemans CR, Brakenhoff RH: Genome-wide DNA copy number
alterations in head and neck squamous cell carcinomas with or without
oncogene-expressing human papillomavirus. Oncogene 2006,
25:2558–2564.
Snijders AM, Schmidt BL, Fridlyand J, Dekker N, Pinkel D, Jordan RC,
Albertson DG: Rare amplicons implicate frequent deregulation of cell fate
Bernaldo de Quirós et al. BMC Cancer 2013, 13:116
/>
31.
32.
33.
34.
35.
36.
37.
38.
39.
40.
41.
42.
43.
44.
45.
46.
47.
48.
specification pathways in oral squamous cell carcinoma. Oncogene 2005,
24:4232–4242.
Canel M, Secades P, Garzon-Arango M, Allonca E, Suarez C, Serrels A, Frame
M, Brunton V, Chiara MD: Involvement of focal adhesion kinase in cellular
invasion of head and neck squamous cell carcinomas via regulation of
MMP-2 expression. Br J Cancer 2008, 98:1274–1284.
Canel M, Secades P, Rodrigo JP, Cabanillas R, Herrero A, Suarez C, Chiara
MD: Overexpression of focal adhesion kinase in head and neck
squamous cell carcinoma is independent of fak gene copy number.
Clin Cancer Res 2006, 12:3272–3279.
Neve RM, Chin K, Fridlyand J, Yeh J, Baehner FL, Fevr T, Clark L, Bayani N,
Coppe JP, Tong F, et al: A collection of breast cancer cell lines for the
study of functionally distinct cancer subtypes. Cancer Cell 2006,
10:515–527.
Jarvinen AK, Autio R, Kilpinen S, Saarela M, Leivo I, Grenman R, Makitie AA,
Monni O: High-resolution copy number and gene expression microarray
analyses of head and neck squamous cell carcinoma cell lines of tongue
and larynx. Genes Chromosomes Cancer 2008, 47:500–509.
Lockwood WW, Chari R, Coe BP, Girard L, Macaulay C, Lam S, Gazdar AF,
Minna JD, Lam WL: DNA amplification is a ubiquitous mechanism of
oncogene activation in lung and other cancers. Oncogene 2008,
27:4615–4624.
Weber A, Hengge UR, Stricker I, Tischoff I, Markwart A, Anhalt K, Dietz A,
Wittekind C, Tannapfel A: Protein microarrays for the detection of
biomarkers in head and neck squamous cell carcinomas. Hum Pathol
2007, 38:228–238.
Pacheco MM, Kowalski LP, Nishimoto IN, Brentani MM: Differential
expression of c-jun and c-fos mRNAs in squamous cell carcinoma of the
head and neck: associations with uPA, gelatinase B, and matrilysin
mRNAs. Head Neck 2002, 24:24–32.
Xie M, Sun Y, Li Y: Expression of matrix metalloproteinases in supraglottic
carcinoma and its clinical implication for estimating lymph node
metastases. Laryngoscope 2004, 114:2243–2248.
Werner JA, Rathcke IO, Mandic R: The role of matrix metalloproteinases in
squamous cell carcinomas of the head and neck. Clin Exp Metastasis 2002,
19:275–282.
Zhang L, Ye DX, Pan HY, Wei KJ, Wang LZ, Wang XD, Shen GF, Zhang ZY:
Yes-associated protein promotes cell proliferation by activating Fos
related activator-1 in oral squamous cell carcinoma. Oral Oncol 2011,
47:693–697.
Yokoyama T, Osada H, Murakami H, Tatematsu Y, Taniguchi T, Kondo Y,
Yatabe Y, Hasegawa Y, Shimokata K, Horio Y, et al: YAP1 Is involved in
mesothelioma development and negatively regulated by Merlin through
phosphorylation. Carcinogenesis 2008, 29:2139–2146.
Diep CH, Zucker KM, Hostetter G, Watanabe A, Hu C, Munoz RM, Von Hoff
DD, Han H: Down-regulation of Yes associated protein 1 expression
reduces cell proliferation and clonogenicity of pancreatic cancer cells.
PLoS One, 7:e32783.
Kang W, Tong JH, Chan AW, Lee TL, Lung RW, Leung PP, So KK, Wu K, Fan
D, Yu J, et al: Yes-associated protein 1 exhibits oncogenic property in
gastric cancer and its nuclear accumulation associates with poor
prognosis. Clin Cancer Res 2011, 17:2130–2139.
Overholtzer M, Zhang J, Smolen GA, Muir B, Li W, Sgroi DC, Deng CX,
Brugge JS, Haber DA: Transforming properties of YAP, a candidate
oncogene on the chromosome 11q22 amplicon. Proc Natl Acad Sci U S A
2006, 103:12405–12410.
Guilbert A, Dhennin-Duthille I, Hiani YE, Haren N, Khorsi H, Sevestre H,
Ahidouch A, Ouadid-Ahidouch H: Expression of TRPC6 channels in human
epithelial breast cancer cells. BMC Cancer 2008, 8:125.
Yue D, Wang Y, Xiao JY, Wang P, Ren CS: Expression of TRPC6 in benign
and malignant human prostate tissues. Asian J Androl 2009, 11:541–547.
Cai R, Ding X, Zhou K, Shi Y, Ge R, Ren G, Jin Y, Wang Y: Blockade of TRPC6
channels induced G2/M phase arrest and suppressed growth in human
gastric cancer cells. Int J Cancer 2009, 125:2281–2287.
Shi Y, Ding X, He ZH, Zhou KC, Wang Q, Wang YZ: Critical role of TRPC6
channels in G2 phase transition and the development of human
oesophageal cancer. Gut 2009, 58:1443–1450.
Page 11 of 11
49. Thebault S, Flourakis M, Vanoverberghe K, Vandermoere F, Roudbaraki M,
Lehen’kyi V, Slomianny C, Beck B, Mariot P, Bonnal JL, et al: Differential
role of transient receptor potential channels in Ca2+ entry and
proliferation of prostate cancer epithelial cells. Cancer Res 2006,
66:2038–2047.
50. El Boustany C, Bidaux G, Enfissi A, Delcourt P, Prevarskaya N, Capiod T:
Capacitative calcium entry and transient receptor potential canonical 6
expression control human hepatoma cell proliferation. Hepatology 2008,
47:2068–2077.
doi:10.1186/1471-2407-13-116
Cite this article as: Bernaldo de Quirós et al.: Identification of TRPC6 as a
possible candidate target gene within an amplicon at 11q21-q22.2 for
migratory capacity in head and neck squamous cell carcinomas. BMC
Cancer 2013 13:116.
Submit your next manuscript to BioMed Central
and take full advantage of:
• Convenient online submission
• Thorough peer review
• No space constraints or color figure charges
• Immediate publication on acceptance
• Inclusion in PubMed, CAS, Scopus and Google Scholar
• Research which is freely available for redistribution
Submit your manuscript at
www.biomedcentral.com/submit