Mortality risk of black women and white women with invasive breast cancer by hormone receptors, HER2, and p53 status
Bạn đang xem bản rút gọn của tài liệu. Xem và tải ngay bản đầy đủ của tài liệu tại đây (346.12 KB, 11 trang )
Ma et al. BMC Cancer 2013, 13:225
/>
RESEARCH ARTICLE
Open Access
Mortality risk of black women and white women
with invasive breast cancer by hormone
receptors, HER2, and p53 status
Huiyan Ma1*, Yani Lu1, Kathleen E Malone2, Polly A Marchbanks3, Dennis M Deapen4, Robert Spirtas6,
Ronald T Burkman7, Brian L Strom8, Jill A McDonald3, Suzanne G Folger3, Michael S Simon9, Jane Sullivan-Halley1,
Michael F Press5 and Leslie Bernstein1
Abstract
Background: Black women are more likely than white women to have an aggressive subtype of breast cancer that
is associated with higher mortality and this may contribute to the observed black-white difference in mortality.
However, few studies have investigated the black-white disparity in mortality risk stratified by breast cancer subtype,
defined by estrogen receptor (ER), progesterone receptor (PR) and human epidermal growth factor receptor 2
(HER2) status. Furthermore, it is not known whether additional consideration of p53 protein status influences
black-white differences in mortality risk observed when considering subtypes defined by ER, PR and HER2 status.
Methods: Four biomarkers were assessed by immunohistochemistry in paraffin-embedded breast tumor tissue from
1,204 (523 black, 681 white) women with invasive breast cancer, aged 35–64 years at diagnosis, who accrued a
median of 10 years’ follow-up. Multivariable Cox proportional hazards regression models were fit to assess
subtype-specific black-white differences in mortality risk.
Results: No black-white differences in mortality risk were observed for women with triple negative (ER-negative
[ER-], PR-, and HER2-) subtype. However, older (50–64 years) black women had greater overall mortality risk than
older white women if they had been diagnosed with luminal A (ER-positive [ER+] or PR+ plus HER2-) breast cancer
(all-cause hazard ratio, HR, 1.88; 95% confidence interval, CI, 1.18 to 2.99; breast cancer-specific HR, 1.51; 95% CI, 0.83
to 2.74). This black-white difference among older women was further confined to those with luminal A/p53- tumors
(all-cause HR, 2.22; 95% CI, 1.30 to 3.79; breast cancer-specific HR, 1.89; 95% CI, 0.93 to 3.86). Tests for homogeneity
of race-specific HRs comparing luminal A to triple negative subtype and luminal A/p53- to luminal A/p53+ subtype
did not achieve statistical significance, although statistical power was limited.
Conclusions: Our findings suggest that the subtype-specific black-white difference in mortality risk occurs mainly
among older women diagnosed with luminal A/p53- breast cancer, which is most likely treatable. These results
further suggest that factors other than subtype may be relatively more important in explaining the increased
mortality risk seen in older black women.
Keywords: Breast cancer, Mortality, Racial disparity, Triple negative, Luminal A, ER, PR, HER2, p53
* Correspondence:
1
Division of Cancer Etiology, Department of Population Sciences, Beckman
Research Institute, City of Hope, Duarte, CA 91010, USA
Full list of author information is available at the end of the article
© 2013 Ma et al.; licensee BioMed Central Ltd. This is an Open Access article distributed under the terms of the Creative
Commons Attribution License ( which permits unrestricted use, distribution, and
reproduction in any medium, provided the original work is properly cited.
Ma et al. BMC Cancer 2013, 13:225
/>
Background
Although mortality following breast cancer diagnosis has
decreased substantially in the United States over the last
three decades, a large black-white difference remains.
Black women have higher risk of death after breast cancer
diagnosis than white women [1,2] and are more likely than
white women to have an aggressive subtype of breast cancer that is associated with a higher mortality [3], which
could contribute to the observed black-white mortality difference. However, only a few studies have investigated the
black-white disparity in mortality risk by breast cancer
subtype as defined by estrogen receptor (ER), progesterone receptor (PR), and human epidermal growth factor receptor 2 (HER2) status [4-7]. Furthermore, little is known
whether additional consideration of p53 protein status has
any influence on black-white differences in mortality risk
within subtype strata.
Breast cancer is a heterogeneous disease; its subtypes
have been classified as triple negative (TN) (ER-negative
[ER-], PR-, and HER2-), luminal A (ER-positive [ER+] or
PR+ plus HER2-), luminal B (ER+ or PR+ plus HER2+),
and HER2-enriched (ER-/PR-/HER2+) subtype [8-16].
Gene expression studies using cDNA microarray technology show that TN breast cancers are often characterized
by a “basal-like” molecular profile [17], characteristic of
the basal epithelial cell layer, including high level expression of HER1 and/or genes encoding cytokeratins 5/6 [3].
Because cDNA microarray technology is not yet available
clinically for identifying basal-like subtype, the TN subtype
has become a commonly used proxy for the “basal-like”
subtype in clinical and epidemiologic studies, despite the
fact that TN subtype and basal-like subtype are discordant
in 20-30% of cases [17,18].
TN breast tumors, which account for 10-25% of all
invasive breast cancers [19,20], have poorer prognosis
than luminal A, the most common subtype [8,9,13]. While
ER+ breast cancers respond favorably to anti-estrogen
therapy and HER2+ breast cancers respond favorably to
trastuzumab therapy [20,21], no targeted therapies currently exist for TN breast cancer. Studies have consistently
shown that TN breast cancers comprise a higher proportion of breast cancers in black women than white women
[3,4,11,22-24]. However, little research has been done
examining the extent to which black-white mortality differences exist within each specific breast cancer subtype.
Two studies reported that the black-white differences in
all-cause mortality [4] and breast cancer-specific mortality
[6] were limited to the TN subtype. A third study reported
that the crude all-cause mortality risk was greater among
black women than white women irrespective of the subtypes defined by ER, PR, and HER2 status [7]. The
Carolina Breast Cancer Study found instead, that the
black-white differences in breast cancer-specific mortality
occurred among women diagnosed with luminal A breast
Page 2 of 11
cancer, but not among those diagnosed with basal-like
breast cancer [5].
p53 is a tumor suppressor gene, which encodes the
p53 protein [25,26]. p53 protein is involved in gene transcription, DNA synthesis/repair, genomic plasticity and
programmed cell death [27]. Mutations in p53 have been
identified in approximately 15-35% of breast cancers
[28-30] and are associated with resistance to chemotherapy, radiotherapy [31] and poor prognosis [32]. p53 mutations occur more frequently in breast cancers of black
women than in those of white women [33] and these mutations are more common in breast cancers that are
ER-/PR- [34], TN [35], or basal-like [3,34] than in breast
cancers that are ER+ or PR+. p53 mutations, especially
missense mutations, are highly correlated with the p53
protein overexpression in tumor tissue [36,37]. One epidemiologic study examined the effect of p53 status on allcause morality for African American (AA) women and
non-AA women, respectively, and found that having a
p53+ tumor adversely affected prognosis among AA
women but not non-AA women after controlling for multiple variables including the individual status of ER, PR and
HER2 or subtype as determined by 3 or 5 marker panels.
No analyses were reported on whether the overexpression
status of p53 protein impacted the black-white disparity in
mortality within strata of breast cancer subtype [7].
We have previously shown that white women with invasive breast cancer participating in the Women’s Contraceptive and Reproductive Experiences (CARE) Study who
had higher body mass index (BMI) had higher mortality
risk than those with a normal (not overweight) BMI; but
this association did not hold for black women [38]. Here,
we determine the extent to which black-white differences
in breast cancer-specific and all-cause mortality differ for
TN, luminal A, luminal B, and HER2-enriched breast cancers in a substudy conducted at two participating study
sites where tumor tissue was collected. We then assess
whether any black-white mortality differences that existed
for the two common breast cancer subtypes, TN and luminal A, are affected by p53 protein expression status.
Methods
Study population and data collection
The participants for this analysis are women from two
study sites, Detroit and Los Angeles (LA), participating
in the Women’s CARE Study, a population-based case–
control study designed to examine risk factors for invasive breast cancer among US-born black women and
white women including those of Hispanic ethnicity [39].
The Women’s CARE Study selected a stratified (by age
group) random sample of women aged 35 to 64 years
who were newly diagnosed with histologically confirmed
incident invasive breast cancer (International Classification of Diseases for Oncology codes C50.0–C50.9)
Ma et al. BMC Cancer 2013, 13:225
/>
between July 1994 and April 1998. Black women were
oversampled to maximize their numbers in the study,
and white women were sampled to provide approximately equal numbers of women in each 5-year age category (from 35 to 64 years). Race was based on
participants’ self-identification. From the two study sites,
the Women’s CARE Study recruited 1,921 breast cancer
patients (Detroit: 679, LA: 1,242). These two study sites
were selected to collect tumor tissue samples based on
representative case participants in the Women’s CARE
Study and the ability to obtain tumor tissue samples. All
participants provided written informed consent. The
study protocol was approved by the Institutional Review
Boards at the University of Southern California (IRB#:
HS-923048), the Karmanos Comprehensive Cancer Center
at Wayne State University (IRB#: WSU HIC# H 04-09-96
(M05)-FB), the Centers for Disease Control and Prevention
(IRB#: 1862), and the City of Hope (IRB#: 08098).
Assessment of biomarkers
Paraffin-embedded tumor blocks were obtained from
pathology laboratories where diagnoses were made for
1,333 participating breast cancer cases (Detroit: 414, LA:
919), approximately 80% of those requested. Tumor
blocks were carefully reviewed and evaluated in the centralized pathology laboratory of Dr. Michael F. Press at
the University of Southern California.
We excluded 127 case samples because the tumor blocks
contained only carcinoma in situ (n = 56) or no tumor tissue (n = 46); had insufficient tissue for assay (n = 3); had
other problems (n = 14); or only hematoxlin-and-eosin
stained tissue sections were received (n = 8). The expression of ER, PR, HER2, and p53 was determined for the
remaining 1,206 samples (Detroit: 367, LA: 839).
The expression of ER and PR was determined using previously published immunohistochemistry (IHC) methods
[40,41]. Immunostaining results for ER and PR expression
were interpreted in a blind fashion and scored semiquantitatively on the basis of the visually estimated percentage of
positively stained tumor cell nuclei. At least 100 tumor
cells were examined for each specimen; ≥ 1% immunostained tumor cell nuclei was considered positive for ER
and PR status [42].
HER2 expression was determined by IHC using
the 10H8 monoclonal antibody [43,44] to assess HER2
membrane protein immunostaining. No (0) or weak (1+)
membrane immunostaining was considered low HER2 expression (HER2-). Moderate (2+) or strong membrane immunostaining (3+) was considered HER2 overexpression
(HER2+) based on previous validation results from the
same pathology laboratory, indicating over 90% specimen
samples scored as 2+ (80.6%) or 3+ (98.9%) by 10H8-IHC
showed HER-2 gene amplification by fluorescent in situ
hybridization (FISH) analysis [43].
Page 3 of 11
The expression of p53 protein was determined by IHC
using the monoclonal mouse antibodies DO7 (Oncogene
Science, Inc. Cambridge, MA) and BP 53-12-1 (Biogenex)
to measure p53 nuclear protein immunostaining. Based
on findings from previous studies, comparing p53 mutations in exons 2–11 with p53 protein expression levels
[37,45], ≥10% nuclear staining for p53 protein was deemed
positive [46].
Tumor characteristics from SEER
The Women’s CARE Study collected tumor stage, tumor
histologic grade, and other tumor characteristics. We excluded two more women because they were missing information on tumor stage, resulting in the final sample size
of 1,204 (523 black, 681 white) women for the analyses.
Vital status follow-up
Women were followed up annually for vital status, date
of death and cause of death using standard SEER followup procedures. Women from Detroit were followed
through December 31, 2004; follow-up extended until
December 31, 2007 in LA.
Statistical analyses
We used Pearson Chi-squared tests to compare frequency distributions of categorical variables between
black women and white women.
Adjusted estimates of the hazard ratio (HR) of death, a
measure of relative risk, and its 95% confidence interval
(CI), comparing black women to white women, were calculated for each breast cancer subtype of interest using
Cox proportional hazards regression models [47]. Two
Cox proportional hazards regression models were applied. In Model 1, we used age (in days) at diagnosis and
at death or end of follow-up as the time scale, and stratified by single years of age at diagnosis and adjusted for
study site. In the analyses of breast cancer-specific mortality (International Classification of Diseases codes
ICD9-174, ICD10-C50), women who died from other
causes were censored on their dates of death. In Model
2, we additionally adjusted for tumor stage. Tumor grade
was not included in Model 2 since it did not cause more
than a 10% change in any of the risk estimates. We
conducted the analyses for all women and separately for
two age groups (younger: 35–49, older: 50–64 years at
diagnosis). Homogeneity of race-specific HRs across different subtypes was evaluated using a Z test of the differences in adjusted log race-specific HRs divided by the
square root of the sum of the variances of the two racespecific log HRs [48]. Since 9 black women and 73 white
women reported Hispanic ethnicity, we repeated all the
analyses after excluding these 82 women. Our results
remained similar. Therefore, we present the results
based on the analyses of all participants.
Ma et al. BMC Cancer 2013, 13:225
/>
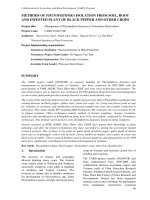
Kaplan-Meier breast cancer-specific curves [49] were
constructed to demonstrate black-white survival differences observed in older women with luminal A invasive
breast cancer.
We considered a two-sided P value less than 0.05 as
statistically significant when testing for homogeneity of
HRs across subtypes of breast cancer. All statistical analyses were performed using SAS version 9.2 software
(SAS Institute, Cary, NC).
Page 4 of 11
breast cancer-specific mortality were attenuated. The
HR for black-white difference in older women diagnosed
with luminal A/p53- breast cancer decreased from 2.53
(95% CI, 1.27 to 5.04) to 1.89 (95% CI, 0.93 to 3.86).
Black-white difference in all-cause mortality
During a median follow-up of 10 years (9.9 years and 10.0
years for black women and white women, respectively),
272 (141 black and 131 white) women died specifically
from breast cancer and 63 (39 black and 24 white) women
died from other causes. Compared with white women,
black women were more likely to be diagnosed with
ER-, PR-, TN, p53+, non-localized, or higher grade tumors
(all P < 0.001, Table 1). The frequency distribution of
HER2 in black women was not statistically significantly
different from that of white women overall (P = 0.16) or in
younger women 35 to 49 years of age (P = 0.98), whereas
older black women 50 to 64 years of age were more likely
to be diagnosed with HER2+ tumors than white women in
the same age group (P = 0.04).
Similar to the results for breast cancer-specific mortality,
the black-white difference in all-cause mortality risk
after controlling for age at diagnosis and study site was
observed among older women with luminal A tumors
(HR, 2.21; 95% CI, 1.40 to 3.47, Table 3), but not among
younger women diagnosed with luminal A tumor or
among women diagnosed with TN tumor regardless of
age group. When further stratified by p53 protein expression status, the black-white difference in all-cause
mortality was observed only among older women diagnosed with luminal A/p53- breast cancer (HR, 2.49; 95%
CI, 1.47 to 4.22).
The observed black-white differences in all-cause mortality were also decreased after additionally controlling
for tumor stage, but the magnitude of the decrease
appeared smaller than that observed for breast cancerspecific mortality. The HR for black-white difference in
all-cause mortality in older women diagnosed with luminal A/p53- breast cancer decreased from 2.49 (95%
CI, 1.47 to 4.22) to 2.22 (95% CI, 1.30 to 3.79).
Black-white difference in breast cancer-specific mortality
Test for homogeneity across subtypes
After controlling for age at diagnosis and study site,
black-white differences for breast cancer-specific mortality risk were observed among women diagnosed with luminal A breast cancer (HR, 1.52; 95% CI, 1.01 to 2.28),
but not among those diagnosed with TN breast cancer
(HR, 1.21; 95% CI, 0.81 to 1.83, Table 2). The magnitude
of race-specific HR estimates for other subtypes (luminal
B and HER2-enriched) was at least as great as that for luminal A but due to small numbers for these subtypes (and
thus few deaths), 95% CIs included 1.0. Analyses by age
group at diagnosis (35–49 versus 50–64 years) showed
that the black-white differences in breast cancer-specific
mortality predominately existed among older women with
luminal A tumors (HR, 2.07; 95% CI, 1.16 to 3.70), but not
in younger women diagnosed with luminal A tumor or
among women diagnosed with TN tumor regardless of
age group. When older women were further stratified by
p53 protein expression, the black-white difference in mortality risk was observed among those with luminal A tumors that were p53- (HR, 2.53; 95% CI, 1.27 to 5.04,
Figure 1).
Since black women are more likely than white women
to be diagnosed with advanced stages of breast cancer,
which is associated with a higher risk of mortality [50],
we additionally controlled for tumor stage in our analysis. Then, the observed black-white differences in
Although black-white differences in mortality after
breast cancer diagnosis were observed only among older
women diagnosed with luminal A and luminal A/p53subtype, no tests for homogeneity of race-specific HRs
across subtypes achieved statistical significance (results
not shown).
Results
Study population characteristics
Discussion
In the current analysis of 1,204 women 35 to 64 years of
age, with a median follow-up of 10 years, we did not observe any statistically significant black-white differences
in cancer-specific or all-cause mortality among women
diagnosed with TN subtype. We did, however, find that
black women had statistically significant greater allcause mortality risk than white women among those
ages 50–64 years who were diagnosed with luminal A
tumors, and more specifically among those diagnosed
with luminal A/p53- breast cancer. However, no tests for
homogeneity of race-specific HRs comparing luminal A
to TN subtype and luminal A/p53- to luminal A/p53+
subtype achieved statistical significance.
The results from four previous epidemiologic studies
that compared mortality risk or survival in black and
white women diagnosed with luminal A or TN or basallike subtype are inconsistent [4-7]. One study with 11 to
13 years of follow-up of 476 (116 black, 360 white)
Ma et al. BMC Cancer 2013, 13:225
/>
Page 5 of 11
Table 1 Percent distribution of selected characteristics at diagnosis in 1,204 women with invasive breast cancer
All women
White
Black
n=681
n=523
Study site
Pa
Younger women
Older women
(ages 35–49 y)
(ages 50–64 y)
White
Black
n=345
n=272
0.01
Los Angeles
66.7
73.2
Detroit
33.3
26.8
Age at diagnosis, years
Pa
White
Black
n=336
n=251
68.5
74.9
31.6
25.1
0.07
64.9
71.7
35.1
28.3
0.004
0.09
<0.001
35-39
21.4
14.2
42.3
27.2
-
-
40-44
15.9
19.5
31.3
37.5
-
-
45-49
13.4
18.4
26.4
35.3
-
-
50-54
18.7
17.6
-
-
37.8
36.7
55-59
14.5
16.4
-
-
29.5
34.3
60-64
16.2
14.0
-
-
32.7
29.1
ER status
<0.001
0.05
36.9
48.8
46.4
54.4
27.1
42.6
ER+
63.1
51.2
53.6
45.6
72.9
57.4
PR-
38.5
52.4
42.6
54.0
34.2
50.6
PR+
61.5
47.6
57.4
46.0
65.8
49.4
HER2-
83.3
80.1
81.2
81.3
85.4
78.9
HER2+
16.7
19.9
18.8
18.7
14.6
21.1
TN
23.8
33.5
30.4
39.0
17.0
27.5
Luminal A
59.5
46.7
50.7
42.3
68.5
51.4
Luminal B
9.8
10.3
11.0
9.9
8.6
10.8
HER2-enriched
6.9
9.6
7.8
8.8
6.0
10.4
72.5
61.0
81.6
70.9
27.5
39.0
18.4
29.1
<0.001
HER2 status
<0.001
0.16
Subtypes defined by ER/PR/HER2
p53 status
<0.001
0.98
<0.001
0.04
0.12
<0.001
<0.001
p53-
77.0
65.8
p53+
23.0
34.2
Subtypes defined by ER/PR/HER2/p53
0.003
<0.001
0.003
0.03
<0.001
TN/p53-
14.4
16.6
18.0
18.8
10.7
14.3
TN/p53+
9.4
16.8
12.5
20.2
6.3
13.2
Luminal A/p53-
49.9
37.7
41.5
31.3
58.6
44.6
Luminal A/p53+
9.5
9.0
9.3
11.0
9.8
6.8
Luminal B/p53-
8.1
6.0
8.4
5.2
7.7
6.8
Luminal B/p53+
1.8
4.4
2.6
4.8
0.9
4.0
HER2-enriched/p53-
4.6
5.5
4.6
5.9
4.5
5.2
HER2-enriched/p53+
2.4
4.0
3.2
2.9
1.5
5.2
Stage
<0.001
0.007
0.001
Localized
63.1
51.1
56.5
45.6
69.9
57.0
Non-localized
36.9
49.0
43.5
54.4
30.1
43.0
Grade
0.42
<0.001
ER-
PR status
Pa
<0.001
0.006
<0.001
Low
12.5
8.6
9.6
6.6
15.5
10.8
Intermediate
63.1
53.0
58.6
49.3
67.9
57.0
High
24.4
38.4
31.9
44.1
16.7
32.3
P ascertained from Pearson χ2 test. Abbreviations: ER, estrogen receptor; PR, progesterone receptor; HER, human epidermal growth factor receptor; TN, triple
negative. Note: TN = ER-/PR-/HER2-, Luminal A = ER+ or PR+ plus HER2-, Luminal B = ER+ or PR+ plus HER2+, HER2-enriched = ER-/PR-/HER2+.
a
Ma et al. BMC Cancer 2013, 13:225
/>
Page 6 of 11
Table 2 Adjusted HRs of breast cancer-specific mortality associated with race (black women vs. white women)
White
Model 1a
Black
Model 2a,b
Person-years
Death (No.)
Person-years
Death (No.)
HR
95% CI
HR
95% CI
6246
131
4471
141
1.54
1.21 to 1.97
1.26
0.99 to 1.62
TN
1341
46
1381
57
1.21
0.81 to 1.83
1.08
0.71 to 1.64
Luminal A
3853
56
2235
47
1.52
1.01 to 2.28
1.23
0.81 to 1.86
Luminal B
643
16
481
14
1.67
0.67 to 4.19
0.98
0.27 to 3.58
HER2-enriched
408
13
375
23
2.27
0.87 to 5.93
1.95
0.71 to 5.37
All women
Subtypes defined by ER/PR/HER2
Subtypes defined by ER/PR/HER2/p53
TN/p53-
825
24
664
30
1.38
0.76 to 2.51
1.32
0.70 to 2.47
TN/p53+
516
22
717
27
1.04
0.56 to 1.93
1.03
0.55 to 1.95
Luminal A/p53-
3262
39
1814
33
1.50
0.92 to 2.44
1.22
0.74 to 2.04
Luminal A/p53+
591
17
421
14
1.10
0.40 to 2.97
0.81
0.28 to 2.39
3066
83
2248
84
1.45
1.06 to 1.99
1.21
0.87 to 1.66
Younger women (ages 35–49 yrs)
Subtypes defined by ER/PR/HER2
TN
Luminal A
861
33
785
39
1.30
0.80 to 2.12
1.11
0.67 to 1.84
1623
31
1069
22
1.16
0.65 to 2.05
1.01
0.56 to 1.80
513
17
372
19
1.38
0.67 to 2.85
1.39
0.66 to 2.95
Subtypes defined by ER/PR/HER2/p53
TN/p53TN/p53+
Luminal A/p53Luminal A/p53+
Older women (ages 50–64 yrs)
349
16
413
20
1.14
0.56 to 2.35
1.07
0.51 to 2.25
1329
23
792
12
0.86
0.41 to 1.80
0.77
0.36 to 1.63
294
8
277
10
1.04
0.23 to 4.63
0.80
0.17 to 3.72
3181
48
2223
57
1.71
1.16 to 2.53
1.38
0.93 to 2.04
480
13
596
18
1.00
0.47 to 2.10
1.03
0.48 to 2.20
2231
25
1167
25
2.07
1.16 to 3.70
1.51
0.83 to 2.74
Subtypes defined by ER/PR/HER2
TN
Luminal A
Subtypes defined by ER/PR/HER2/p53
TN/p53-
313
7
292
11
1.56
0.52 to 4.67
1.34
0.41 to 4.37
TN/p53+
167
6
304
7
0.79
0.23 to 2.71
0.87
0.24 to 3.14
Luminal A/p53-
1934
16
1022
21
2.53
1.27 to 5.04
1.89
0.93 to 3.86
Luminal A/p53+
297
9
144
4
1.16
0.31 to 4.35
0.90
0.15 to 5.48
HRs are from multivariable Cox proportional hazards regression models using age (in days) at diagnosis and at death or end of follow-up as the time scale and
stratified by single years of age at diagnosis. aAdjusted for study site. bAdditionally adjusted for tumor stage. Abbreviations: HR, hazard ratio; CI, confidence
interval. ER, estrogen receptor; PR, progesterone receptor; HER, human epidermal growth factor receptor; TN, triple negative. Note: TN = ER-/PR-/HER2-, Luminal
A = ER+ or PR+ plus HER2-, Luminal B = ER+ or PR+ plus HER2+, HER2-enriched = ER-/PR-/HER2+.
Atlanta women diagnosed between 1990 and 1992 with
invasive breast cancer at ages 20–54 years found that
risk of all-cause mortality was greater among black
women than among white women for both luminal A
cancer (unadjusted HR, 1.6; 95% CI, 1.1 to 2.4) and TN
breast cancer (unadjusted HR, 2.1; 95% CI, 1.3 to 3.3).
The racial difference disappeared for luminal A breast
cancer after adjustment for age, stage, and grade (adjusted HR, 1.1; 95% CI, 0.7 to 1.6), whereas it persisted
for TN breast cancer even after additional adjustment
for poverty level, treatment, and comorbidities (adjusted
HR, 2.0; 95% CI, 1.0 to 3.7) [4]. A second, smaller study
followed 124 (88 black, 36 white) women ages 26–82
years with invasive TN breast cancer treated at the University of Tennessee Cancer Institute, Memphis, between 2003 and 2008 for a median of 23 months [6].
Older black breast cancer patients (≥55 years at diagnosis) with TN breast cancer had poorer breast cancerspecific survival than older white women. A third study
compared 331 lower income AA women with 203 lower
income non-AA women consisting of 115 Hispanic and
88 non-Hispanic white women, who were treated for
breast cancer at a large urban public hospital providing
care to the medically uninsured in metropolitan Chicago
between 2000 and 2005 [7]. This study found that AA
women had a higher crude all-cause mortality risk than
Ma et al. BMC Cancer 2013, 13:225
/>
Page 7 of 11
Estimated probability of survival
1.0
0.9
0.8
0.7
Luminal A/p53-, White
Luminal A/p53-, Black
0.6
Luminal A/p53+, White
Luminal A/p53+, Black
0.5
0
1
2
3
4
5
6
7
8
9
10
11
12
13
14
Years since diagnosis
Figure 1 Kaplan-Meier breast cancer-specific survival of older black women vs. older white women diagnosed with luminal A invasive
breast cancer sub-typed by p53.
non-AA women (HR, 1.45; 95% CI, 1.03 to 2.05) irrespective of the subtypes defined by ER, PR, and HER2
status. Results from the Carolina Breast Cancer Study,
which followed 1,149 (518 black, 631 white) women with
invasive breast cancer from diagnosis between 1993 and
2001 through 2006, are consistent with our results. This
study found that the black-white difference in breast
cancer-specific mortality was observed for women diagnosed with luminal A breast cancer, but not for those diagnosed with basal-like (ER-/PR-/HER2- plus HER1+
and/or CK 5/6+) breast cancer (age-, date of diagnosis-,
and stage at diagnosis-adjusted HR, 1.9; 95% CI, 1.3 to
2.9 and HR, 1.3; HR, 0.8 to 2.3 for luminal A and basallike breast cancer, respectively) [5].
An analysis comparing the outcomes of 405 black
women with 4,412 nonblack women who had stage I-III
breast cancer and who participated in a National Cancer
Institute-sponsored randomized phase III trial also provides supporting evidence for our results [51]. Breast
cancer-specific and overall survival was lower in black
women with luminal A disease than in nonblack women,
but no racial differences were observed for women with
other subtypes of breast cancer.
Based on our knowledge, this is the first study to
examine if the overexpression status of p53 protein impacts the black-white disparities in mortality of TN or
luminal A breast cancer. Our data showed that p53 protein expression status could impact black-white mortality differences, and this was most evident for older
women diagnosed with luminal A breast cancer. A possible explanation for no black-white difference in mortality risk for older women with luminal A/p53+ tumor is
that luminal A/p53+ tumor is currently less likely to be
treatable for either black women or white women since
mutations in p53 are associated with resistance to
chemotherapy, radiotherapy, and poor prognosis [31,32].
The reasons for a statistically significantly higher risk in
all-cause mortality rather than in breast cancer-specific
mortality in older black women diagnosed with luminal
A/p53- tumor than their white counterparts, could be
related to several adverse factors for overall survival,
such as more comorbidities [7,52] and less access to adequate health care because of lower socioeconomic status [53]. The adjustments for all these factors could
attenuate the observed black-white difference in allcause mortality risk. Unfortunately, we have data only
for potential comorbidities diagnosed prior to breast
cancer and for education which can serve as as a rough
proxy for social economic status. In our study, the HR
for black-white difference in all-cause mortality in older
women diagnosed with luminal A/p53- breast cancer decreased from 2.22 (95% CI, 1.30 to 3.79) to 1.64 (0.90 to
3.01) and the HR for black-white difference in breast
cancer-specific mortality in older women diagnosed with
luminal A/p53- breast cancer decreased from 1.89 (95%
CI, 0.93 to 3.86) to 1.50 (95% CI, 0.66 to 3.43), after
additionally adjusting for the number of comorbidities
(zero, one, two or more including hypertension, myocardial infarction, stroke, diabetes, and cancers other
than nonmelanoma skin cancers) and education (≤high
school, technical school/some college, college graduate;
results not shown).
This study had several limitations. First, we were unable
to request tissue for all eligible women diagnosed with invasive breast cancer in the two study sites because of
funding constraints. However, we obtained paraffinembedded tissue for 80% of the samples requested. Second, we did not have breast cancer treatment information
Ma et al. BMC Cancer 2013, 13:225
/>
Page 8 of 11
Table 3 Adjusted HRs of all-cause mortality associated with race (black women vs. white women)
White
Model 1a
Black
Model 2a,b
Person-years
Death (No.)
Person-years
Death (No.)
HR
95% CI
HR
95% CI
6246
155
4471
180
1.65
1.32 to 2.06
1.42
1.13 to 1.78
TN
1341
50
1381
66
1.25
0.85 to 1.84
1.12
0.76 to 1.66
Luminal A
3853
75
2235
70
1.75
1.25 to 2.46
1.54
1.09 to 2.18
Luminal B
643
16
481
16
1.74
0.70 to 4.31
1.07
0.32 to 3.53
HER2-enriched
408
14
375
28
2.69
1.06 to 6.85
2.41
0.90 to 6.40
All women
Subtypes defined by ER/PR/HER2
Subtypes defined by ER/PR/HER2/p53
TN/p53-
825
26
664
34
1.45
0.82 to 2.54
1.38
0.77 to 2.49
TN/p53+
516
24
717
32
1.04
0.58 to 1.88
1.04
0.57 to 1.89
Luminal A/p53-
3262
55
1814
52
1.73
1.16 to 2.58
1.62
1.08 to 2.43
Luminal A/p53+
591
20
421
18
1.45
0.60 to 3.54
0.99
0.37 to 2.70
3066
90
2248
95
1.49
1.10 to 2.01
1.27
0.94 to 1.73
Younger women (ages 35–49 yrs)
Subtypes defined by ER/PR/HER2
TN
Luminal A
861
34
785
43
1.36
0.84 to 2.18
1.16
0.71 to 1.89
1623
36
1069
28
1.33
0.79 to 2.23
1.20
0.71 to 2.03
513
18
372
21
1.44
0.72 to 2.87
1.43
0.70 to 2.90
Subtypes defined by ER/PR/HER2/p53
TN/p53TN/p53+
Luminal A/p53Luminal A/p53+
Older women (ages 50–64 yrs)
349
16
413
22
1.21
0.60 to 2.47
1.13
0.54 to 2.36
1329
28
792
17
1.06
0.56 to 2.01
1.05
0.54 to 2.02
294
8
277
11
1.32
0.32 to 5.42
0.92
0.21 to 4.06
3181
65
2223
85
1.89
1.36 to 2.62
1.62
1.17 to 2.26
480
16
596
23
1.04
0.54 to 2.02
1.07
0.55 to 2.11
2231
39
1167
42
2.21
1.40 to 3.47
1.88
1.18 to 2.99
Subtypes defined by ER/PR/HER2
TN
Luminal A
Subtypes defined by ER/PR/HER2/p53
TN/p53-
313
8
292
13
1.66
0.61 to 4.54
1.48
0.50 to 4.41
TN/p53+
167
8
304
10
0.77
0.27 to 2.20
0.79
0.27 to 2.30
Luminal A/p53-
1934
27
1022
35
2.49
1.47 to 4.22
2.22
1.30 to 3.79
Luminal A/p53+
297
12
144
7
1.54
0.48 to 4.91
1.44
0.25 to 8.11
HRs are from multivariable Cox proportional hazards regression models using age (in days) at diagnosis and at death or end of follow-up as the time scale and
stratified by single years of age at diagnosis. aAdjusted for study site. bAdditionally adjusted for tumor stage. Abbreviations: HR, hazard ratio; CI, confidence
interval. ER, estrogen receptor; PR, progesterone receptor; HER, human epidermal growth factor receptor; TN, triple negative. Note: TN = ER-/PR-/HER2-, Luminal
A = ER+ or PR+ plus HER2-, Luminal B = ER+ or PR+ plus HER2+, HER2-enriched = ER-/PR-/HER2+.
available and therefore did not adjust for treatments in our
analyses. Although we have presumed that controlling for
age, stage of disease, and the status of the four tumor
markers has provided some control for treatment, previous
studies have reported that black women may receive less
optimal treatment than white women [54-58]. Black
women are more likely to delay the initiation of treatment
[54], less likely to receive surgery [55] or optimal adjuvant
systemic therapy [56], less likely to adhere to recommended treatment regimens [57], and more likely to terminate
treatment prematurely [58] than white women. If any
black-white differences in treatment existed in our participants, the HRs for a black-white difference in mortality risk
could be overestimated, but it is unlikely that this bias
would differ across tumor subtypes. Third, although our
HRs for a black-white difference in both breast cancerspecific and all-cause mortality suggest that a large blackwhite difference in mortality risk may exist in women
diagnosed with HER2-enriched tumors, the number of
deaths was limited for this analysis. Fourth, due to funding
limitations, we evaluated p53 protein expression, but not
p53 mutations. Although previous research shows that p53
protein expression and p53 mutation status determined by
FISH analysis are strongly correlated, our assessment of
p53 protein expression by IHC may have misclassified some tumors. Fifth, although the agreement in the
Ma et al. BMC Cancer 2013, 13:225
/>
classification for ER and PR status between the SEER registry and centralized laboratory was substantial [59], we repeated the analyses for TN and luminal A and their
subtypes defined by p53 status using ER/PR status from
SEER instead of those from the centralized laboratory for
the 918 women who had both ER and PR expression status
in SEER; we obtained similar results (data not shown). Finally, our study provides evidence suggesting that blackwhite differences in mortality vary by tumor subtypes
among older women. However, the number of deaths
among older black women with TN subtype was small
resulting in limited statistical power to detect statistically
significant difference in race-specific HRs between luminal
A and TN breast cancer. The number of deaths among
older black women with luminal A/p53+ subtype was also
small resulting in limited statistical power to detect significant difference in race-specific HRs between luminal A/
p53- and luminal A/p53+ subtype. Therefore, confirmation
of our results will require larger studies to demonstrate statistically meaningful differences.
Conclusions
Our findings suggest that the black-white difference in
mortality risk is mainly among women 50 years or older
diagnosed with luminal A/p53- breast cancer, a subtype
for which treatments exist. These results further suggest
that factors other than subtype may be relatively more
important in explaining the increased mortality risk seen
in older black women.
Abbreviations
AA: African American; BMI: Body mass index; ER: Estrogen receptor;
PR: Progesterone receptor; HER: Human epidermal growth factor receptor;
TN: Triple negative; CARE: Contraceptive and reproductive experiences;
LA: Los Angeles; IHC: Immunohistochemistry; FISH: Fluorescent in situ
hybridization; HR: Hazard ratio; CI: Confidence interval.
Competing interests
The authors declare that they have no competing interests.
Authors’ contributions
RS, DMD, BLS, and LB participated in the study design and supervised the
collection and assembly of data. KEM, PAM, RTB, JAM, SGF, and JS supervised or
participated in the collection and assembly of data. HM conducted data
analyses and drafted the manuscript with LB’s input. All authors participated in
the revision of the manuscript and have read and approved the final version.
Acknowledgments
This work was supported by National Institute for Child Health and Human
Development grant NO1-HD-3-3175 and National Cancer Institute grant K05CA136967. Data collection for the Women's CARE Study was supported by
the National Institute of Child Health and Human Development and National
Cancer Institute, NIH, through contracts with Emory University (N01-HD-33168), Fred Hutchinson Cancer Research Center (N01-HD-2-3166), Karmanos
Cancer Institute at Wayne State University (N01-HD-3-3174), University of
Pennsylvania (NO1-HD-3-3276), and University of Southern California (N01HD-3-3175) and Interagency Agreement with Centers for Disease Control
and Prevention (Y01-HD-7022). Collection of cancer incidence data in LA
County by University of Southern California was supported by California
Department of Health Services as part of statewide cancer reporting
program mandated by California Health and Safety Code, Section 103885.
Support for use of SEER cancer registries through contracts N01-CN-65064
Page 9 of 11
(Detroit) and N01-PC-67010 (LA). Biomarker determination and analyses were
supported by a contract from the National Institute of Child Health and
Human Development (NO1-HD-3-3175) and a grant from the Breast Cancer
Research Foundation (MFPress).
The findings and conclusions in this report are those of the authors and do not
necessarily represent the official position of the Centers for Disease Control and
Prevention. Authors thank Dr. Karen Petrosyan, Armine Arakelyan, Hasmik
Toumaian, and Judith Udove for technical assistance in the performance of the
immunohistochemical assays for this study and the collaborators who
contributed to the development and conduct of the Women's CARE Study but
who did not directly contribute to the current study.
Author details
1
Division of Cancer Etiology, Department of Population Sciences, Beckman
Research Institute, City of Hope, Duarte, CA 91010, USA. 2Division of Public
Health Sciences, Fred Hutchinson Cancer Research Center, Seattle, WA 98109,
USA. 3Division of Reproductive Health, Centers for Disease Control and
Prevention, Atlanta, GA 30333, USA. 4Department of Preventive Medicine,
University of Southern California, Los Angeles, CA 90033, USA. 5Pathology,
Keck School of Medicine, University of Southern California, Los Angeles, CA
90033, USA. 6Formerly Contraceptive and Reproductive Health Branch,
Center for Population Research, National Institute of Child Health and
Development, Bethesda, MD 20892, USA. 7Department of Obstetrics and
Gynecology, Baystate Medical Center, Springfield, MA 01199, USA. 8Center for
Clinical Epidemiology and Biostatistics, Department of Biostatistics and
Epidemiology, University of Pennsylvania School of Medicine, Philadelphia,
PA 19104, USA. 9Karmanos Cancer Institute, Department of Oncology, Wayne
State University, Detroit, MI 48201, USA.
Received: 22 October 2012 Accepted: 1 May 2013
Published: 4 May 2013
References
1. Jatoi I, Anderson WF, Rao SR, Devesa SS: Breast cancer trends among black
and white women in the United States. J Clin Oncol 2005, 23(31):7836–7841.
2. U.S. Mortality Files NCfHS, CDC: Female breast cancer death rates by race and
ethnicity, U.S., 1999–2009. 2012. />race.htm.
3. Carey LA, Perou CM, Livasy CA, Dressler LG, Cowan D, Conway K, Karaca G,
Troester MA, Tse CK, Edmiston S, et al: Race, Breast Cancer Subtypes, and
Survival in the Carolina Breast Cancer Study. JAMA 2006, 295(21):2492–2502.
4. Lund MJ, Trivers KF, Porter PL, Coates RJ, Leyland-Jones B, Brawley OW,
Flagg EW, O'Regan RM, Gabram SG, Eley JW: Race and triple negative
threats to breast cancer survival: a population-based study in Atlanta,
GA. Breast Cancer Res Treat 2009, 113(2):357–370.
5. O'Brien KM, Cole SR, Tse CK, Perou CM, Carey LA, Foulkes WD, Dressler LG,
Geradts J, Millikan RC: Intrinsic breast tumor subtypes, race, and longterm survival in the Carolina Breast Cancer Study. Clin Cancer Res 2010,
16(24):6100–6110.
6. Sachdev JC, Ahmed S, Mirza MM, Farooq A, Kronish L, Jahanzeb M: Does
race affect outcomes in triple negative breast cancer? Breast Cancer
(Auckl) 2010, 4:23–33.
7. Dookeran KA, Dignam JJ, Holloway N, Ferrer K, Sekosan M, McCaskillStevens W, Gehlert S: Race and the prognostic influence of p53 in
women with breast cancer. Ann Surg Oncol 2012, 19(7):2334–2344.
8. Bauer KR, Brown M, Cress RD, Parise CA, Caggiano V: Descriptive analysis of
estrogen receptor (ER)-negative, progesterone receptor (PR)-negative,
and HER2-negative invasive breast cancer, the so-called triple-negative
phenotype: a population-based study from the California cancer
Registry. Cancer 2007, 109(9):1721–1728.
9. Carey LA, Dees EC, Sawyer L, Gatti L, Moore DT, Collichio F, Ollila DW, Sartor
CI, Graham ML, Perou CM: The triple negative paradox: primary tumor
chemosensitivity of breast cancer subtypes. Clin Cancer Res 2007,
13(8):2329–2334.
10. Dent R, Trudeau M, Pritchard KI, Hanna WM, Kahn HK, Sawka CA, Lickley LA,
Rawlinson E, Sun P, Narod SA: Triple-negative breast cancer: clinical features
and patterns of recurrence. Clin Cancer Res 2007, 13(15 Pt 1):4429–4434.
11. Ma H, Luo J, Press MF, Wang Y, Bernstein L, Ursin G: Is there a difference in
the association between percent mammographic density and subtypes
of breast cancer? Luminal A and triple-negative breast cancer. Cancer
Epidemiol Biomarkers Prev 2009, 18(2):479–485.
Ma et al. BMC Cancer 2013, 13:225
/>
12. Ma H, Wang Y, Sullivan-Halley J, Weiss L, Marchbanks PA, Spirtas R, Ursin G,
Burkman RT, Simon MS, Malone KE, et al: Use of four biomarkers to evaluate
the risk of breast cancer subtypes in the women's contraceptive and
reproductive experiences study. Cancer Res 2010, 70(2):575–587.
13. Onitilo AA, Engel JM, Greenlee RT, Mukesh BN: Breast cancer subtypes
based on ER/PR and Her2 expression: comparison of clinicopathologic
features and survival. Clin Med Res 2009, 7(1–2):4–13.
14. Phipps AI, Malone KE, Porter PL, Daling JR, Li CI: Reproductive and hormonal
risk factors for postmenopausal luminal, HER-2-overexpressing, and
triple-negative breast cancer. Cancer 2008, 113(7):1521–1526.
15. Yang XR, Chang-Claude J, Goode EL, Couch FJ, Nevanlinna H, Milne RL,
Gaudet M, Schmidt MK, Broeks A, Cox A, et al: Associations of breast
cancer risk factors with tumor subtypes: a pooled analysis from the
Breast Cancer Association Consortium studies. J Natl Cancer Inst 2011,
103(3):250–263.
16. Yang XR, Sherman ME, Rimm DL, Lissowska J, Brinton LA, Peplonska B, Hewitt
SM, Anderson WF, Szeszenia-Dabrowska N, Bardin-Mikolajczak A, et al:
Differences in risk factors for breast cancer molecular subtypes in a
population-based study. Cancer Epidemiol Biomarkers Prev 2007, 16(3):439–443.
17. Anders CK, Carey LA: Biology, metastatic patterns, and treatment of
patients with triple-negative breast cancer. Clin Breast Cancer 2009,
9(Suppl 2):S73–S81.
18. Kreike B, van Kouwenhove M, Horlings H, Weigelt B, Peterse H, Bartelink H,
van de Vijver MJ: Gene expression profiling and histopathological
characterization of triple-negative/basal-like breast carcinomas. Breast
Cancer Res 2007, 9(5):R65.
19. Perou CM: Molecular stratification of triple-negative breast cancers.
Oncologist 2011, 16(Suppl 1):61–70.
20. Schneider BP, Winer EP, Foulkes WD, Garber J, Perou CM, Richardson A,
Sledge GW, Carey LA: Triple-negative breast cancer: risk factors to
potential targets. Clin Cancer Res 2008, 14(24):8010–8018.
21. Hudis CA, Gianni L: Triple-negative breast cancer: an unmet medical
need. Oncologist 2011, 16(Suppl 1):1–11.
22. Millikan RC, Newman B, Tse CK, Moorman PG, Conway K, Smith LV, Labbok
MH, Geradts J, Bensen JT, Jackson S, et al: Epidemiology of basal-like
breast cancer. Breast Cancer Res Treat 2008, 109:123–139.
23. Kwan ML, Kushi LH, Weltzien E, Maring B, Kutner SE, Fulton RS, Lee MM,
Ambrosone CB, Caan BJ: Epidemiology of breast cancer subtypes in two
prospective cohort studies of breast cancer survivors. Breast Cancer Res
2009, 11(3):R31.
24. Trivers KF, Lund MJ, Porter PL, Liff JM, Flagg EW, Coates RJ, Eley JW: The
epidemiology of triple-negative breast cancer, including race. Cancer
Causes Control 2009, 20:1071–1082.
25. Baker SJ, Fearon ER, Nigro JM, Hamilton SR, Preisinger AC, Jessup JM,
VanTuinen P, Ledbetter DH, Barker DF, Nakamura Y, et al: Chromosome 17
deletions and p53 gene mutations in colorectal carcinomas. Science 1989,
244(4901):217–221.
26. Lane DP, Benchimol S: p53: oncogene or anti-oncogene? Genes Dev 1990,
4(1):1–8.
27. Gasparini G, Pozza F, Harris AL: Evaluating the potential usefulness of new
prognostic and predictive indicators in node-negative breast cancer
patients. J Natl Cancer Inst 1993, 85(15):1206–1219.
28. Davidoff AM, Humphrey PA, Iglehart JD, Marks JR: Genetic basis for p53
overexpression in human breast cancer. Proc Natl Acad Sci U S A 1991,
88(11):5006–5010.
29. Allred DC, Elledge R, Clark GM, Fuqua SA: The p53 tumor-suppressor gene
in human breast cancer. Cancer Treat Res 1994, 71:63–77.
30. Smith HS: Tumor-suppressor genes in breast cancer progression. Cancer
Treat Res 1994, 71:79–96.
31. Pirollo KF, Bouker KB, Chang EH: Does p53 status influence tumor
response to anticancer therapies? Anticancer Drugs 2000, 11(6):419–432.
32. Pharoah PD, Day NE, Caldas C: Somatic mutations in the p53 gene and
prognosis in breast cancer: a meta-analysis. Br J Cancer 1999, 80(12):1968–1973.
33. Hill KA, Sommer SS: p53 as a mutagen test in breast cancer. Environ Mol
Mutagen 2002, 39(2–3):216–227.
34. Rossner P Jr, Gammon MD, Zhang YJ, Terry MB, Hibshoosh H, Memeo L,
Mansukhani M, Long CM, Garbowski G, Agrawal M, et al: Mutations in p53,
p53 protein overexpression and breast cancer survival. J Cell Mol Med
2009, 13(9B):3847–3857.
35. Rakha EA, El-Sayed ME, Green AR, Lee AH, Robertson JF, Ellis IO: Prognostic
markers in triple-negative breast cancer. Cancer 2007, 109(1):25–32.
Page 10 of 11
36. Lukas J, Niu N, Press MF: p53 mutations and expression in breast
carcinoma in situ. Am J Pathol 2000, 156(1):183–191.
37. Wen WH, Reles A, Runnebaum IB, Sullivan-Halley J, Bernstein L, Jones LA,
Felix JC, Kreienberg R, el-Naggar A, Press MF: p53 mutations and
expression in ovarian cancers: correlation with overall survival. Int J
Gynecol Pathol 1999, 18(1):29–41.
38. Lu Y, Ma H, Malone KE, Norman SA, Sullivan-Halley J, Strom BL, Marchbanks
PA, Spirtas R, Burkman RT, Deapen D, et al: Obesity and survival among
black women and white women 35 to 64 years of age at diagnosis with
invasive breast cancer. J Clin Oncol 2011, 29(25):3358–3365.
39. Marchbanks PA, McDonald JA, Wilson HG, Burnett NM, Daling JR, Bernstein
L, Malone KE, Strom BL, Norman SA, Weiss LK, et al: The NICHD Women's
Contraceptive and Reproductive Experiences Study: methods and
operational results. Ann Epidemiol 2002, 12(4):213–221.
40. Press MF, Greene GL: An immunocytochemical method for demonstrating
estrogen receptor in human uterus using monoclonal antibodies to
human estrophilin. Lab Invest 1984, 50(4):480–486.
41. Press M, Spaulding B, Groshen S, Kaminsky D, Hagerty M, Sherman L,
Christensen K, Edwards DP: Comparison of different antibodies for detection
of progesterone receptor in breast cancer. Steroids 2002, 67(9):799–813.
42. Hammond ME, Hayes DF, Dowsett M, Allred DC, Hagerty KL, Badve S,
Fitzgibbons PL, Francis G, Goldstein NS, Hayes M, et al: American Society of
Clinical Oncology/College of American Pathologists guideline
recommendations for immunohistochemical testing of estrogen and
progesterone receptors in breast cancer (unabridged version). Arch
Pathol Lab Med 2010, 134(7):e48–e72.
43. Press MF, Sauter G, Bernstein L, Villalobos IE, Mirlacher M, Zhou J-Y, Wardeh
R, Li Y-T, Guzman R, Ma Y, et al: Diagnostic evaluation of HER-2 as a
molecular target: an assessment of accuracy and reproducibility of
laboratory testing in large, prospective, randomized clinical trials. Clin
Cancer Res 2005, 11(18):6598–6607.
44. Press MF, Slamon DJ, Flom KJ, Park J, Zhou J-Y, Bernstein L: Evaluation of
HER-2/neu Gene Amplification and Overexpression: Comparison of
Frequently Used Assay Methods in a Molecularly Characterized Cohort
of Breast Cancer Specimens. J Clin Oncol 2002, 20(14):3095–3105.
45. Saffari B, Bernstein L, Hong DC, Sullivan-Halley J, Runnebaum IB, Grill HJ,
Jones LA, El-Naggar A, Press MF: Association of p53 mutations and a
codon 72 single nucleotide polymorphism with lower overall survival
and responsiveness to adjuvant radiotherapy in endometrioid
endometrial carcinomas. Int J Gynecol Cancer 2005, 15(5):952–963.
46. Schmider A, Gee C, Friedmann W, Lukas JJ, Press MF, Lichtenegger W, Reles
A: p21 (WAF1/CIP1) protein expression is associated with prolonged
survival but not with p53 expression in epithelial ovarian carcinoma.
Gynecol Oncol 2000, 77(2):237–242.
47. Cox D, Oakes D: Analysis of survival data. London, England: Chapman & Hall;
1984.
48. Rothman KJ, Greenland S: Modern epidemiology. Philadelphia: LippincottRaven; 1998.
49. Allison P: Survival Analysis Using SAS®: A Practical Guide Second Edition. 2nd
edition. Cary, NC: SAS Institute Inc.; 2010.
50. Li CI, Malone KE, Daling JR: Differences in breast cancer stage, treatment,
and survival by race and ethnicity. Arch Intern Med 2003, 163(1):49–56.
51. Sparano JA, Wang M, Zhao F, Stearns V, Martino S, Ligibel JA, Perez EA,
Saphner T, Wolff AC, Sledge GW Jr, et al: Race and hormone receptorpositive breast cancer outcomes in a randomized chemotherapy trial.
J Natl Cancer Inst 2012, 104(5):406–414.
52. Tammemagi CM, Nerenz D, Neslund-Dudas C, Feldkamp C, Nathanson D:
Comorbidity and survival disparities among black and white patients
with breast cancer. JAMA 2005, 294(14):1765–1772.
53. Bassett MT, Krieger N: Social class and black-white differences in breast
cancer survival. Am J Public Health 1986, 76(12):1400–1403.
54. Gorin SS, Heck JE, Cheng B, Smith SJ: Delays in breast cancer diagnosis and
treatment by racial/ethnic group. Arch Intern Med 2006, 166(20):2244–2252.
55. Bradley CJ, Given CW, Roberts C: Race, socioeconomic status, and breast
cancer treatment and survival. J Natl Cancer Inst 2002, 94(7):490–496.
56. Jatoi I, Becher H, Leake CR: Widening disparity in survival between white
and African-American patients with breast carcinoma treated in the US.
Department of Defense Healthcare system. Cancer 2003, 98(5):894–899.
57. Griggs JJ, Sorbero ME, Stark AT, Heininger SE, Dick AW: Racial disparity in
the dose and dose intensity of breast cancer adjuvant chemotherapy.
Breast Cancer Res Treat 2003, 81(1):21–31.
Ma et al. BMC Cancer 2013, 13:225
/>
Page 11 of 11
58. Hershman D, McBride R, Jacobson JS, Lamerato L, Roberts K, Grann VR,
Neugut AI: Racial disparities in treatment and survival among women
with early-stage breast cancer. J Clin Oncol 2005, 23(27):6639–6646.
59. Ma H, Wang Y, Sullivan-Halley J, Weiss L, Burkman RT, Simon MS, Malone KE,
Strom BL, Ursin G, Marchbanks PA, et al: Breast cancer receptor status: do
results from a centralized pathology laboratory agree with SEER registry
reports? Cancer Epidemiol Biomarkers Prev 2009, 18(8):2214–2220.
doi:10.1186/1471-2407-13-225
Cite this article as: Ma et al.: Mortality risk of black women and white
women with invasive breast cancer by hormone receptors, HER2, and
p53 status. BMC Cancer 2013 13:225.
Submit your next manuscript to BioMed Central
and take full advantage of:
• Convenient online submission
• Thorough peer review
• No space constraints or color figure charges
• Immediate publication on acceptance
• Inclusion in PubMed, CAS, Scopus and Google Scholar
• Research which is freely available for redistribution
Submit your manuscript at
www.biomedcentral.com/submit