Heparan sulfate mediates trastuzumab effect in breast cancer cells
Bạn đang xem bản rút gọn của tài liệu. Xem và tải ngay bản đầy đủ của tài liệu tại đây (1.08 MB, 13 trang )
Suarez et al. BMC Cancer 2013, 13:444
/>
RESEARCH ARTICLE
Open Access
Heparan sulfate mediates trastuzumab effect in
breast cancer cells
Eloah Rabello Suarez1,2*, Edgar Julian Paredes-Gamero1, Auro Del Giglio3, Ivarne Luis dos Santos Tersariol1,
Helena Bonciani Nader1 and Maria Aparecida Silva Pinhal1,2
Abstract
Background: Trastuzumab is an antibody widely used in the treatment of breast cancer cases that test positive for
the human epidermal growth factor receptor 2 (HER2). Many patients, however, become resistant to this antibody,
whose resistance has become a major focus in breast cancer research. But despite this interest, there are still no
reliable markers that can be used to identify resistant patients. A possible role of several extracellular matrix (ECM)
components—heparan sulfate (HS), Syn-1(Syndecan-1) and heparanase (HPSE1)—in light of the influence of ECM
alterations on the action of several compounds on the cells and cancer development, was therefore investigated in
breast cancer cell resistance to trastuzumab.
Methods: The cDNA of the enzyme responsible for cleaving HS chains from proteoglycans, HPSE1, was cloned in
the pEGFP-N1 plasmid and transfected into a breast cancer cell lineage. We evaluated cell viability after
trastuzumab treatment using different breast cancer cell lines. Trastuzumab and HS interaction was investigated by
confocal microscopy and Fluorescence Resonance Energy Transfer (FRET). The profile of sulfated
glycosaminoglycans was also investigated by [35S]-sulfate incorporation. Quantitative RT-PCR and
immunofluorescence were used to evaluate HPSE1, HER2 and Syn-1 mRNA expression. HPSE1 enzymatic activity
was performed using biotinylated heparan sulfate.
Results: Breast cancer cell lines responsive to trastuzumab present higher amounts of HER2, Syn-1 and HS on the
cell surface, but lower levels of secreted HS. Trastuzumab and HS interaction was proven by FRET analysis. The
addition of anti-HS to the cells or heparin to the culture medium induced resistance to trastuzumab in breast
cancer cells previously sensitive to this monoclonal antibody. Breast cancer cells transfected with HPSE1 became
resistant to trastuzumab, showing lower levels of HER2, Syn-1 and HS on the cell surface. In addition, HS shedding
was increased significantly in these resistant cells.
Conclusion: Trastuzumab action is dependent on the availability of heparan sulfate on the surface of breast cancer
cells. Furthermore, our data suggest that high levels of heparan sulfate shed to the medium are able to capture
trastuzumab, blocking the antibody action mediated by HER2. In addition to HER2 levels, heparan sulfate synthesis
and shedding determine breast cancer cell susceptibility to trastuzumab.
Keywords: HER2, Heparanase, Heparan sulfate, Dermatan sulfate, Proteoglycans, Glycoaminoglycans, Breast
cancer resistance
* Correspondence:
1
Department of Biochemistry, Universidade Federal de São Paulo, Rua Três
de Maio, 100, Vila Clementino, 04044-020, São Paulo, SP, Brazil
2
Department of Biochemistry, Faculdade de Medicina do ABC, Avenida
Príncipe de Gales, 821, Vila Príncipe de Gales, 09060-650, Santo André, SP, Brazil
Full list of author information is available at the end of the article
© 2013 Suarez et al.; licensee BioMed Central Ltd. This is an Open Access article distributed under the terms of the Creative
Commons Attribution License ( which permits unrestricted use, distribution, and
reproduction in any medium, provided the original work is properly cited.
Suarez et al. BMC Cancer 2013, 13:444
/>
Background
HER2 is a member of the epidermal growth factor family
of tyrosine kinase receptors. HER2 is amplified in approximately 14% of breast cancers in early stages and 25% of
metastatic breast cancers. HER2 overexpression is associated with lymph node metastasis, short relapse time, poor
survival and decreased response to endocrine and chemotherapy [1,2]. Trastuzumab is a humanized, monoclonal
antibody that specifically blocks HER2 activation and cell
signaling [3]. It is approved for use in patients who
have HER2-positive disease, estrogen receptor/progesterone receptor-negative disease or a high-risk feature
[4]. Patients that present breast cancer in early stage,
when treated with trastuzumab had a 9% increase in
absolute disease free survival at five years, while for patients with metastatic disease the period is extended
only by five to nine months [2]. Nevertheless, 20% of
breast cancer patients in early stages do not respond to
trastuzumab therapy and 70% of the patients with
metastatic disease who received trastuzumab as monotherapy become resistant to this antibody [5] by mechanisms which are still not completely understood.
Trastuzumab resistance has been investigated and some
possible mechanisms have already been described: inactivation of PTEN, since PTEN-deficient tumors have remarkably lower overall response rates to trastuzumab;
extracellular HER2 cleavage with p95HER2 formation,
which is constitutively activated; HER3 overexpression
which implies compensation for HER2 inhibition in
cancer cells mediated by trastuzumab; up-regulation of
autophagic activity, chaperone action, which may increase
HER2 stability or inhibit proteases activity; constitutive activation of crosstalk effectors and finally, the enrollment of
extracellular matrix components, such as integrins, that
can increase signaling pathways for cell proliferation and
cellular survival [6,7]. Despite the emphasis placed on the
study of molecules responsible for breast cancer resistance
to trastuzumab, none of these markers have been proven
to be sufficiently reliable to identify patients resistant to
this antibody.
Some extracellular matrix components are known to
play important roles in tumor development [6]. Heparan
sulfate proteoglycans (HSPGs) are essential to cancer
cell proliferation, escape from immune response, invasion of neighboring tissues, and metastasis to distal sites.
Several tumor types including breast cancers show aberrant modulation of several enzymes related to heparan
sulfate (HS)/ heparin biosynthesis, as well as catabolic enzymes such as sulfatases and heparanase-1 (HPSE1) [8,9].
HPSE1 is an endo-β-D-glucuronidase involved in the
degradation of both cell-surface and ECM HS in normal
and neoplastic tissues. High levels of HPSE1 are associated
with metastatic cancers [10]. HS is a reservoir on which
heparin-binding growth factors aggregate. Indeed, it has
Page 2 of 13
been reported that HS produced by malignant breast
cancer cells and the HS oligossacharides generated by
HPSE1 possess higher fibroblast growth factor 2 (FGF2)
and hepatocyte growth factor binding capacity than HS
from normal breast cells [11,12]. Thus, by breaking down
HS, HPSE1 releases these signaling molecules, which can
promote tumor growth, invasion and angiogenesis [13,14].
Enhanced expression of Syndecan-1 (Syn-1), a cell surface HSPG, may provide a mechanism to restrict FGF
action and modulate cell-matrix interactions. Syn-1
shedding is stimulated by HPSE1 and is engaged in tumor
progression [10].
In light of all the evidence relating extracellular matrix
alterations and cancer development, the present work
aimed to elucidate the possible role of HPSE1, heparan
sulfate (HS) and Syn-1 in breast cancer cell resistance to
trastuzumab. In this work we propose that trastuzumab
action is dependent on heparan sulfate to elicit the antibody response.
Methods
Cell lines and sulfated glycosaminoglycans
This research was conducted using established cell lines.
The study was approved by the Ethics Committee of
the “Universidade Federal de São Paulo” (registration
number 0645/10), Brazil. Human breast cell lines MCF
10A, MCF7 and SKBR3 were acquired from the American
Type Tissue Culture Collection (Manassas, VA). MCF
10A, a non-malignant cell lineage, was maintained in
Dulbecco’s modified Eagle’s medium (DMEM)/F12
(1:1, v/v), supplemented with 5% v/v horse serum (Invitrogen, Carlsbad, CA), human recombinant epidermal
growth factor (Sigma, St. Louis, MO; 20 ng/ml), hydrocortisone (Sigma; 100 ng/ml), bovine insulin (Sigma; 10 μg/
ml), cholera toxin (Sigma; 100 ng/ml), penicillin G (Sigma;
50 U/ml) and streptomycin sulfate (Sigma; 50 μg/ml), at
37°C, 5% CO2. SKBR3 cells, which present the highest
levels of HER2, and MCF7, with intermediate levels of
HER2, (mock-transfected or HPSE1 transfected) were
maintained in DMEM supplemented with 10% fetal calf
serum (FCS), penicillin G (50 U/ml) and streptomycin sulfate (50 μg/ml). Gentamicin (Affymetrix, Inc, Santa Clara,
CA; 400 μg/ml) was added only to pEGFP-N1 HPSE1
transfected cells and G418 only to pcDNA3.1-b (Sigma;
400 μg/ml). Trastuzumab (Herceptin®, Genentech, South
San Francisco, CA) was used in different concentrations
depending on the assay. Bovine pancreas HS was prepared
as described [15,16]. Pig skin dermatan sulfate and shark
cartilage chondroitin sulfate are from Seikagaku Corporation (Tokyo, Japan).
MCF7 cell transfection with HPSE1 cDNA
For MCF7 transfection, a 1.6 kb full-length HPSE1 cDNA,
GenBank accession no. AY948074, was cloned into the
Suarez et al. BMC Cancer 2013, 13:444
/>
EcoRI and KpnI restriction sites of pEGFP-N1 (Clontech,
Palo Alto, CA) and into pcDNA3.1-b (Invitrogen). The
HPSE1 cDNA was obtained from MCF7 and demonstrates 99.8% of similarity when compared to the human
platelet HPSE1 [17]. pEGFP-N1-HPSE1 or pcDNA3.1-bHPSE1 was stably transfected into MCF7 using the liposomal transfection reagent FuGENE® 6 (Roche Diagnostics,
Indianapolis, IN) according to the manufacturer’s instructions. Stable transfected pEGFP-N1-HPSE1 MCF7
cells were selected with gentamicin for 4 weeks (Additional
file 1: Figure S1) followed by green fluorescent protein
sorting using flow cytometry (FACSAria, BD Biosciences,
Franklin Lakes, NJ). pcDNA3.1-b HPSE1 MCF7 cells were
selected using G418, and the use of this clone was restricted to confocal assays to eliminate green fluorescent
protein (GFP) interference. Confocal microscopy confirms
HPSE1 stable transfection using pEGFP-N1 in the MCF7
cells, as shown in Additional file 1: Figure S1.
Cell viability assay
Approximately 5.0 × 10³ mock-transfected MCF7 (MCF7)
and MCF7 containing pEGFP-N1-Heparanase (MCF7HPSE1), 3.0 × 10³ SKBR3 and 1.0 × 10⁴ MCF10A cells
were seeded on 24-well plates. Different concentrations of
trastuzumab were added the following day. After 3 days,
the cells were assayed for 3-(4,5-dimethylthiazol-2-yl)2,5-diphenyltetrazolium bromide (MTT) (Invitrogen) as
described by the manufacturer. The competition assay
between trastuzumab and anti-HS antibody (anti-HS
mouse IgM clone F58-10E4, Seikagaku Corporation,
Tokyo, Japan; dilution 1:50) or heparin 100 μg/mL was
performed and cell viability was determined also by
MTT on the third incubation day. The assays were
performed in triplicate.
Confocal immunofluorescence assay
9.0 × 10³ cells (MCF7, MCF7-HPSE1 and SKBR3) were
seeded on coverslips, in the presence or absence of
trastuzumab (25 μg/ml) for 72 hours. The cells were
fixed with 2% paraformaldehyde/PBS for 30 min, washed
three times with 0.1 M glycine/PBS, and permeabilized
with 0.01% saponine/PBS for 15 min. Trastuzumab and
HS localization were analyzed by incubation with antiHS-FITC (FITC conjugated anti-HS mouse IgM clone
F58-10E4, Seikagaku Corporation, Tokyo, Japan; dilution
1:100) and Alexa Fluor® 594 goat anti-human IgG (1:250)
for 1 hour. HPSE1, HER2 and Syn-1 expression were
detected using goat anti-heparanase-1 C-20 (Santa Cruz;
Santa Cruz, CA, USA), rabbit anti-human erbB2 (Dako
Corporation, Carpinteria, CA, USA; dilution 1:350), or
mouse anti-human Syndecan-1 (CD138; AbD Serotec,
Oxford, UK; dilution 1:100), respectively. The primary
antibodies were developed with secondary antibodies conjugated with Alexa Fluor® 350, 488 or 594 (1:250) for
Page 3 of 13
1 hour. Nuclei were stained with DAPI (4',6-diamidino-2phenylindol; Invitrogen; 20 μg/ml) for 15 min. The coverslips were mounted on microscopy slides with Fluoromont
G (Immunkemi, Stockholm, Sweden). Light microscopy
analysis was performed with a confocal laser scanning
microscope equipped with a Plan-Apochromat × 40 objective under oil immersion (Zeiss, LSM 510 META). The
pinhole device was adjusted to capture fluorescence of
one airy unit. The images were processed using LSM 510
(Zeiss) and Image J (NIH, Bethesda, MD).
Fluorescence resonance energy transfer assay
5.0 × 10³ MCF7 cells were plated on a 96-well multiwell
plate, fixed with 2% formaldehyde in PBS for 30 minutes,
washed three times with 0.1 M glycine in PBS, blocked
with 1% BSA for 2 hours and incubated with anti-HS
1:100 (Seikagaku Corporation, Japan) and Trastuzumab
(25 μg/mL) overnight (ON). The conjugated secondary
antibodies Alexa Fluor 546 or 594 (Invitrogen, Carlsbad,
CA) were used against anti-HS and trastuzumab, respectively. The excitation spectrum of the cells stained with
anti-HS-Alexa Fluor 546 and trastuzumab-Alexa Fluor
594 alone was obtained by excitation of the wells at
543 nm and the emission fluorescence was detected from
550 nm to 680 nm, in intervals of 10 nm wavelengths
steps, in the fluorometer (FlexStation3, Molecular Devices,
Silicon Valley, CA). The analysis of the interaction between HS and Trastuzumab was made by FRET. MCF7
cells doubly stained with anti-HS-Alexa Fluor 546 and
trastuzumab-Alexa Fluor 594 were excited at 543 nm.
This wavelength was able to significantly excite only the
anti-HS-Alexa Fluor 546, which emits their fluorescence
in the range of 594 nm. Therefore, anti-HS-Alexa Fluor
546 is able to excite trastuzumab-Alexa Fluor 594 if both
molecules are at a distance of under 5 nm. FRET can be
evaluated by calculating the FRET ratio of the fluorescence intensity found in the wavelength of maximum
emission of trastuzumab-Alexa 594 (617 nm) over the
fluorescence intensity value obtained in the maximum
wavelength emission of the Anti-HS-Alexa Fluor 546
(580 nm), as previously described by [18].
Sulfated glycosaminoglycans analysis
Sixty percent confluent cells, grown on 35 mm culture
plates were incubated for 2 days with specific cell culture
medium containing 10% FCS in the presence or absence
of trastuzumab (25 μg/ml). Afterwards, the medium was
removed and replaced with new medium without FCS,
containing 150 μCi/ml of carrier free [35S]-inorganic sulfate (IPEN, São Paulo, SP, Brazil) in the presence or absence of trastuzumab. After 18 hours the culture medium
was removed and the cells washed twice with serum-free
medium and detached using 25 mM Tris–HCl, pH 7.4,
containing 3.5 M urea. Cell protein was estimated by the
Suarez et al. BMC Cancer 2013, 13:444
/>
Page 4 of 13
Coomassie blue method [19]. The analysis of sulfated glycosaminoglycans (GAG) was performed essentially as described by [20,21]. Protein free GAG chains were prepared
from the cellular fraction (cells plus ECM) and culture
medium by incubation with maxatase (Biocon Industrial,
Rio de Janeiro, RJ, Brazil; 4 mg/ml) overnight, at 60°C.
Cells and medium aliquots were submitted to agarose gel
electrophoresis in 0.05 M 1,3-diamino propane acetate
buffer, pH 9.0, as described by [22]. [35S]-sulfate labeled
GAGs were exposed to Kodak X-ray film (SB-5), for 2–
3 days to identify and quantify each compound. The radioactive bands were scraped from the gel and counted in a
liquid scintillation counter (LS 6000 IC; Beckman Coulter
Inc., Palo Alto, CA) using UltimaGold™ (PerkinElmer Life
And Analytical Sciences, Inc.; Wellesley, MA, USA). The
identity of the different GAGs was confirmed by degradation with different lyases: chondroitinases AC and ABC
(Seikagaku Kogyo Co., Tokyo, Japan) and heparitinases I
and II from F. heparinum [15,16,23]. For this assay, the
GAGs were precipitated with 3 volumes of absolute ethanol prior to the degradation. The assays were performed
in triplicate.
AAGAGA3’ and for GAPDH 5’TCGACAGTCAGCC
GCATCTTCTTT3’ and 5’GCCCAATACGACCAAATC
CGTTGA3’.
Quantitative reverse transcriptase polymerase chain
reaction (qRT-PCR)
Statistical analysis
Syn-1, HER2 and HPSE1 mRNA expression were evaluated using MCF10A, SKBR3, MCF7 and MCF7-HPSE1
cells treated or not treated with trastuzumab (25 μg/ml)
for three days. Dermatan sulfate glucuronosil-C5-epimerase was analyzed in non-treated MCF7 and MCF-HPSE1
cells. Cells were harvested and total-RNA was extracted
using TRIzol reagent (Invitrogen) following the manufacturer's protocol. cDNA was synthesized using ImPromII™ Reverse Transcription System (Promega, Madison,
Wisconsin) and oligo (dT)12–18 (Invitrogen), following the
manufacturer's protocol. Quantitative PCR analysis was
performed using SYBR Green mix (Applied Biosystems,
Life Technologies Corporation, Carlsbad, CA) and
Qiagen Rotor Gene Q 6000 Detection System (Qiagen,
Düsseldorf, Germany). Measurements were normalized
against GAPDH and RPL13A geometric mean, using
2-ΔCt. The following primers were used: HER2: 5’TGC
TGGACATTGACGAGACAGAGT3’ and 5’AGCTCCC
ACACAGTCACACCATAA3’, HPSE1: 5'TGGCAAGAA
GGTCTGGTTAGGAGA3' and 5'GCAAAGGTGTCGG
ATAGCAAGGG3', and Syn-1: 5’AGGGCTCCTGCACT
TACTTGCTTA3’ and 5’ATGTGCAGTCATACACTCC
AGGCA3’ and for dermatan sulfate glucuronosil-C5-epi
merase: 5’GATCCTCGAGATGAGGACTCACACACG
GGG3’ and 5’GATCACCGGTACACTGTGATTGGGA
ACAAGA3’. GAPDH and RPL13A (60S ribosomal protein L13A) genes were used as internal controls. Primers
used to amplify RPL13a were: 5’TTGAGGACCTCTGT
GTATTTGTCAA3’ and 5’CCTGGAGGAGAAGAGGA
Degradation of biotinylated HS by HPSE1
HPSE1 action was measured by an ELISA-like method
using HS biotinylated [24,25]. MCF7, MCF7-HPSE1 or
SKBR3 cells (1 × 10⁵ per well) were cultured in the absence or presence of trastuzumab (25 μg/ml) for 3 days in
60-mm plates. The cells were scraped with 500 μL of sodium acetate 25 mM, pH 5.0, containing protease inhibitors (Invitrogen) and 50 μL of cell extract was incubated
with the pre-coated plate, revealed with europium-labeled
streptavidin, washed and submitted to 200 μL of enhancement solution (PerkinElmer Life Sciences-Wallac
Oy, Turku, Finland). Free europium was measured and
the data analyzed in the MultiCalc software (PerkinElmer
Life Sciences-Wallac Oy). The product obtained by HPSE1
was expressed by the ratio of degraded HS and total
protein from the cellular fraction (μg of HS/μg of total
protein).
Statistical analysis was performed using the SPSS® 13 program (SPSS® Inc; Illinois, USA). The variables were tested
using the Kolmogorov-Smirnov test. The Mann–Whitney
test was used to determine the relation between nonparametric variables. A value of P < 0.05 was considered
statistically significant.
Results and discussion
Breast cancer cell viability in the presence of trastuzumab
We initially examined cell viability using different concentrations of trastuzumab in MCF10A, SKBR3, MCF7
and MCF-HPSE1 cells. Trastuzumab had no effect on
the non-neoplastic MCF10A cells, for all tested doses
(Figure 1). Figure 1 shows a decrease of cell viability of
around 50% in MCF7 and SKBR3 cells treated with
25 μg/ml of the antibody. SKBR3 is also sensitive to
trastuzumab at lower doses. The concentration of trastuzumab that elicits the highest effect in cell viability assays was very similar to the doses used in clinical therapy
with trastuzumab (2 mg/kg, to a volume of blood around
0.08 L/kg). Many papers in the literature have shown that
at lower doses (up to 3 μg/mL) trastuzumab is not able to
decrease the cell viability of MCF7 cells [26-28] probably
due to the fact that this cell lineage presents an intermediate HER2 expression. However, an invasion assay using
MCF7 cells treated with approximately 8 μg/mL of
trastuzumab showed that this antibody was able to inhibit
the invasion of these cells in matrigel [29]. Our results
showed that trastuzumab in doses higher than 15 μg/mL
was able to decrease MCF7 cell viability.
Suarez et al. BMC Cancer 2013, 13:444
/>
Page 5 of 13
When MCF7 cells were transfected with HPSE1 cDNA
and treated with trastuzumab 25 μg/mL, this antibody lost
the ability to decrease the viability of these cells (Figure 1).
Co-localization between HS, trastuzumab and HER2
Figure 1 Cell viability of breast cancer cell lineages treated
with trastuzumab. MCF 10A, MCF7, MCF7-HPSE1 and SKBR3 cells
were treated with trastuzumab in different doses for 3 days and
assayed using MTT, as described in methods. Each point indicates
the mean ± standard deviation (SD) of triplicate assays. *P < 0.05
SKBR3 cells, **P < 0.05 MCF7 cells.
HER2 overexpression by itself is not able to define the
response to trastuzumab, since it has already been shown
that some cell lineages that overexpress this receptor remain resistant to this antibody [26,30]. These results led
us to investigate whether possible differences in breast
cancer cell lineages, besides HER2 overexpresssion, could
explain trastuzumab resistance.
Confocal immunofluorescence data demonstrates colocalization between cell surface HS, trastuzumab and
HER2 (Figure 2). Table 1 shows the digital quantification
of the confocal immunofluorescence analysis, with the
mean of intensity and co-localization percentage. The
highest co-localization between HS and trastuzumab can
be observed in SKBR3 cells (99.5%), followed by MCF7
and MCF7-HPSE1 cells, respectively, 76.2% and 54.7%
(Table 1). The same results were obtained by HS and
HER2, where SKBR3 and MCF7 presented higher colocalization, 34.8% and 28.1%, respectively, compared to
MCF7-HPSE1 (17.2%), as shown in Table 1. As expected,
trastuzumab and HER2 were more intensively colocalized in cells sensitive to trastuzumab treatment
(SKBR3 and MCF7), compared to the result obtained for
MCF7-HPSE1 (Table 1).
Interaction between trastuzumab and HS modulates the
trastuzumab effect
FRET assay confirms interaction between HS and trastuzumab (Figure 3A). A 60% increase in FRET ratio was
observed when HS and trastuzumab were analyzed in
MCF-7 cells (Figure 3B).
Figure 2 Co-localization of heparan sulfate, trastuzumab and HER2 in SKBR3, MCF7 and MCF7 HPSE1 cells by confocal
immunofluorescence. 9.0x10³ cells were seeded on coverslips and treated with 25 μg/ml of trastuzumab for 72 hours. The cells were fixed with
paraformaldehyde, washed with glycine and permeabilized with saponine. The antibodies anti-HS-FITC (represented in green), trastuzumab
(stained with Alexa Fluor® 594 – represented in red), and anti-HER2 (stained with Alexa Fluor® 350 – represented in blue) were incubated with the
cells as described in methods. Nuclei were stained with DAPI. Microscopy analyses were performed with a confocal laser scanning microscope
equipped with a Plan-Apochromat × 40 objective under oil immersion (Zeiss, LSM 510 META). The images were processed using LSM 510 (Zeiss)
and Image J (NIH, Bethesda, MD).
Suarez et al. BMC Cancer 2013, 13:444
/>
Page 6 of 13
Table 1 Mean of intensity and percentage of co-localization among HS, Trastuzumab and HER2 by confocal microscopy
Mean of intensity (O.D.)
MCF7
Co-localization (%)
HS
Trastuzumab
HER2
Trastuzumab and HS
HS and HER2
Trastuzumab and HER2
92.3
81.8
102.2
76.2
28.1
29.2
MCF7-HPSE1
57.9
50.6
83.4
54.7
17.2
16.2
SKBR3
168.6
150.2
179.9
99.5
34.8
35.2
A cell viability assay using an anti-HS antibody was
performed to confirm whether HS from the cell surface
could modulate trastuzumab binding to HER2 (Figure 3C).
Anti-HS clearly blocks the trastuzumab effect in MCF7
and SKBR3 cells (Figure 3C). Trastuzumab decreased
cell viability by around 40% and this effect was completely reverted by anti-HS (Figure 3C), showing the
importance of HS present on the cell surface to elicit
the trastuzumab effect.
Heparin, a well-known anticoagulant molecule, is a
GAG with a structure very similar to HS. In Figure 3D,
heparin was added to the medium of breast cancer cells in
order to evaluate the effect of HS/heparin shedding in
trastuzumab activity over breast cancer cells. When heparin is co-administered with trastuzumab to breast cancer
cells in cell viability assays, it was able to reverse the effect
of the monoclonal antibody upon these cells. This result
confirms the importance of HS on the cell surface to
Figure 3 The importance of cell surface HS to trastuzumab action. (A), Emission spectra of MCF7 cells incubated with anti-HS-Alexa Fluor
546 and/or trastuzumab-Alexa Fluor 594 obtained at 543 nm excitation, and fluorescence emission detected from 550 nm to 680 nm, using
10 nm steps in a fluorometer. (B), The values represent the analysis of FRET ratios [ratio of intensity of fluorescence found in the wavelength of
maximum emission of trastuzumab-Alexa 594 (617 nm) and the fluorescence intensity obtained in the maximum wavelength emission of the
Anti-HS-Alexa Fluor 546 (580 nm)]. (C) Reversion of the trastuzumab effect in MCF7 and SKBR3 cell viability assay by an anti-HS antibody. 3.0x10³
SKBR3 and 5.0x10³ MCF7 cells were treated with trastuzumab (25 μg/mL) and anti-HS antibody 1:100 and cell viability was determined also by
MTT on the third incubation day. Each point indicates the mean ± SD of triplicate assays. *P < 0.05, compared to respective control cells. (D),
Heparin added to the medium revert the decrease in cell viability induced by trastuzumab in sensitive breast cancer cells. 3.0x10³ SKBR3 and
5.0x10³ MCF7 and MCF7-HPSE1cells were treated with trastuzumab (25 μg/mL) and/or heparin (100 μg/mL) and cell viability was determined
after three days of incubation. Each point indicates the mean ± SD of triplicate assays. *P < 0.05, compared to respective control cells.
Suarez et al. BMC Cancer 2013, 13:444
/>
modulate the trastuzumab effect and also demonstrates
the negative impact of HS shedding in the breast cancer
cells sensitive to trastuzumab.
It is already known that heparin increased the survival
of patients with cancer in randomized trials that compared low molecular weight heparin to unfractionated
heparin for the treatment of deep vein thrombosis [31].
Moreover, heparin is able to inhibit the proliferation of
some cell types like vascular smooth muscle cells, mesangial cells, fibroblasts and epithelial cells [32,33]. The
epithelial lineage used in our experiments, SKBR3, showed
sensitivity to heparin, and was able to decrease the viability of these cells by 50% (Figure 3D). Heparin interferes
with the activities of growth factors such as FGF-2 and
VEGF and blocks selectin-mediated intercellular interactions, inhibiting angiogenesis and tumor development and
progression [34,35]. However, heparin can only be administered at relatively low concentrations because of its
strong anticoagulant effect [34].
Reversal of the trastuzumab effect on cell viability using
an anti-HS antibody that blocks the cell surface HS, or the
heparin addition to the medium, mimicking the HS shedding, associated with the interaction between HS and
trastuzumab determined by FRET allowed us to prove that
trastuzumab depends on cell surface HS to inhibit HER2.
As observed, the addition of heparin to the medium inhibits the trastuzumab effect, probably by competing with
HS, avoiding the ternary complex formation between
trastuzumab, HS and HER2. The crystallography study of
HER2 in complex with trastuzumab has shown the presence of a sulfate group and two N-acetylglucosamine residues in the domain I of HER2 [36]. These molecules are
important constituents of the heparan sulfate structure.
These data, associated with our results, highlight the importance of the HS domains present in HER2 to determine trastuzumab interaction with this receptor and the
consequent blocking of the cellular pathways that are
over-activated in HER2 positive breast cancer cells.
Profile of sulfated glycosaminoglycans in breast
cancer cells
Figure 4A shows that SKBR3 cells present the highest
levels of HS in the cellular fraction (Figure 4B). As shown
in Figure 4C, the HS from the cellular fraction in stable
transfected MCF7-HPSE1 cells decreased around 14 to
170 fold compared to the MCF7 and SKBR3 cells, respectively. However, similar amounts of HS were secreted to
the medium in all three cell lines. It is interesting to note
that the value obtained by the ratio of secreted HS/cellular
fraction HS was lower in SKBR3, proportional in MCF7
and higher in MCF7-HPSE1. The lower levels of HS secreted in SKBR3 (Figure 4A) is noteworthy, since these
cells show high levels of HPSE1 expression and action
(Figure 5, Additional file 2: Figure S2 and Figure 6).
Page 7 of 13
Additional file 3: Figure S3 suggests that trastuzumab
might be able to induce a retroactive effect in SKBR3 and
MCF7 cells, enhancing HS expression in the cellular fraction (Additional file 3: Figure S3A and B). Nevertheless,
MCF7-HPSE1 cells treated with trastuzumab showed a
decrease in the HS present in the cellular fraction
(Additional file 3: Figure S3C). Taken together, the results suggest that HS might modulate trastuzumab
binding to HER2, due to increased HS in the cellular
fraction of breast cancer cells responsive to trastuzumab
in the cell viability assay.
The profile of galactosaminoglycans was determined
after degradation with chondroitinases AC and ABC (data
not shown). We observed that CS is the galactosaminoglycan present on the cell surface and secreted to the
medium of MCF7 cells whilst stable transfected MCF7HPSE1 cells and SKBR3 expressed DS. Interestingly, DS
glucuronosil C5 epimerase, the key enzyme responsible
for transforming β−D-glucuronic acid into α–L-iduronic
acid [37] is 30-fold overexpressed in MCF7-HPSE1 compared to MCF7, promoting DS synthesis (Figure 4D).
SKBR3 (Figure 4A) presented a 3-fold higher amount of
galactosaminoglycans than MCF7 (Figure 4B) in the cellular fraction, but similar amounts of this GAG secreted to
the medium. The transfection of MCF7 with pEGFPHPSE1 was able to promote 3- and 5-fold decreases in the
amount of galactosaminoglycan expression in the cellular
fraction and medium, respectively (Figure 4C). Curiously,
HPSE1 transfection reduces galactosaminoglycans synthesis and changes the profile from CS to dermatan sulfate,
related to the increase in the glucuronosil C5 epimerase
expression (Figure 4D). Growing evidence suggests that
DS plays a crucial role in various biological events such as
growth factor signaling, cell division and tumor development [38-41].
Comparative mRNA analysis of HPSE1, HER2 and Syn-1 in
breast cancer cell lines
We also investigated mRNA expression of HPSE1, HER2
and Syn-1 in breast cancer cell lines using qRT-PCR.
Figure 5 shows that the mRNA expression of HPSE1 is
3,000-fold higher in SKBR3 compared to MCF10A or
MCF7 cells, which present similar HPSE1 mRNA expressions. MCF7 transfected with HPSE1 cDNA showed a
77-fold increase in HPSE1 expression. Since both MCF7
and MCF10A have similar HPSE1 mRNA expression,
as shown in Figure 5, and only MCF7 is sensitive to
trastuzumab at lower doses, we can surmise that HPSE1
by itself is not decisive in determining breast cancer cell
response to trastuzumab. We can also observe in Figure 5
that MCF10A has the lowest expression of HER2 mRNA
levels. The HER2 mRNA expression of MCF7 cells is 23
times that of the MCF10A lineage. It is important to point
out that despite the low level of HER2 mRNA in MCF7,
Suarez et al. BMC Cancer 2013, 13:444
/>
Page 8 of 13
Figure 4 Glycosaminoglycans profile of SKBR3, MCF7 and MCF7-HPSE1 cells. Sixty percent confluent cells were incubated for 18 hours in
serum-free medium containing 150 mCi/ml [35S]-sulphate. Protein-free GAG chains were prepared from the cells and culture medium by
incubation with maxatase. Aliquots from the medium and cells were submitted to agarose gel electrophoresis (0.05 M diaminopropane acetate
buffer, pH 9.0) and the sulphated GAG identified and quantified as described in methods. (A), Heparan sulfate (HS) and dermatan sulfate (DS)
from SKBR3; (B), HS and chondroitin sulfate (CS) from MCF7; (C), HS and DS from MCF7-HPSE1. *P < 0.05, compared to the respective fraction of
MCF7 cells, **P < 0.05, medium versus cellular fraction of the same cell lineage. (D), mRNA expression of DS glucuronosil C5 epimerase in MCF7
versus MCF7-HPSE1 cells by qRT-PCR. The RNA was extracted using TRIzol reagent, converted into cDNA by RT-PCR and submitted to qRT-PCR
using specific primers for glucuronosil C5 epimerase. The values were corrected by RPL13a (ribosomal protein) and GAPDH expressions. Each bar
indicates the mean ± SD of triplicate assays. *P < 0.001.
Suarez et al. BMC Cancer 2013, 13:444
/>
Figure 5 HPSE1, HER2 and Syndecan-1 mRNA expression in
MCF10A, SKBR3, MCF7 and MCF7-HPSE1. The RNA was extracted
using TRIzol reagent, converted into cDNA by RT-PCR and submitted
to qRT-PCR using specific primers for HER2, Syn-1 and HPSE1, as
described in methods. The values were corrected by RPL13a
(ribosomal protein) and GAPDH expressions. Each bar indicates the
mean ± SD of triplicate assays. *P < 0.05 compared to MCF10A and
**P < 0.001 compared to MCF7.
Page 9 of 13
Figure 6 Degradation of biotinylated HS by heparanase in
SKBR3, MCF7 and MCF7-HPSE1 in the presence or absence of
trastuzumab. HPSE1 action was measured by an ELISA-like method
using HS biotinylated. Briefly, the cells were cultured in the absence
or presence of trastuzumab (25 μg/ml) for 3 days on 60 mm plates.
The cells were scraped with sodium acetate 25 mM, pH 5.0,
containing protease inhibitors. The cell extract was incubated with
the biotinylated HS pre-coated on the plate, revealed with
europium-labeled streptavidin, washed and submitted to the
enhancement solution. Free europium was measured and the data
analyzed using MultiCalc software (PerkinElmer Life Sciences-Wallac
Oy). *P < 0.001, compared to the non-degraded biotinylated HS
(Control), **P < 0.05, treated versus non-treated cells, ***P < 0.05
MCF7-HPSE1 versus MCF7. Each bar indicates the mean ± SD. The
assays were performed in triplicate.
this cell is not completely negative for HER2. Furthermore, the HER2 mRNA expression of MCF7 was 118 times
lower than SKBR3, which corresponds to an established
breast cancer cell lineage that presents the highest
HER2 levels naturally expressed [42]. Once HPSE1 cDNA
was transfected into MCF7 cells, HER2 expression decreased 14 fold, which could contribute to the resistance
of MCF7-HPSE1 cells to trastuzumab.
It can be observed that the MCF7 cell line and MCF10A cells have similar levels of Syn-1 mRNA expression,
whilst SKBR3 cells present 5-fold higher Syn-1 expression
(Figure 5). When MCF7 cells were transfected with
HPSE1, Syn-1 expression decreased 2-fold (Figure 5). The
amount of mRNA expression of Syn-1 core protein does
not appear to be essential for the response of breast cancer cells to trastuzumab, since MCF7 has similar levels of
Syn-1 as the non-responsive MCF10A cells.
Possibly, the effect of trastuzumab in the inhibition of
HPSE1 action in MCF7-HPSE1 cells is achieved even with
lower amounts of the complex formed between trastuzumab and HER2. However, the trastuzumab effect
upon cell viability probably needs a higher number of
complex formations between trastuzumab and HER2 to
trigger the molecular signaling that induces cellular apoptosis/necrosis.
HPSE1 expression and degradation of biotinylated-HS
Trastuzumab affects HPSE1, HER2 and Syn-1 expression
SKBR3 cells and MCF-7-HPSE1 demonstrated the highest
HPSE1 expression and enzymatic action, being able to degrade around 40 μg of HS compared to 20 μg observed in
MCF7 cells (Figure 6 and Additional file 2: Figure S2).
Furthermore, trastuzumab treatment inhibited HPSE1 action in the breast cancer cells, decreasing HS degradation
around 15%-20% in SKBR3 and MCF7 cells and 40% in
MCF-7-HPSE1 cells. It has already been shown that
MCF7-HPSE1 does not decrease cell viability in the presence of trastuzumab; however, these cells are able to respond to this antibody when other aspects were evaluated.
Confocal analysis showed in Figure 7 corroborates with
qRT-PCR results previously presented, demonstrating
that MCF7 cells have higher amounts of HER2 and Syn-1
proteins on the cell surface (Figure 7A), while stable
transfection with HPSE1 cDNA decreases substantially
the expression of these molecules (Figure 7C). A decrease
in HER2 expression observed in MCF7-HPSE1 before
trastuzumab treatment could be related to the resistance
against this antibody.
Both SKBR3 and MCF7-HPSE1 overexpress HPSE1.
Despite the higher expression and activity of HPSE1,
Suarez et al. BMC Cancer 2013, 13:444
/>
Page 10 of 13
Figure 7 HER2 and Syndecan-1 expression in MCF7 and MCF7-HPSE1 cells before and after trastuzumab treatment. These cells were
treated for three days with 25 μg/mL of trastuzumab, fixed and prepared for confocal microscopy using the specific antibodies anti-HER2 stained
with the secondary antibody Alexa Fluor® 488 (green) or anti-Syn-1 stained with the secondary antibody Alexa Fluor® 594 (red), as described in
methods. (A) MCF7, (B) MCF7 treated with trastuzumab (25 μg/mL), (C) MCF7-HPSE1, (D) MCF7-HPSE1 treated with trastuzumab (25 μg/mL).
SKBR3 cells compensate HPSE1 overexpression, increasing HS synthesis and Syn-1 mRNA expression, which
seems to enhance the susceptibility of this cell line to the
effect of trastuzumab on cell viability. However, the MCF7HPSE1 cell line is resistant to trastuzumab in cell viability
assays. Therefore, the compensatory effect observed in the
SKBR3 cell is absent in stable transfected MCF7-HPSE1,
due to the fact this cell line presents low amounts of Syn1 and HS on the cell surface.
It has been shown that over-expression of HPSE1 can activate metalloproteases related to Syn-1 shedding [43].
The shedding of syndecan from the cell surface disables
cell adhesion, and soluble effector molecules such as
growth factors and cytokines bind to HS chains, as they
are no longer sequestered on the cell surface. Shedding
can impact cell adhesion and growth factor concentration and could act as a stronger promoter of tumor
growth in vivo [43,44], making MCF7-HPSE1 potentially more aggressive.
A decrease in HER2 and Syn-1 was observed when
MCF7 cells were treated with trastuzumab (25 μg/mL)
(Figure 7B). Probably the endocytosis induced by trastuzumab can explain decreased HER2 and Syn-1 expression. However, an opposite effect was verified in breast
cancer cells resistant to trastuzumab (MCF7-HPSE1), increasing HER2 and Syn-1 protein expression (Figure 7D).
It is interesting to note that after HER2 up-regulation by
trastuzumab, by an unknown mechanism, MCF7-HPSE1
cells remained resistant to this monoclonal antibody.
Therefore, these data indicate that MCF7-HPSE1 trastuzumab resistance in cell viability assays is not dependent
exclusively on HER2 expression.
The effect of trastuzumab was further investigated by
mRNA levels of HPSE1, Syn-1 and HER2. The relative
values of HPSE1, Syn-1 and HER2 were obtained by the
ratio of mRNA expression after trastuzumab treatment /
mRNA expression of non-treated cells (Figure 8). MCF7
cells presented a decrease in mRNA ratio for HPSE1, Syn1 and HER2 after trastuzumab treatment, indicating
that the tumoral phenotype is being reverted when
these cells are treated with this antibody. On the other
hand MCF7-HPSE1 cells treated with trastuzumab increased the amounts of HPSE1, Syn-1 and HER2 after
trastuzumab treatment, which could render MCF7-HPSE1
even more malignant (Figure 8). Despite HER2 upmodulation after trastuzumab treatment, MCF7-HPSE1
Figure 8 Ratio of HER2, HPSE1 and Syn-1 mRNA expression of
trastuzumab treated per non-treated breast cancer cells MCF7,
MCF7-HPSE1 and SKBR3. These cells were treated for three days
with 25 μg/mL of trastuzumab. The RNA was extracted using TRIzol
reagent, converted into cDNA by RT-PCR and submitted to qRT-PCR
using specific primers for HER2, Syn-1 and HPSE1. The mRNA
expression of constitutive genes GAPDH and RPL13A was used to
correct the mRNA expression of HER2, Syn-1 and HPSE1, as
described in methods. Each bar indicates the mean ± SD of triplicate
assays. *P < 0.05 versus non-treated MCF7 cells and ** P < 0.05 versus
non-treated MCF7-HPSE1.
Suarez et al. BMC Cancer 2013, 13:444
/>
Page 11 of 13
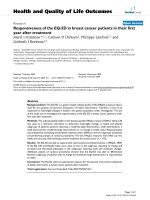
Figure 9 Molecular profile of breast cancer cells defines trastuzumab efficiency. (A) SKBR3 cells have the highest levels of HER2, Syn-1,
HPSE1 and HS on the cell surface and low levels of HS shed to the medium. This cell is the most sensitive to trastuzumab in cell viability assays.
Since HS and trastuzumab interact, as proved by FRET, HS enhances the amounts of trastuzumab available on the cell surface to interact with
HER2, facilitating the blocking of this receptor by the antibody. (B), MCF7 cells present intermediate levels of HER2 and Syn-1, low levels of HPSE1
expression and similar levels of HS on the cell surface and shed to the medium, decreasing their viability in the presence of trastuzumab with
higher doses. (C), MCF7 cells transfected with HPSE1 cDNA present the lowest levels of HER2 and Syn-1 and high levels of HPSE1. The cell surface
HS decreases and the shedding of this molecule increases significantly in these cells. High levels of HPSE1 leads to HS shedding that could
capture trastuzumab in the medium, due to the affinity between HS and trastuzumab previously shown. Trastuzumab captured in the media
prevents HER2 blocking, contributing to cellular resistance to trastuzumab.
remains resistant. If HER2 were the main determinant for
trastuzumab effect, MCF7-HPSE1 would become responsive after the treatment.
Despite the presence of HER2, the results obtained so
far indicate other differences between trastuzumab sensitive cells (SKBR3 and MCF7), such as higher amounts of
cell surface HS and expression of Syn-1, compared to resistant cells (MCF7-HPSE1).
Trastuzumab sensitive cells (SKBR3 and MCF7) synthesize a very significant amount of HS molecules that are
maintained on the cell surface compared to the trastuzumab resistant cell line (MCF7-HPSE1), even with
higher HPSE1 expression.
Our results suggest that the response of tumor cells to
trastuzumab is not only HER2 dependent, but the expression of Syn-1 and particularly the HS present on the cell
surface seem to be determinant in trastuzumab action.
Conclusions
To our knowledge, these are the first results clearly demonstrating an association between a breast cancer cell response to trastuzumab and HER2, HPSE1, Syn-1, HS and
galactosaminoglycan synthesis. The results elucidate the
importance of ECM components in understanding breast
tumor cell resistance to trastuzumab. The hypotheses of
the present work are summarized in Figure 9. The amount
of HS present on the cell surface has potential as a predictive marker to determine breast cancer patient eligibility for trastuzumab treatment, despite HER2 expression.
These new insights could also be useful to develop strategies for overcoming drug resistance in HER2 positive
cancers.
Additional files
Additional file 1: Figure S1. Confocal Immunofluorescence of HPSE1
transfected MCF7 cells (MCF7-HPSE1), using pEGFP-N1 containing HPSE1
cDNA (pEGFP-N1-HPSE1). A 1.6 kb full HPSE1 cDNA, GenBank accession
no. AY948074, was cloned into EcoRI and KpnI restriction sites of pEGFPN1 (Clontech). pEGFP-N1-HPSE1 was stably transfected into MCF7 using a
liposomal transfection reagent FuGENE® 6 (Roche Diagnostics) according
to the manufacturer’s instructions. Stable transfected pEGFP-N1-HPSE1
MCF7 cells were selected with gentamicin for 4 weeks followed by green
fluorescent protein sorting using flow cytometry (FACSAria, BD
Biosciences, Franklin Lakes, NJ). (A) Nuclear staining with DAPI (blue); (B)
recombinant HPSE1 (green), (C) overlapping images. Images captured at
63x magnification under oil immersion (Zeiss, LSM 510 META).
Additional file 2: Figure S2. HPSE1 expression by
immunofluorescence. HPSE1 expression was detected using goat antiheparanase-1 C-20 (Santa Cruz). The primary antibody was developed
with an anti-goat IgG secondary antibody conjugated with Alexa Fluor®
488 (1:250) for 1 hour. Nuclei were stained with DAPI. (A), Confocal
immunofluorescence for HPSE1 in SKBR3, MCF7 and MCF7-HPSE1 cells.
Images captured at 40x magnification under oil immersion (Zeiss, LSM
510 META). (B), HPSE1 Intensity of Expression determined by slide
densitometry using LSM 510 Software (Zeiss).
Additional file 3: Figure S3. Effect of trastuzumab in GAG synthesis
and shedding of SKBR3, MCF7 and MCF7-HPSE1 cells. Sixty percent of
confluent cells were treated with trastuzumab (25 μg/mL) for 72 hours. In
the last 18 hours, cells were incubated with serum free medium
containing 150 mCi/ml [35S]-sulphate. Protein-free GAG chains were
prepared from the cells and culture medium by incubation with
maxatase, as described in methods. Aliquots from the medium and cells
were submitted to agarose gel electrophoresis (0.05 M diaminopropane
Suarez et al. BMC Cancer 2013, 13:444
/>
acetate buffer, pH 9.0) and the sulphated GAG identified and quantified.
(A), Heparan sulfate (HS) and dermatan sulfate (DS) from SKBR3; (B), HS
and chondroitin sulfate (CS) from MCF7; (C), HS and DS from MCF7HPSE1. Each bar indicates the mean ± SD of triplicate assays. *P < 0.05,
compared to the respective fraction of non-treated cells.
Competing interests
The authors declare that they have no competing interests.
Authors’ contributions
ERS participated in the conception and experimental design, performed cell
viability assays, heparanase activity, glycosaminoglycans analysis, qRT-PCR,
immunofluorescence and FRET assays, interpretation of data and drafted the
manuscript. EJPG contributed to the design, analysis and interpretation of
immunofluorescence assays. ADG contributed to the interpretation of data.
HBN and ILST were involved in drafting the manuscript and revising it
critically for important intellectual content. MAS was involved in the
conception of the assays, interpretation of data, drafting and revising the
manuscript and approval of the final version to be published. All authors
read and approved the final manuscript.
Acknowledgements
We thank FAPESP, CAPES and CNPq for their financial support.
Author details
1
Department of Biochemistry, Universidade Federal de São Paulo, Rua Três
de Maio, 100, Vila Clementino, 04044-020, São Paulo, SP, Brazil. 2Department
of Biochemistry, Faculdade de Medicina do ABC, Avenida Príncipe de Gales,
821, Vila Príncipe de Gales, 09060-650, Santo André, SP, Brazil. 3Department of
Oncology, Faculdade de Medicina do ABC, Avenida Príncipe de Gales, 821, Vila
Príncipe de Gales, 09060-650, Santo André, SP, Brazil.
Received: 23 July 2013 Accepted: 26 September 2013
Published: 1 October 2013
References
1. Slamon DJ, Godolphin W, Jones LA, Holt JA, Wong SG, Keith DE, Levin WJ,
Stuart SG, Udove J, Ullrich A, et al: Studies of the HER-2/neu proto-oncogene
in human breast and ovarian cancer. Science 1989, 244(4905):707–712.
2. Wilking U, Jonsson B, Wilking N, Bergh J: Trastuzumab use in breast cancer
patients in the six Health Care Regions in Sweden. Acta Oncol 2010,
49(6):844–850.
3. Carter P, Presta L, Gorman CM, Ridgway JB, Henner D, Wong WL, Rowland AM,
Kotts C, Carver ME, Shepard HM: Humanization of an anti-p185HER2 antibody
for human cancer therapy. Proc Natl Acad Sci USA 1992, 89(10):4285–4289.
4. Chang HR: Trastuzumab-based neoadjuvant therapy in patients with
HER2-positive breast cancer. Cancer 2010, 116(12):2856–2867.
5. Wu Y, Shang X, Sarkissyan M, Slamon D, Vadgama JV: FOXO1A is a target for
HER2-overexpressing breast tumors. Cancer Res 2010, 70(13):5475–5485.
6. Wilken JA, Maihle NJ: Primary trastuzumab resistance: new tricks for an
old drug. Ann N Y Acad Sci 2010, 1210:53–65.
7. Vazquez-Martin A, Oliveras-Ferraros C, Menendez JA: Autophagy facilitates
the development of breast cancer resistance to the anti-HER2
monoclonal antibody trastuzumab. PLoS One 2009, 4(7):e6251.
8. Raman K, Kuberan B: Chemical Tumor Biology of Heparan Sulfate
Proteoglycans. Curr Chem Biol 2010, 4(1):20–31.
9. Afratis N, Gialeli C, Nikitovic D, Tsegenidis T, Karousou E, Theocharis AD,
Pavao MS, Tzanakakis GN, Karamanos NK: Glycosaminoglycans: key players
in cancer cell biology and treatment. FEBS J 2012, 279(7):1177–1197.
10. Reiland J, Sanderson RD, Waguespack M, Barker SA, Long R, Carson DD,
Marchetti D: Heparanase degrades syndecan-1 and perlecan heparan
sulfate: functional implications for tumor cell invasion. The Journal of
biological chemistry 2004, 279(9):8047–8055.
11. Delehedde M, Lyon M, Sergeant N, Rahmoune H, Fernig DG: Proteoglycans:
pericellular and cell surface multireceptors that integrate external stimuli in
the mammary gland. J Mammary Gland Biol Neoplasia 2001, 6(3):253–273.
12. Reiland J, Kempf D, Roy M, Denkins Y, Marchetti D: FGF2 binding,
signaling, and angiogenesis are modulated by heparanase in metastatic
melanoma cells. Neoplasia 2006, 8(7):596–606.
Page 12 of 13
13. Vlodavsky I, Friedmann Y: Molecular properties and involvement of
heparanase in cancer metastasis and angiogenesis. The Journal of clinical
investigation 2001, 108(3):341–347.
14. Kato M, Wang H, Kainulainen V, Fitzgerald ML, Ledbetter S, Ornitz DM,
Bernfield M: Physiological degradation converts the soluble syndecan-1
ectodomain from an inhibitor to a potent activator of FGF-2. Nat Med
1998, 4(6):691–697.
15. Nader HB, Porcionatto MA, Tersariol IL, Pinhal MA, Oliveira FW, Moraes CT,
Dietrich CP: Purification and substrate specificity of heparitinase I and
heparitinase II from Flavobacterium heparinum. Analyses of the heparin
and heparan sulfate degradation products by 13C NMR spectroscopy.
The Journal of biological chemistry 1990, 265(28):16807–16813.
16. Nader HB, Kobayashi EY, Chavante SF, Tersariol IL, Castro RA, Shinjo SK,
Naggi A, Torri G, Casu B, Dietrich CP: New insights on the specificity of
heparin and heparan sulfate lyases from Flavobacterium heparinum
revealed by the use of synthetic derivatives of K5 polysaccharide from E.
coli and 2-O-desulfated heparin. Glycoconj J 1999, 16(6):265–270.
17. Hulett MD, Freeman C, Hamdorf BJ, Baker RT, Harris MJ, Parish CR: Cloning
of mammalian heparanase, an important enzyme in tumor invasion and
metastasis. Nat Med 1999, 5(7):803–809.
18. Ecke D, Hanck T, Tulapurkar ME, Schafer R, Kassack M, Stricker R, Reiser G:
Hetero-oligomerization of the P2Y11 receptor with the P2Y1 receptor
controls the internalization and ligand selectivity of the P2Y11 receptor.
Biochem J 2008, 409(1):107–116.
19. Spector T: Refinement of the coomassie blue method of protein
quantitation. A simple and linear spectrophotometric assay for less than
or equal to 0.5 to 50 microgram of protein. Anal Biochem 1978,
86(1):142–146.
20. Nader HB, Buonassisi V, Colburn P, Dietrich CP: Heparin stimulates the
synthesis and modifies the sulfation pattern of heparan sulfate
proteoglycan from endothelial cells. J Cell Physiol 1989,
140(2):305–310.
21. Rocha HA, Moraes FA, Trindade ES, Franco CR, Torquato RJ, Veiga SS,
Valente AP, Mourao PA, Leite EL, Nader HB, et al: Structural and hemostatic
activities of a sulfated galactofucan from the brown alga Spatoglossum
schroederi. An ideal antithrombotic agent? The Journal of biological
chemistry 2005, 280(50):41278–41288.
22. Dietrich CP, Dietrich SM: Electrophoretic behaviour of acidic
mucopolysaccharides in diamine buffers. Anal Biochem 1976, 70(2):645–647.
23. Suzuki S, Saito H, Yamagata T, Anno K, Seno N, Kawai Y, Furuhashi T:
Formation of three types of disulfated disaccharides from chondroitin
sulfates by chondroitinase digestion. The Journal of biological chemistry
1968, 243(7):1543–1550.
24. Trindade ES, Oliver C, Jamur MC, Rocha HA, Franco CR, Boucas RI, Jarrouge
TR, Pinhal MA, Tersariol IL, Gouvea TC, et al: The binding of heparin to the
extracellular matrix of endothelial cells up-regulates the synthesis of an
antithrombotic heparan sulfate proteoglycan. J Cell Physiol 2008,
217(2):328–337.
25. Boucas RI, Trindade ES, Tersariol IL, Dietrich CP, Nader HB: Development of
an enzyme-linked immunosorbent assay (ELISA)-like fluorescence assay
to investigate the interactions of glycosaminoglycans to cells. Anal Chim
Acta 2008, 618(2):218–226.
26. Hudziak RM, Lewis GD, Winget M, Fendly BM, Shepard HM, Ullrich A:
p185HER2 monoclonal antibody has antiproliferative effects in vitro and
sensitizes human breast tumor cells to tumor necrosis factor. Molecular
and cellular biology 1989, 9(3):1165–1172.
27. Scott GK, Dodson JM, Montgomery PA, Johnson RM, Sarup JC, Wong WL,
Ullrich A, Shepard HM, Benz CC: p185HER2 signal transduction in breast
cancer cells. The Journal of biological chemistry 1991, 266(22):14300–14305.
28. Sarup JC, Johnson RM, King KL, Fendly BM, Lipari MT, Napier MA, Ullrich A,
Shepard HM: Characterization of an anti-p185HER2 monoclonal antibody
that stimulates receptor function and inhibits tumor cell growth. Growth
regulation 1991, 1(2):72–82.
29. Talukder AH, Bagheri-Yarmand R, Williams RR, Ragoussis J, Kumar R, Raz A:
Antihuman epidermal growth factor receptor 2 antibody herceptin inhibits
autocrine motility factor (AMF) expression and potentiates antitumor
effects of AMF inhibitors. Clinical cancer research : an official journal of the
American Association for Cancer Research 2002, 8(10):3285–3289.
30. Motoyama AB, Hynes NE, Lane HA: The efficacy of ErbB receptor-targeted
anticancer therapeutics is influenced by the availability of epidermal
growth factor-related peptides. Cancer research 2002, 62(11):3151–3158.
Suarez et al. BMC Cancer 2013, 13:444
/>
Page 13 of 13
31. Bijsterveld NR, Hettiarachchi R, Peters R, Prins MH, Levi M, Buller HR: Lowmolecular weight heparins in venous and arterial thrombotic disease.
Thrombosis and haemostasis 1999, 82(Suppl 1):139–147.
32. Tiozzo R, Cingi MR, Pietrangelo A, Albertazzi L, Calandra S, Milani MR: Effect
of heparin-like compounds on the in vitro proliferation and protein
synthesis of various cell types. Arzneimittelforschung 1989, 39(1):15–20.
33. Smorenburg SM, Van Noorden CJ: The complex effects of heparins on
cancer progression and metastasis in experimental studies.
Pharmacological reviews 2001, 53(1):93–105.
34. Park K, Kim YS, Lee GY, Nam JO, Lee SK, Park RW, Kim SY, Kim IS, Byun Y:
Antiangiogenic effect of bile acid acylated heparin derivative.
Pharmaceutical research 2007, 24(1):176–185.
35. Ludwig RJ, Boehme B, Podda M, Henschler R, Jager E, Tandi C, Boehncke
WH, Zollner TM, Kaufmann R, Gille J: Endothelial P-selectin as a target of
heparin action in experimental melanoma lung metastasis. Cancer
research 2004, 64(8):2743–2750.
36. Cho HS, Mason K, Ramyar KX, Stanley AM, Gabelli SB, Denney DW Jr, Leahy
DJ: Structure of the extracellular region of HER2 alone and in complex
with the Herceptin Fab. Nature 2003, 421(6924):756–760.
37. Silbert JE, Sugumaran G: Biosynthesis of chondroitin/dermatan sulfate.
IUBMB Life 2002, 54(4):177–186.
38. Bao X, Nishimura S, Mikami T, Yamada S, Itoh N, Sugahara K: Chondroitin
sulfate/dermatan sulfate hybrid chains from embryonic pig brain, which
contain a higher proportion of L-iduronic acid than those from adult pig
brain, exhibit neuritogenic and growth factor binding activities.
The Journal of biological chemistry 2004, 279(11):9765–9776.
39. Sugahara K, Kitagawa H: Recent advances in the study of the biosynthesis
and functions of sulfated glycosaminoglycans. Curr Opin Struct Biol
2000, 10(5):518–527.
40. Nandini CD, Itoh N, Sugahara K: Novel 70-kDa chondroitin sulfate/
dermatan sulfate hybrid chains with a unique heterogeneous sulfation
pattern from shark skin, which exhibit neuritogenic activity and binding
activities for growth factors and neurotrophic factors. The Journal of
biological chemistry 2005, 280(6):4058–4069.
41. Sampaio LO, Nader HB: Emergence and structural characteristics of
chondroitin sulfates in the animal kingdom. Adv Pharmacol 2006, 53:233–251.
42. Pietras RJ, Pegram MD, Finn RS, Maneval DA, Slamon DJ: Remission of
human breast cancer xenografts on therapy with humanized
monoclonal antibody to HER-2 receptor and DNA-reactive drugs.
Oncogene 1998, 17(17):2235–2249.
43. Purushothaman A, Uyama T, Kobayashi F, Yamada S, Sugahara K, Rapraeger
AC, Sanderson RD: Heparanase-enhanced shedding of syndecan-1 by
myeloma cells promotes endothelial invasion and angiogenesis.
Blood 2010, 115(12):2449–2457.
44. Sanderson RD, Yang Y, Kelly T, MacLeod V, Dai Y, Theus A: Enzymatic
remodeling of heparan sulfate proteoglycans within the tumor
microenvironment: growth regulation and the prospect of new cancer
therapies. J Cell Biochem 2005, 96(5):897–905.
doi:10.1186/1471-2407-13-444
Cite this article as: Suarez et al.: Heparan sulfate mediates trastuzumab
effect in breast cancer cells. BMC Cancer 2013 13:444.
Submit your next manuscript to BioMed Central
and take full advantage of:
• Convenient online submission
• Thorough peer review
• No space constraints or color figure charges
• Immediate publication on acceptance
• Inclusion in PubMed, CAS, Scopus and Google Scholar
• Research which is freely available for redistribution
Submit your manuscript at
www.biomedcentral.com/submit