Rainfall-runoff modelling using HEC-HMS model for shipra river basin in Madhya Pradesh, India
Bạn đang xem bản rút gọn của tài liệu. Xem và tải ngay bản đầy đủ của tài liệu tại đây (635.16 KB, 10 trang )
Int.J.Curr.Microbiol.App.Sci (2020) 9(8): 3440-3449
International Journal of Current Microbiology and Applied Sciences
ISSN: 2319-7706 Volume 9 Number 8 (2020)
Journal homepage:
Original Research Article
/>
Rainfall-Runoff Modelling using HEC-HMS Model for Shipra River Basin
in Madhya Pradesh, India
Salil Sahu1*, S. K. Pyasi1, R. V. Galkate2 and R. N. Shrivastava1
1
2
Jawaharlal Nehru Krishi Vishwa Vidyalaya, Jabalpur, India
National Institute of Hydrology Regional Centre, Bhopal, India
*Corresponding author
ABSTRACT
Keywords
HEC-HMS Model,
Shipra River Basin,
Rainfall-Runoff
Article Info
Accepted:
26 July 2020
Available Online:
10 August 2020
In this study, HEC-HMS hydrological model version 4.2.1 was used to simulate the
Rainfall-Runoff process in the Shipra basin at Ujjain G/d site, located in the Madhya
Pradesh state of India. The basin model of HEC-HMS was created using HEC-GeoHMS
and Arc-Hydro Tool in ArcGIS. The rainfall losses were estimated by the widely known
Soil Conservation Service - Curve Number model, while the Soil Conservation service
Unit Hydrograph model was used to transform excess rainfall into a direct rainfall
hydrograph. The Routing of the total runoff from the outlet of the sub-basin to the outlet of
the whole basin was achieved by using the Lag model. To estimate the reference
evapotranspiration, FAO Penman-Monteith method was used in CROPWAT 8.0. The
calibration of the model was performed using the rainfall data of Indore, Dewas, and
Ujjain gauging station and discharge data of Ujjain gauging discharge station, from 2000
to 2003. Similarly, Validation was performed for the period from 2004 to 2006 on the
daily time step. The model performance was evaluated based on the computed statistical
parameters and visual examination of the hydrograph. For the Calibration period of the
continuous modeling, the performance of the model was very good, with Coefficient of
Determination (R2) = 0.85, Nash-Sutcliffe Efficiency (NSE) = 0.72, Root Mean Square
Error (RMSE) was 14.4(m3/s), and Mean Absolute Error was 53.9 ( m3/s). similarly, the
model performance for the validation was good, with R 2= 0.88, NSE =69, RMSE= 13.9
(m3/s) and Mean Absolute Error = 63.9 (m3/s). The results of the calibration and validation
values were very satisfactory. Finally, it can be concluded that the model can be used with
reasonable approximation in hydrological simulation in the Shipra basin.
Introduction
Construction and application of watershed
models that describe precipitation to stream
flow Processes have been a prime focus of
hydrological research and investigations for
numerous
decades
(Jackeman
and
Hornberger, 1993). The runoff computation
from ungauged or poorly gauged catchment is
a serious challenge in developing countries
like India where higher operation and
maintenance costs differed gauging on small
and medium rivers (Jaiswal et al., 2020). The
knowledge-based or data-driven hydrological
3440
Int.J.Curr.Microbiol.App.Sci (2020) 9(8): 3440-3449
models were developed and used by
researchers to extend rainfall records and
address modeling issues (Kar et al., 2015,
2017). Many watershed models have been
developed based on the conceptual
representation of the physical water flow
process over the entire basin area to model the
rainfall processes (Madsen 2000). The
Hydrologic Engineering Centre -Hydrological
Model System (HEC-HMS) is one such
model that supports both lumped parameter based modeling and distributed parameterbased modeling (Agarwal, 2005). HEC-HMS
provides a suite of hydrological modeling
options, with the main components focusing
on determining runoff hydrographs from subbasins and routing the hydrographs through
the channels to the study outlets (Beighley et
al., 2003). HEC-HMS is a hydrologic model
which is developed by U.S. Army Corps of
Engineers, Hydrologic Engineering Centre
(HEC) can predict runoff in response to
precipitation of dendritic watershed. The
HEC-HMS uses the separate model to
represent various components of the rainfallrunoff process like the Loss model for
calculating precipitation losses, Transform
model for transforming excess precipitation
into the direct surface runoff, Base flow
model for base flow estimation, and Routing
model for routing the reach. The model
combines a Basin model, Meteorological
model, Control specification, and Time series
data with the run option to obtain the model
result. The basin model is the physical
representation of the basin. The rainfall and
evapotranspiration data needed for simulating
the watershed process are stored in the
meteorological model, control specification
controls the period for which the model is to
be run and time-series data component, which
is used for data input (i.e precipitationdischarge data). The loss model is also called
the runoff volume model as it calculates
precipitation losses depth, which is subtracted
from the Mean Areal Precipitation (MAP)
depth to get excess precipitation, as this depth
is considered to be uniformly distributed over
the whole basin, so it represents a volume of
runoff.
Derdour et al., (2018) simulated runoff in the
semi-arid region in Ain Sefra watershed
Ksour mountains (SW Algeria) using HECHMS hydrological model, used SCS curve
number to calculate loss rate and SCS unit
hydrograph model to simulate the runoff rate.
After calibration and validation, the simulated
peak discharge was very close to the observed
value. Haibo et al., (2018) used the HECHMS model for forecasting flood in Huan
river basin of Henan, China, ArcGIS was used
to extract watershed information according to
river DEM data. The net rainfall was
calculated through the initial constant rate
loss model and the surface runoff was
calculated using the Snyder unit line model.
Muskingum method was used for routing. The
calibrated and verified using historical
observed data. The result showed the
acceptable range of determination and
coefficient of the agreement. Vishweshwaran
et al., (2017) used the HEC-HMS model for
event-based rainfall-runoff modeling for
krishna basin using daily rainfall Runoff data.
SCS-CN method was used for loss estimation
and SCS unit hydrograph for transforming
excess precipitation into a direct runoff
hydrograph. the model was calibrated for the
monsoon period of 2011 and validated for the
2007 and 2013 monsoon period. Rathod et al.,
(2015) developed a lumped continuous
hydrological model for estimating runoff for
different rainfall events in three sub-basins of
the Tapi river used the Green-ampt method as
a loss method and compared the SCS unit
hydrograph and Snyder unit hydrograph
method as a transform method and found that
the SCS unit hydrograph method gives better
results. Halwatura et al., (2013) made an
attempt to set a Rainfall-Runoff model for
Attangalu Oya river basin Sri Lanka using
3441
Int.J.Curr.Microbiol.App.Sci (2020) 9(8): 3440-3449
HEC-HMS model, he compared different
transform and loss method and found that the
combination of Snyder unit hydrograph
method as a Transform method and the deficit
and constant method as a loss method give
more reliable results for Attangalu Oya river
basin
of the study area is about 931.87 mm. The
topography is normally rolling to undulating.
Due to undulating topography, the upland
areas have excessive surface runoff which
results in soil erosion. The soil removed from
upland areas gets accumulated on the valley
land, which has moderate to poor drainage.
In the present study, the HEC-HMS model
was used to model the Rainfall-Runoff
process in the Shipra basin at the Ujjain G/d
site. In the study, the SCS Curve Number
model has been used as a loss model, SCS
unit hydrograph as a transform model, and
Lag modal as a routing model.
Data collection
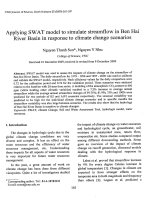
Study area
The Shipra, also known as the Kshipra,
emerges from the Kakribardi hills in Vindhya
Range north of Dhar and flows north across
the Malwa Plateau to join the Chambal River.
It is one of the religiously important rivers for
Hindu. The holy city of Ujjain is situated on
its right bank Shipra river has huge
importance as far as the religious values are
concerned. Shipra river basin has been
extended between,76° 06' 20” and 75° 55’60”
North Latitude and 22° 97'00'' and 23° 76' 20”
East Longitude and covers an area of 5679 sq.
km. The river travels a total course of about
190 km through four districts namely, Indore,
Ujjain, Dewas, and Ratlam before joining
Chambal River near Kalu-Kher village. Most
of the Shipra basin area falls in Indore and
Ujjain districts however small parts come
under Ratlam and Dewas districts (Fig. 1).
Over the years the river has lost its naturality
and now runs dry for a period of about 5 to 6
months in a year. The water of the Shipra is
utilized for drinking, industrial use, and lift
irrigation purposes. It is reported that there is
a general practice of pumping water from the
river for providing irrigation to surrounding
agricultural fields. The average annual rainfall
The daily rainfall data of Indore, Ujjain,
Dewas rain gauge stations from 20002006was used in the study. The observed
discharge data of the Ujjain gauging
discharge site was used for the calibration and
validation of the model. The meteorological
data of Indore observatory like relative
humidity, wind speed, sunshine hours, mean
and maximum temperature, etc. were used for
estimation of evapotranspiration. SRTM
DEM of 30m resolution of the study area
which
was
downloaded
from
www.earthtexplorer.usgs.gov. LULC map of
Madhya Pradesh which was downloaded from
www.bhuvan.nrsc.gov.in. Soil map of
Madhya Pradesh which was also used in the
study.
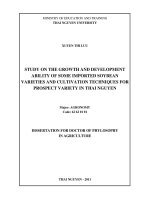
Development of the HEC-HMS model
Development of basin model for HECHMS
In the process of model development, the
development of the basic model is the first
step. Which can be developed either by
manual input of hydrologic elements and
connecting them in a dendritic network or by
using HEC-GeoHMS with DEM in Arc-Gis.
In the present study, HEC-GeoHMS and ArcHydro tool was used in ArcGIS for
developing basin model. In this, the study
area watershed was delineated and divided
into three sub-basins (Indore, Ujjain, Dewas).
The basin model imported in HEC-HMS is
shown in fig.2.
3442
Int.J.Curr.Microbiol.App.Sci (2020) 9(8): 3440-3449
Selection of modelling methods
estimation of model parameters
and
Loss Model: It is used for estimating excess
precipitation, by deducting the total losses
from the total precipitation. In the present
study Soil Conservation Service (SCS) Curve
Number method was used for loss estimation.
Estimation
parameter
of
the
SCS-CN
method
SCS Curve Number method in HEC-HMS
requires the estimation of curve number,
percent of impervious, and initial abstraction
as input data for each sub-basin. The
following procedure was followed for the
estimation of input parameters: Curve Number
The Curve Number is the function of soil
type, land use/land cover, and antecedent
moisture condition. For this purpose, the
LU/LC Map of the study area was
downloaded from www.bhuvan.nrsc.gov.in
and was classified based on the available
features in the study area. Similarly, the Soil
Map of the study area was digitised and was
provided with different soil hydrological
groups. Based on the soil group, LU/LC class
and antecedent moisture condition the
Composite Curve Number was calculated for
each sub-basins of the study area. The LU/LC
and Soil Map of study area are shown in Fig.3
&4 respectively.
Initial Abstraction
It represents the percent of the vegetation,
which prevents permanently or temporarily
the precipitation from reaching the soil
surface. This value was estimated as the
function of the curve number using the below
equation, which is shown in Table.
Percent impervious
Percent of impervious represent the percent of
basin surface which is impervious and
directly connected to the stream flow. In our
case, and due to the difficulty to determine
precisely its value, it was related to the
percent of built-up. So, the percent of built-up
in each sub-basin was taken as percent
impervious, as the built-up has minimum
infiltration.
Transform model
It is also called the Direct Runoff model as it
transforms excess precipitation into direct
runoff hydrograph. In the present study Soil
Conservation Service (SCS) Unit Hydrograph
model was used.
Estimation of SCS-unit hydrograph model
parameter
The SCS unit hydrograph method requires the
estimation of lag time as the only input data
for each sub-basin. The following procedure
was followed for the estimation of lag time
for each sub-basin: Lag time
Lag time is the time lag between peak rainfall
amount and the peak runoff. Lag time for
each sub-basin was calculated in the relation
of time of concentration, which is estimated
using the KIRPICH equation. Slope and
longest flow path of each sub-basin was
calculated using HEC-GeoHMS tool in ArcGis.
3443
= 0.6
Int.J.Curr.Microbiol.App.Sci (2020) 9(8): 3440-3449
Where,
= lag time(min)
= Time of concentration(min)
= Maximum length of travel of water or
longest length of travel of water (m)
S = Slope of the catchment
Routing model
Flood routing is the technique of determining
the flood hydrograph at the downstream of the
river by utilizing the inflow data of upstream.
The Routing of the total runoff from the outlet
of the sub-basins (Indore and Dewas) to the
outlet of the whole basin was achieved by
using Lag model
Lag Model
This is the simplest of the included routing
models. With it, the outflow hydrograph is
simply the inflow hydrograph, but with all
ordinates translated (lagged in time) by
specified duration. The flows are not
attenuated, so the shape is not changed. This
model is widely used, especially in urban
drainage channels (USACE-HEC, 2006).
Estimation of lag model parameter
The lag routing model was used as a routing
method in HEC-HMS. it only requires the
estimation of time, the lag between the inflow
and the outflow hydrograph, this was
estimated using the following procedure Lag
The assumption made for the reach was
constant flow depth over the total travel time.
the lag model only requires the only
estimation of lag routing time in minutes for
the channel. lag time was calculated by using
the below equation -
Where,
= length of reach
= velocity
= function of land cover with the effect
measure by the value manning’s and the
hydrologic radius, the river bed was assumed
to be composed mainly of sand and gravel,
therefore the value of K was taken as 5 (Ward
and Trimble, 2004, pp.138). S= Slope
Estimation of evapotranspiration
HEC-HMS require monthly average Potential
Evapotranspiration data, that was estimated
using the Penman-Monteith equation in
CROPWAT Model, but it also requires crop
coefficient for the conversion of Potential
Evapotranspiration
into
Actual
Evapotranspiration, As Trivedi et.al., (2018)
worked on Rainfall-Runoff modeling using
RRL AWBM model for Shipra basin and
estimated average crop coefficient for every
month based on the crop grown in the region,
so monthly value of crop coefficient was
taken from it.
Model calibration and validation
Before a hydrological model can be
considered to have reliable output, it needs to
be Calibrated & Validated using the observed
discharged data. The calibration is the process
of optimizing the model parameters to get the
good goodness of fit between the simulated
and observed hydrograph. In the present
study, model calibration was done by using
the estimated parameters to achieve a good fit
between simulated and observed data. The
auto-calibration (through optimization trials)
available in the HEC-HMS model was used
for optimizing the model parameters. Two-
3444
Int.J.Curr.Microbiol.App.Sci (2020) 9(8): 3440-3449
third of the available rainfall-discharge data
i.e. from 2000-2003 was used for calibration
and in the presence of these data,
Optimization of the parameters was done,
using a systematic search procedure that
yields the best fit between the observed and
computed runoff. In HEC-HMS, from the two
different search algorithms (Nelder and Mead
search algorithms and Univariate Gradient
search algorithm) the Univariate Gradient
search algorithm was selected for the study. A
variety of objective functions are provided in
HEC-HMS to measure the goodness of the fit
between the simulated and observed runoff in
different ways such as peak weighted RMS
error, percent error peak, percent error
volume, sum absolute residuals, sum squared
residuals, and time-weighted error (USACEHEC,2006). These objective functions were
recognized one by one and the objective
function that gives the better result, indicates
the end of calibration.
Table.1 Estimated and Calibrated Model parameter
Model
parameters
Curve Number
Initial
Abstraction (mm)
Lag Time (min)
Lag (min)
Dewas
Estimated Calibrate
Value
d Value
76
81.88
16
11.81
1277.26
1296.0
Ujjain
Estimated Calibrated
Value
Value
76
69.98
15
9.6
1087.50
Estimated
Value
77
14
1103.5
Indore
Calibrated
Value
67.67
9.46
753
1668
Table.2 Values of Evaluation parameters during calibration
Measure
Coefficient of determination (R2)
Nash-sutcliffe efficiency (NSE)
Root mean square error (RMSE)
Mean absolute error (MAE)
Values
0.85
0.725
53.9 (m3/s)
14.4 (m3/s)
Table.3 Observed and Simulated peak flow and discharge volume during calibration
Volume (MM)
Peak Flow (M3/S)
Time of Peak
Simulated
2257.78
1270.2
28Jul2003, 08:30
Observed
1863.52
955.0
29Jul2003, 08:30
Difference
394.25
315.2
Table.4 Values of Evaluation parameters during Validation
Measure
Coefficient of determination (R2)
Nash-sutcliffe efficiency (NSE)
Root mean square error (RMSE)
Mean absolute error (MAE)
3445
Values
0.88
0.69
63.9 (m3/s)
13.9 (m3/s)
764.27
1692
Int.J.Curr.Microbiol.App.Sci (2020) 9(8): 3440-3449
Table.5 Observed and Simulated Peak Flow & Discharge volume during Validation
Measure
Volume (MM)
Peak Flow (M3/S)
Time of Peak
Simulated
1492.97
2445.3
10Aug2006, 08:30
Observed
1015.70
1999.0
10Aug2006, 08:30
Fig.1 Map of Shipra Basin
Fig.2 Basin Model of HEC-HMS Model
3446
Difference
477.27
446.3
Int.J.Curr.Microbiol.App.Sci (2020) 9(8): 3440-3449
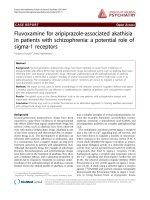
Fig.3 LU/LC Map of Study area
Fig.4 The Soil Map of the study area
Fig.5 Comparison of Observed & Simulated Hydrograph obtained during Calibration
3447
Int.J.Curr.Microbiol.App.Sci (2020) 9(8): 3440-3449
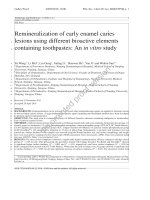
Fig.6 Comparison of Observed & Simulated Hydrograph during Validation
The model validation was done using the
optimized parameters found during the
calibration. The remaining available one-third
of the available discharge data i.e. from 20042006 was used for checking the goodness of fit
between observed and simulated runoff.
Absolute
Error,
and
Coefficient
of
Determination, that is shown in the table. 2. The
observed and simulated peak flow and
discharge volume are shown in table 3.
Results and Discussion
For validation one-third of the remaining
observed rainfall -discharge data was used i.e.
2004-2006. The parameters obtained during
calibration was used for validation. The values
of Nash-Sutcliffe
Basin model is the most important component
of HEC-HMS to simulate the rainfall-runoff
process over the entire watershed. To develop
Shipra river basin model, three subbasins and
one routing reach were created using the HECGeoHMSand Arc-Hydrptool in ArcGIS.
The schematic drawing of the basin model of
Shipra as shown in Fig.2. The estimated
parameter of different methods used in the
simulation is shown in Table 1.
Model Calibration
The optimisation trial tool (auto-calibration)
was used for optimizing the model parameter.
For this two-third of the observed rainfall discharge data was taken i.e. from 2000-2003.
The objective functions were used to compare
the simulated and observed hydrograph. The
comparison of the simulated and observed
hydrograph is shown in fig. 5. In the present
study, the objective function of the peak
weighted root mean square error was used, as it
showed the better value of Nash-SutcliFfe
Efficiency, Root Mean Square Error, Mean
Model Validation
Efficiency, Root Mean Square Error, Mean
Absolute
Error,
and
Coefficient
of
Determination, that is shown in table 4. The
peaks of the simulated and observed hydrograph
show a better fit (Fig. 6). The time to peak and
discharge volume was also approximately
similar (Table 5).
In conclusion the results based on the Nash
Sutcliffe efficiency and the graphical evaluation
of the model show that the HEC-HMS is well
suited for the simulation of rainfall-runoff in the
Shipra river basin. The SCS unit hydrograph
method available in the HEC-HMS model to
transform excess precipitation into the direct
runoff is suitable to model the Shipra river
basin. The routing lag model was found to be
suitable for routing the reach of the Shipra river.
The SCS curve number method used for loss
estimation in HEC-HMS model was also
successfully applied to Shipra basin.
3448
Int.J.Curr.Microbiol.App.Sci (2020) 9(8): 3440-3449
The peak flow and the discharge volume
obtained during validation was quite similar to
the measured values, that shows the
applicability of the model for utility and
planning of water resource management in the
Shiprariver basin.
References
Beighly, R. E. and Moglen, G. E., (2003),
Adjusting measured peak discharges from
an urbanizing watershed to reflect a
stationary land use signal, Water
Resources Research, 39, 4, 1-11.
Derdour, A.et al., (2018). Modelling rainfall
runoff relations using HEC-HMS in a
semi-arid region: Case study in Ain Sefra
watershed, Ksour
Mountains
(SW
Algeria). Journal of Water And Land
Development, No. 36 (I–III): 45–55.
Haibo, M. et al., (2018). Application of Synthetic
Unit Hydrograph on HEC-HMS Model for
flood forecasting. MATEC Web of
Conferences 246.
Halwatura, D. et al., (2013). Application of the
HEC-HMS model for runoff simulation in
a tropical catchment. Environ. Model.
Softw.46,155–162.
/>06 Agrawal, A. (2005), "A Data Model
with Pre and Post Processor for HECHMS", Report of Graduate Studies, Texas
A & M Univ. College Station.
Jaiswal, R. K., et al., (2020). Comparative
evaluation of conceptual and physical
rainfall–runoff models. Applied Water
Science,
10(1),48.
/>Madsen, H. (2000), "Automatic calibration of a
conceptual rainfall-runoff model using
multiple objectives." J. Hydrol., 235(3-4),
276-288. Jakeman, A. J., and Hornberger,
G. M. (1993). "How much complexity is
warranted in a rainfall-runoff model"
Water Resource. Res., 29(8). 2637-2649.
Rathod, P.et al.,(2015). Simulation of Rainfall Runoff Process Using HEC-HMS (Case
Study: Tapi River, India). Presented at the
Hydro 2015 International IIT Roorkee,
India, 17-19 December, 2015 20th
International Conference on Hydraulics,
Water Resources and River Engineering,
p.10.
Trivedi, A. et al., (2018). Estimation of
Evapotranspiration using CROPWAT 8.0
Model for Shipra River Basin in Madhya
Pradesh, India. Int. J. Curr. Microbiol.
Appl.Sci.7,11. />mas.2018.705.151
Trivedi, A. et al., (2019). Impact of Climate
Change Using Trend Analysis of Rainfall,
RRL AWBM Toolkit, Synthetic and
Arbitrary Scenarios. Current Journal of
Applied Science and Technology. 1-18.
USACE-HEC (2000) Hydrologic modeling
system HEC-HMS technical reference
manual. US Army Corps of Engineers,
Hydrologic Engineering Centre (HEC),
Davis, USA
USACE-HEC (2006) Hydrologic modeling
system HEC-HMS v3.2 user’s manual. US
Army Corps of Engineers, Hydrologic
Engineering Center (HEC), Davis, US
Visweshwaran Ramesh, 2017. Application of the
HEC-HMS model for runoff simulation in
the Krishnabasin.
/>48
Ward, A.D., n.d. Environmental Hydrology,
second. ed. Lewis Publishers.
How to cite this article:
Salil Sahu, S. K. Pyasi, R. V. Galkate and Shrivastava, R. N. 2020. Rainfall-Runoff Modelling using
HEC-HMS Model for Shipra River Basin in Madhya Pradesh, India. Int.J.Curr.Microbiol.App.Sci.
9(08): 3440-3449. doi: />
3449