Non parametric analysis in multi environmental trials of feed barley genotypes
Bạn đang xem bản rút gọn của tài liệu. Xem và tải ngay bản đầy đủ của tài liệu tại đây (426.91 KB, 10 trang )
Int.J.Curr.Microbiol.App.Sci (2017) 6(6): 1201-1210
International Journal of Current Microbiology and Applied Sciences
ISSN: 2319-7706 Volume 6 Number 6 (2017) pp. 1201-1210
Journal homepage:
Original Research Article
/>
Non Parametric Analysis in Multi Environmental Trials
of Feed Barley Genotypes
Ajay Verma*, J. Singh, V. Kumar, A.S. Kharab and G.P. Singh
Statistics and computer center, ICAR-Indian Institute of Wheat and Barley Research,
Karnal 132001 Haryana, India
*Corresponding author
ABSTRACT
Keywords
Feed barley, Nonparametric
measures, Spearman
rank correlation,
Ward’s hierarchical
clustering, Biplot
analysis.
Article Info
Accepted:
19 May 2017
Available Online:
10 June 2017
GXE interaction of twenty seven feed barley genotypes tested at fifteen major
barley locations interpreted by non-parametric measures. Genotype JB322 was
high yielder followed by PL890 and HUB250 among feed barley genotypes.
Descriptive statistics calculated from original yield values identified genotypes
KB1436 and KB1434 were of stable performance. Nonparametric measures, free
from distributional assumptions, Si1, Si2, Si3, Si4, Si5 Si6 and Si7 indicated
JB322, UPB1054 and KB1434 as stable genotypes, however, unstable genotypes
were RD2552G5 and DWRB156. CMR and CSD measures pointed towards
HUB113, NDB1634 and UPB1054, JB322 as desirable genotypes respectively.
CSi1 and CSi2 measures identified JB322 and UPB1054 along with UPB1054 and
HUB 113 as of stable yield performance. Genotypes UPB1054, HUB113, BH1005
based on CSi3 and CSi6 were identified as the stable genotypes whereas KB1436
and RD2552 were unstable. First two NPs were very similar for unstable
performance of RD2552 and last two NPs for similar performance of HUB250.
Introduction
Barley cereal crop has been cultivated for
food, feed, forage and brewing purpose.
Cereal is grown under varying agro climatic
situations of the country. Interpretation of
genotype
x
environment
interactions
facilitated by the use of statistical methods as
interaction complicates the identification of
superior genotypes (Berteroa et al., 2004).
The nonparametric measures, based on ranks
only, proved to be a viable alternative to
parametric measures (Dehghani, 2008). For
many applications, including selection in
breeding and testing programs, the rank
orders of genotypes are the most essential
information (Khalili and Aboughadareh,
2016). Quite large number of references
justifies the use of nonparametric measures in
the assessment of stable performance in crop
improvement trials (Ebadi-Segherloo, 2008;
Karimizadeh et al., 2012). Nonparametric
measures based rank of genotypes as per the
yield values in different environments were
developed by Huehn (1990a). The use of
corrected values, instead of original means,
for rank determination was proposed by
Huehn (1990b). Nonparametric measures of
phenotypic stability by Huehn have been used
numerously (Dehghani, 2008; Ebadi-Segerloo
1201
Int.J.Curr.Microbiol.App.Sci (2017) 6(6): 1201-1210
et al., 2008; Mahtabi et al., 2013; Liu et al.,
2010; Sabaghnia et al., 2006; Karimzadeh et
al., 2013). Recent papers have exploited
nonparametric measures to analyze GxE
interaction in agricultural trials (Mortazavian
and Azizinia, 2014). Nonparametric stability
statistics had been used by plant breeders
worldwide due to the potential returns relative
to other parameters (Farshadfar et al., 2014).
corrected values of yield to genotypes as:
Materials and Methods
Research data of this study involved twenty
seven feed barley genotypes evaluated at
fifteen major barley growing locations across
the country. Environmental conditions along
with genotype pedigrees were given in table 1
for completeness. Xij denotes the phenotypic
value of ith genotype in jth environ¬ment,
where i= 1,2,,...k, j=1,2,..., n. Rank of the ith
genotype in the jth environment denoted by rij
and the average rank of the ith genotype
across environments by. (Karimizadeh et al.,
2012) Si1 estimate considered all possible
pair-wise rank differences, while Si2 was
based on variances of ranks for each genotype
across environments. The nonparametric
stability statistic Si4 is similar to that of Yau
and Hamblin (1994), which used relative
yield not only to give equal weight to each
environment, but also to provide a measure of
yield stability. Non-parametric statistics of
Si3 and Si6 combine yield and stability based
on yield ranks of genotypes in each
environment. Karimzadeh et al., 2013
proposed the correction for yield of ith
genotype in jth environment as (X*ij = Xij .+) as X*ij, was the corrected phenotypic
value;. was the mean of ith genotype in all
environments and was the grand mean. The
ranks obtained from these adjusted values
X*ij, depend only on GxE interaction and
error effects. The genotype with the highest
adjusted yield was given a rank of 1 and vice
versa for lowest adjusted yielder. Following
nonparametric measures were calculated
based on the ranks assigned by original and
On parametric measures to measure stability
defined by Thennarasu’s (1995). In these
measures r*ij was the rank of X*ij, and and
Mdi were the mean and median ranks for
original, where * and M*di were the same
parameters computed from the corrected yield
values.
SAS-based computer program of Lu (1995)
and SASGESTAB (Hussein et al., 2000)
employed
to
calculate
nonparametric
measures.
Hierarchical
clustering
of
genotypes based on yield along with non
parametric measures by Ward’s method
(Ward, 1963) was performed to understand
the relationships among the nonparametric
methods. Spearman’s rank correlation
coefficient calculates the correlation among
1202
Int.J.Curr.Microbiol.App.Sci (2017) 6(6): 1201-1210
ranks as follows :
Kang and Pham (1991) studied several
stability methods simultaneous for yield and
stability. These methods provide a lot of
flexibility for plant breeders for the
simultaneous selection for both mean yield
and stability (Mohammadi et al., 2007).
Results and Discussion
According to mean yield, genotype JB322
was the highest yielder followed by PL890
and
HUB250,
although
remarkable
differences were evident among the studied
feed barley genotypes (Table 2).
The following three descriptive statistics;
mean of ranks (MR), standard deviation of
ranks (SD) and coefficient of variation of
ranks (CV) were calculated for original ranks.
According to these statistics, genotypes
KB1436 and KB1434 were of stable
performance, while genotypes JB322, JB325
and PL890 based on MR, genotypes
DWRB156 and RD2552 based on SD and
genotypes HUB250 and BH946 based on CV,
were identified as of unstable nature. Simple
descriptive statistics based on ranks
discriminated among genotype performance
(Karimzadeh et al., 2012).
Seven nonparametric measures (Si1, Si2, Si3,
Si4, Si5 Si6 and Si7) based on original yield
values indicated genotypes JB322, UPB1054
and KB1434 were the most stable, however,
most of studied measures pointed towards
RD2552G5 and DWRB156 as the unstable
genotypes, stable genotypes according to
Huehn’s nonparametric measures from
uncorrected values demonstrated high mean
yield. In other words, with maintenance of
genotype effect in each cell of two-way data,
mean yield confounds GEI and affects
stability analysis (Farshadfar et al., 2014).
Simultaneous selection for both mean yield
and stability is an important consideration as
According to table 3, genotype JB322
followed by UPB1054 were the most stable as
well as RD2552 and DWRB156 were of
unstable performance based on a corrected
dataset that produced a mean of corrected
ranks (CMR), standard deviation of corrected
ranks (CSD), coefficient of variation of
corrected ranks (CCV) and all Huehn’s
nonparametric measures (CSi1, CSi2, CSi3,
CSi4, CSi5 CSi6 and CSi7). Also genotypes
UPB1054 and HUB113 were identified as the
most stable and KB1436 and RD2552 were
unstable based on the above mentioned
nonparametric measures of phenotypic
stability (Karimizadeh et al., 2012). In the
mentioned strategy, the following concept of
stability was applied; it determines the
stability of genotype over environment if its
rank is similar over other environments
(biological concept). Many authors (EbadiSegerloo et al., 2008; Zali et al., 2011;
Sabaghnia et al., 2006) have used the
nonparametric measures based on corrected
values for stability and demonstrated that
these statistics were associated with the
biological concept of stability.
Nonparametric indices of Thennarasu’s
evaluated the genotypes performance
differently i.e. NPi (1) pointed towards JB322
and UPB1054 as stable in comparison to
others and RD2552 along BH946 unstable
(Table 3) while, genotype PB891 showed
lowest value NPi (2) followed by KB1434
and because of high value stabilities of
BH946 and RD2552 were low, NPi (3) unlike
NPi (2) identified BH1005 as the most stable
followed by BH949. The unstable genotypes
based on NPi (3) were JB322 and HUB250.
Stability parameters NPi (4) like NPi (2)
1203
Int.J.Curr.Microbiol.App.Sci (2017) 6(6): 1201-1210
identified PB891 and KB1434 and BH946 but
like NPi(3) pointed towards unstable
performance of HUB250. The results of first
two NPs were very similar for unstable
performance of RD2552 and last two NPs
towards HUB250 as unstable genotypes
(Mohammadi et al., 2007).
Clustering of genotypes
parametric measures
as
per
non
Ward’s method of hierarchical cluster
analysis exploited to group genotypes
according
to
yield
and
different
nonparametric measures of phenotypic
stability. The clustering considered squared
Euclidean distance as dissimilarity measure
among genotypes in Ward’s method (Figure
2). In Ward’s procedure, the dissimilarity
between two clusters is shown by the “loss of
information” from joining the two clusters
with this loss of information measured by the
increase in error sum of squares. The cluster
analysis revealed four distinct clusters among
twenty seven genotypes: cluster of high to
moderate yielders consisted of genotypes
JB890, PL890, BH902, and RD2922 as
UPB1054 as the most favorable and next
cluster of four genotypes consisted of
unstable genotypes RD2552, DWRB156,
BH946 and HUB250. Third cluster of six
genotypes comprised of moderately yielder
genotypes. Finally fourth cluster grouped
highly unstable genotypes as per non
parametric measures. It seems that according
to corrected statistics, genotypes UPB1054,
HUB113 and JB322 were the most stable, but
when based on uncorrected statistics,
genotypes UPB1054 and KB1434 were the
most stable. Regarding mean yield regardless
of stability, the most favorable genotypes
were JB322 and PL890.
Table.1 Parentage details of feed barley genotypes along with environmental conditions
Code
IVTIRFB-1
IVTIRFB-2
IVTIRFB-3
IVTIRFB-4
IVTIRFB-5
IVTIRFB-6
IVTIRFB-7
IVTIRFB-8
IVTIRFB-9
IVTIRFB-10
IVTIRFB-11
Genotype
KB1436
BH959
RD2922
HUB250
BH1004
UPB1054
PL890
JB325
BH1006
HUB113
KB1434
IVTIRFB-12
IVTIRFB-13
IVTIRFB-14
IVTIRFB-15
IVTIRFB-16
IVTIRFB-17
IVTIRFB-18
IVTIRFB-19
IVTIRFB-20
IVTIRFB-21
IVTIRFB-22
IVTIRFB-23
RD2786
BH902
JB322
UPB1053
PB891
BH1005
HUB249
NDB1634
BH946
RD2923
KB1425
DWRB157
IVTIRFB-24
IVTIRFB-25
IVTIRFB-26
IVTIRFB-27
RD2921
JB319
RD2552
DWRB156
Parentage
LAKHAN/JB137
BH393/BH331
RD2809/RD2743
RD2618/RD2660
33rd IBON200/BH902
IBYT-LRA-M-12(Sr.No.27 of EIBGN 2013-14)
DWRUB52/DWRUB62
RD2615/DL88
15th HBSN-4/BH902
KARAN280/C138
GLORIABAR/COPAL//PM5/BEN/3/SEN/4/PETUNIA1/5/BBSC/CONGON
A// BLLU/3/CIRU
RD2634/NDB1020//K425
BH495/RD2552
JB101/BH331
IBYT-MRA-12(Sr.No.35 of EIBGN 2013-14)
IBON 343/12th HSBN-176
BHMS24A/WG127
RD2618/RD2660
IBON-HI-40 (2009-10
BHMS22A/BH549//RD2552
RD2552/RD2786
K508/NDB1295
ALANDA02/4/ARIZONA5908/ATHS//ASSE/3/F208.74/5/ALAND
A/3/CI08887/CI05761//LIGNEE640-34
RD2508/RD2743
LAKHAN/BH353
RD2035/DL472
P.STO/3/LBIRAN/UNA80//LIGNEE640/4/BLLU/5/PETUNIA
1/6/M9846//CCXX14.ARZ3/PA
1204
Locations
Durgapura
Hisar
Ludhiana
Tabiji
Pant Nagar
Karnal
Varanasi
Rewa
Faizabad
Kanpur
Sabour
Latitude
26 ͦ 51 'N
29 ͦ 10 'N
30o54 ' N
26 ͦ 35'N
29 o02 ' N
29 ͦ 43 ' N
25 ͦ 20 ' N
24 ͦ 31 ' N
26 ͦ 47 'N
26 ͦ 29 ' N
25 ͦ 24 ' N
Longitude
75 ͦ 47 ' E
75 ͦ 46 ' E
75o 52' E
74 ͦ 61' E
79 ͦ 48' E
76 ͦ 58 ' E
83 ͦ 03 ' E
81 ͦ 15 ' E
82 ͦ 12 ' E
80 ͦ 18 ' E
87 ͦ 04 ' E
Altitude (m)
390
215.2
247
456.1
237
252
75.5
365.7
113
125.9
41
SK Nagar
Sagar
Morena
Udaipur
24 ͦ 19 ' N
23 ͦ 83 ' N
26 ͦ 56 ' N
24 ͦ 34 ' N
72 ͦ 19 ' E
78 ͦ 73 ' E
78 ͦ 80 ' E
70 ͦ 42 ' E
154.5
523
152
582
Int.J.Curr.Microbiol.App.Sci (2017) 6(6): 1201-1210
Table.2 Descriptive statistics and non-parametric measures based on original values
Code
IVTIRFB-1
IVTIRFB-2
IVTIRFB-3
IVTIRFB-4
IVTIRFB-5
IVTIRFB-6
IVTIRFB-7
IVTIRFB-8
IVTIRFB-9
IVTIRFB-10
IVTIRFB-11
IVTIRFB-12
IVTIRFB-13
IVTIRFB-14
IVTIRFB-15
IVTIRFB-16
IVTIRFB-17
IVTIRFB-18
IVTIRFB-19
IVTIRFB-20
IVTIRFB-21
IVTIRFB-22
IVTIRFB-23
IVTIRFB-24
IVTIRFB-25
IVTIRFB-26
IVTIRFB-27
Genotype
KB1436
BH959
RD2922
HUB250
BH1004
UPB1054
PL890
JB325
BH1006
HUB113
KB1434
RD2786
BH902
JB322
UPB1053
PB891
BH1005
HUB249
NDB1634
BH946
RD2923
KB1425
DWRB157
RD2921
JB319
RD2552
DWRB156
Yield (q/ha)
32.52
36.74
39.68
41.30
35.55
39.91
41.45
40.76
35.52
39.51
33.79
40.52
40.99
41.85
38.97
33.77
37.35
34.93
37.52
41.24
39.59
36.77
39.57
38.33
38.72
39.01
40.54
MR
20.87
16.67
11.00
10.53
16.87
11.53
10.07
9.87
18.40
11.60
19.40
11.93
10.13
8.87
13.00
19.60
15.67
18.00
14.27
11.80
12.73
15.73
13.93
14.73
13.53
13.27
13.00
SD
6.13
6.43
6.60
8.35
7.14
5.30
6.80
6.28
6.66
6.56
6.32
7.89
6.59
4.79
7.73
8.19
6.07
7.65
7.56
8.82
6.86
7.52
8.17
8.28
7.42
9.71
9.51
CV
0.29
0.39
0.60
0.79
0.42
0.46
0.68
0.64
0.36
0.57
0.33
0.66
0.65
0.54
0.59
0.42
0.39
0.43
0.53
0.75
0.54
0.48
0.59
0.56
0.55
0.73
0.73
Med
23.00
18.00
10.00
9.00
19.00
13.00
7.00
10.00
20.00
11.00
20.00
13.00
8.00
9.00
13.00
24.00
15.00
18.00
13.00
9.00
14.00
18.00
15.00
14.00
15.00
11.00
14.00
Si1
6.82
7.52
7.64
9.71
8.29
6.17
7.41
7.33
7.77
7.54
7.20
9.22
7.45
5.66
8.99
9.07
7.16
8.91
8.95
10.25
8.11
8.67
9.56
9.79
8.78
11.33
11.18
Si2
7.26
7.24
7.63
9.16
8.07
5.93
8.38
7.44
7.44
7.75
7.48
8.96
7.35
5.53
9.50
9.10
6.72
8.72
8.15
9.35
7.82
8.30
8.89
8.90
8.08
10.12
10.38
Si3
25.19
34.76
55.45
92.63
42.32
34.14
64.26
55.92
33.78
51.86
28.85
72.98
59.97
36.29
64.31
47.94
32.89
45.56
56.14
92.24
51.75
50.27
67.10
65.09
57.02
99.42
97.38
Si4
5.84
6.06
6.29
6.85
6.83
4.84
5.93
6.06
6.44
6.30
6.11
7.26
6.01
4.60
6.90
7.74
5.52
7.23
6.76
8.39
5.89
6.60
7.89
7.99
6.74
9.34
9.06
Si5
4.83
5.33
5.33
7.10
5.89
4.43
5.15
4.94
5.57
5.17
4.99
6.48
5.51
3.88
5.87
6.88
5.11
6.27
6.55
7.76
5.62
6.36
7.01
7.18
6.36
8.68
8.13
Si6
3.47
4.80
7.27
10.11
5.24
5.76
7.67
7.51
4.54
6.69
3.86
8.15
8.16
6.56
6.77
5.27
4.89
5.22
6.89
9.86
6.62
6.06
7.55
7.31
7.05
9.82
9.38
Si7
37.55
41.38
43.57
69.70
50.98
28.12
46.21
39.41
44.40
42.97
39.97
62.21
43.41
22.98
59.71
67.11
36.81
58.57
57.21
77.74
47.07
56.50
66.78
68.50
55.12
94.21
90.43
Table.3 Descriptive statistics and non-parametric measures based on corrected values
Code
IVTIRFB-1
IVTIRFB-2
IVTIRFB-3
IVTIRFB-4
IVTIRFB-5
IVTIRFB-6
IVTIRFB-7
IVTIRFB-8
IVTIRFB-9
IVTIRFB-10
IVTIRFB-11
IVTIRFB-12
IVTIRFB-13
IVTIRFB-14
IVTIRFB-15
IVTIRFB-16
IVTIRFB-17
IVTIRFB-18
IVTIRFB-19
IVTIRFB-20
IVTIRFB-21
IVTIRFB-22
IVTIRFB-23
IVTIRFB-24
IVTIRFB-25
IVTIRFB-26
IVTIRFB-27
Genotype
KB1436
BH959
RD2922
HUB250
BH1004
UPB1054
PL890
JB325
BH1006
HUB113
KB1434
RD2786
BH902
JB322
UPB1053
PB891
BH1005
HUB249
NDB1634
BH946
RD2923
KB1425
DWRB157
RD2921
JB319
RD2552
DWRB156
CMR
13.33
14.07
13.13
14.60
13.60
14.33
14.00
13.87
14.80
12.40
13.40
14.13
13.87
14.80
13.33
14.87
13.53
13.67
13.07
15.00
14.33
13.33
15.87
13.73
14.00
13.80
15.13
CSD
8.99
7.19
6.75
8.87
8.61
5.77
6.81
6.65
8.64
6.54
7.94
8.58
6.61
5.99
8.16
7.90
6.53
8.98
8.18
9.58
7.02
8.70
8.81
8.72
7.76
10.29
9.74
CCV
0.67
0.51
0.51
0.61
0.63
0.40
0.49
0.48
0.58
0.53
0.59
0.61
0.48
0.40
0.61
0.53
0.48
0.66
0.63
0.64
0.49
0.65
0.56
0.64
0.55
0.75
0.64
CMed
11.00
13.00
11.00
13.00
14.00
16.00
13.00
14.00
17.00
12.00
14.00
14.00
12.00
17.00
15.00
16.00
15.00
13.00
12.00
13.00
15.00
14.00
19.00
14.00
14.00
11.00
16.00
CSi1
10.53
8.44
7.85
10.44
10.21
6.80
7.89
7.71
9.96
7.56
9.28
10.15
7.43
6.78
9.64
9.24
7.62
10.57
9.66
11.22
8.25
10.21
10.15
10.34
9.20
12.00
11.39
CSi2
13.93
8.44
8.83
11.03
10.45
7.17
9.84
9.22
10.83
7.97
12.85
10.18
10.54
9.33
9.42
11.48
8.12
10.94
9.02
11.32
8.24
10.25
9.36
9.58
8.76
10.75
10.58
CSi3
148.70
58.60
53.76
92.44
88.06
40.67
63.00
62.00
83.70
49.13
106.24
78.00
59.19
69.63
69.98
81.38
49.21
103.24
73.36
95.97
50.77
85.93
72.09
78.64
60.38
107.73
92.25
1205
CSi4
10.53
7.33
6.86
8.48
8.48
6.20
6.47
7.50
9.05
6.22
9.55
8.48
7.38
7.95
7.25
8.98
6.07
9.00
7.74
9.79
6.27
7.99
8.59
8.48
7.00
9.94
9.30
CSi5
9.49
6.51
5.33
8.16
7.64
5.42
5.98
6.21
7.63
5.09
7.39
7.22
5.19
7.36
6.60
7.03
5.47
8.60
7.08
8.48
5.88
7.45
8.15
7.52
6.43
9.22
8.80
CSi6
10.68
6.94
6.09
8.38
8.43
5.67
6.40
6.72
7.73
6.16
8.27
7.67
5.62
7.46
7.43
7.09
6.06
9.44
8.13
8.48
6.16
8.38
7.70
8.21
6.89
10.02
8.72
CSi7
141.61
58.88
50.43
96.40
85.55
41.64
63.00
61.41
88.49
43.51
101.69
78.74
58.63
73.60
66.64
86.41
47.57
100.79
68.47
102.83
51.98
81.84
81.70
77.14
60.38
106.19
99.71
NPi (1)
7.667
6.267
5.333
7.333
7.333
4.733
5.267
4.933
7.533
5.067
6.467
6.933
5.067
4.600
6.467
6.467
5.333
7.733
6.933
8.400
5.733
7.333
7.400
7.467
6.400
9.067
8.200
NPi (2)
0.333
0.348
0.533
0.815
0.386
0.364
0.752
0.493
0.377
0.461
0.323
0.533
0.633
0.511
0.497
0.269
0.356
0.430
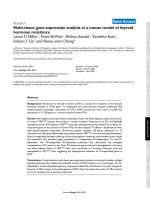
0.533
0.933
0.410
0.407
0.493
0.533
0.427
0.824
0.586
NPi (3)
0.551
0.445
0.624
0.901
0.530
0.541
0.762
0.767
0.494
0.549
0.502
0.718
0.730
0.935
0.607
0.458
0.425
0.539
0.560
0.830
0.547
0.555
0.627
0.576
0.555
0.750
0.742
NPi (4)
0.505
0.506
0.713
0.991
0.605
0.590
0.783
0.782
0.541
0.652
0.478
0.851
0.733
0.765
0.741
0.471
0.486
0.587
0.677
0.951
0.648
0.649
0.729
0.702
0.680
0.905
0.876
Int.J.Curr.Microbiol.App.Sci (2017) 6(6): 1201-1210
Table.4 Loadings of rank
derived from measures for
PC1 and PC2
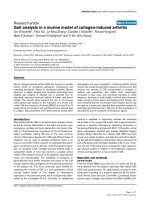
Fig.1 Principal component analysis (PC1 vs PC2) plot of ranks based on measures
1
0.9
0.8
0.7
0.6
PL890
BH902
JB325
RD2922
HUB250
CV
NPi3
0.4
JB322
0.3
HUB113
-0.9
Si3
RD2786
UPB1053
CMR
JB319
0.1
-1
Si6
NPi4
NPi2
0.2
RD2923
UPB1054
Yield
0.5
-0.8
-0.7
-0.6
-0.5
-0.4
-0.3
-0.2
-0.1
0
Cmed
0
-0.1
0.2
-0.2
-0.3
KB1425
0.3
0.4
BH1006
-0.6
BH1004
MedMR
PB891
-0.7
-0.8
KB1434
-0.9
-1
1206
0.5
CSD
CSi1
NPi1
CCV
CSi5
CSi4
CSi6
CSi7
CSi2 CSi3
-0.4
-0.5
Si1
Si7
Si5
SD
Si2
Si4
RD2921
NDB1634
0.1
BH1005
BH959
DWRB157
HUB249
0.6
0.7
0.8
Yield
MR
SD
CV
Med
Si1
BH946
Si2
Si3
Si4
DWRB156
Si5
Si6
Si7
CMR
CSD
CCV
0.9
1
Cmed
CSi1
CSi2
CSi3
CSi4
CSi5
CSi6
CSi7
NPi1
NPi2
NPi3
NPi4
%
Variance
PC1
-0.008
0.042
0.250
0.122
0.014
0.247
0.239
0.204
0.248
0.247
0.146
0.252
0.077
0.261
0.238
-0.039
0.259
0.154
0.188
0.209
0.225
0.211
0.201
0.252
0.149
0.089
0.149
PC2
0.340
-0.335
0.061
0.309
-0.327
0.069
0.057
0.228
0.030
0.062
0.293
0.069
0.066
-0.087
-0.111
-0.011
-0.090
-0.183
-0.196
-0.160
-0.129
-0.165
-0.176
-0.105
0.246
0.241
0.275
49.36
31.23
Int.J.Curr.Microbiol.App.Sci (2017) 6(6): 1201-1210
Table.5 Speraman’s rank correlation of yield with non-parametric measures calculated from original and corrected values
Yield MR
SD
CV
MR
-0.950
SD
0.070 0.105
CV
0.817 -0.729 0.553
Med
-0.889 0.931 -0.027 -0.775
Si
1
Si2
Med
Si1
Si2
Si3
Si5
Si6
Si7
CMR CSD
CCV
CMed CSi1 CSi2 CSi3 CSi4 CSi5 CSi6 CSi7 NPi (1) NPi (2) NPi (3)
0.051 0.113 0.984 0.535 -0.003
0.115 0.042 0.957 0.599 -0.078 0.922
Si
3
0.587 -0.464 0.786 0.921 -0.552 0.781 0.793
Si
4
-0.072 0.226 0.933 0.438 0.102 0.951 0.894 0.690
Si5
Si4
0.015 0.163 0.967 0.481 0.038 0.978 0.866 0.739 0.915
Si
6
0.773 -0.671 0.603 0.975 -0.737 0.590 0.605 0.946 0.484 0.567
Si
7
0.070 0.105 1.000 0.553 -0.027 0.984 0.957 0.786 0.933 0.967 0.603
CMR 0.392 -0.172 0.281 0.283 -0.045 0.260 0.200 0.267 0.200 0.276 0.305 0.281
CSD
-0.239 0.433 0.756 0.193 0.278 0.741 0.701 0.422 0.760 0.734 0.237 0.756 0.155
CCV
-0.353 0.496 0.672 0.097 0.319 0.665 0.653 0.331 0.710 0.654 0.128 0.672 -0.172 0.916
CMed 0.002 0.111 -0.017 -0.182 0.358 -0.005 -0.009 -0.141 0.013 -0.015 -0.187 -0.017 0.572 -0.126 -0.246
cSi1
-0.270 0.447 0.757 0.171 0.295 0.742 0.710 0.402 0.765 0.736 0.211 0.757 0.097 0.988 0.939 -0.131
cSi2
-0.248 0.392 0.416 0.013 0.232 0.328 0.418 0.096 0.425 0.337 0.034 0.416 0.179 0.687 0.609 -0.111 0.659
cSi3
-0.319 0.474 0.514 0.000 0.310 0.458 0.506 0.153 0.553 0.460 0.030 0.514 0.070 0.860 0.824 -0.118 0.855 0.898
cSi4
-0.299 0.455 0.495 -0.003 0.325 0.469 0.440 0.157 0.587 0.470 0.047 0.495 0.244 0.832 0.730 -0.035 0.800 0.870 0.934
cSi5
-0.237 0.436 0.543 0.033 0.324 0.522 0.491 0.207 0.581 0.521 0.066 0.543 0.251 0.910 0.805 0.028 0.896 0.722 0.912 0.897
cSi6
-0.308 0.469 0.535 0.004 0.329 0.514 0.509 0.182 0.585 0.511 0.026 0.535 0.038 0.904 0.894 -0.107 0.910 0.716 0.938 0.869 0.959
cSi7
-0.287 0.464 0.515 0.009 0.318 0.462 0.501 0.153 0.555 0.460 0.034 0.515 0.202 0.857 0.772 -0.045 0.838 0.901 0.985 0.960 0.929 0.922
NPi (1) -0.357 0.552 0.729 0.074 0.388 0.724 0.655 0.322 0.758 0.729 0.125 0.729 0.117 0.975 0.917 -0.077 0.972 0.671 0.838 0.819 0.882 0.878 0.835
NPi (2) 0.733 -0.692 0.518 0.900 -0.831 0.503 0.518 0.855 0.405 0.469 0.906 0.518 0.106 0.247 0.203 -0.357 0.224 0.044 0.083 0.060 0.110 0.105 0.063 0.154
NPi (3) 0.824 -0.745 0.323 0.853 -0.781 0.290 0.374 0.730 0.221 0.247 0.837 0.323 0.263 0.178 0.086 -0.163 0.132 0.126 0.143 0.133 0.181 0.143 0.153 0.023 0.849
NPi (4) 0.827 -0.730 0.488 0.949 -0.776 0.477 0.531 0.869 0.389 0.419 0.924 0.488 0.286 0.247 0.153 -0.145 0.223 0.052 0.103 0.089 0.170 0.136 0.109 0.115 0.915 0.936
Critical values of Spearman correlation at 5% and 1% level of significance (df 25) are 0.398 and 0.510 respectively
1207
Int.J.Curr.Microbiol.App.Sci (2017) 6(6): 1201-1210
Fig.2 Hierarchical cluistering of feed barley genotypes as per non parametric measures
nonparametric
positive association among Sis, Si3 showed
significant correlation with NPi(s).
Spearman’s rank correlations among rank of
genotypes as per various non-parametric
measures were then calculated (Table 5).
According to results of rank correlations there
was a highly significant (p<0.01) positive
rank correlation between mean yield with
Si3,Si6 NPi(2) NPi(3), NPi(4) and highly
significant negative association with MR and
CV (Mohammadi et al., 2007). Yield
expressed low correlation of inverse relation
with CSi1, CSi2, CSi3, CSi4, CSi5, CSi6 and
CSi7. MR had significant negative rank
correlation with CV, Si6 NPi (2) NPi(3)
NPi(4) whereas significant positive with
CSi1,CSi2,CSi3,CSi4,CSi5,CSi6 and CSi7
(Mahtabi et al., 2013). SD had a highly
significant positive with most of the measures
either based on original or corrected values.
Si1 showed highly significant positive rank
correlation with Si2,Si3,Si4 Si5,Si6,Si7
CSi1,CSi5 CSi6, NPi(1) and significant
Positive CSi3, CSi6, NPi (2) and NPi(4)
(Mohammadi and Ahmed, 2008). Significant
Si4 and. Si3 maintained same type of
relationship with other measures. Similar
behavior expressed by Si7 to show positive
relationship. CSD showed significant positive
correlation with CSis, and with very low
positive interaction with NPi(s). CSi1 had
positive significant relationship and very low
with NPi(s). More over CSis were positively
associated among themselves. NPi(2)
expressed significant positive rank correlation
with NPi(3) and NPi(4) (Mortazavian and
Azizinia, 2014).
Relationship
statistics
among
Biplot analysis of non-parametric measures
Principal component (PC) analysis based on
the rank correlation matrix generated by non
para-metric
measures
was
performed
understand relationships if any among these
measures. Table 4 shows the loading of the
first two PCA of ranks of non-parametric
measures as two first PCs (PC1 and PC2)
explained 80.6% (49.36 and 31.23 % by PC1
1208
Int.J.Curr.Microbiol.App.Sci (2017) 6(6): 1201-1210
and PC2, respectively) of the total variance.
Better visualization of relationships among
the different measures and yield (Y) displayed
graphically by biplot (Dehghani et al., 2009).
In this plot, the PC1 axis mainly distinguished
mean yield besides the measures of CV, MR
and (6) is from the other measures.
Thus, the first principal component separated
the measures into two groups according to the
two stability concepts (biological and
agronomic concept of stability). The second
PC separated the nonparametric measures of
phenotypic stability into two groups
according to the yield and stability (Fig. 1).
The original data-based nonparametric
measures showed close correlation with CV,
Si3 Si6 and no relation with CMR, Si4, Si7 as
vectors corresponding to these measures
expressed right angle with vector of yield
(Mortazavian and Azizinia, 2014). Genotypes
HUB250, RD2786, DWRB156, UPB1053
and DWRB157 clustered with measures based
on original yield values. Corrected data-based
nonparametric measures were closely related
among themselves and clustered together.
Yield showed nearly straight line angle with
vectors of MR and Median. These measures
favored HUB249, KB1425, BH1004 and
PL891.
Acknowledgement
The multi-environment trials of barley
genotypes were performed within the
AICWandBIP project at centers across the
country. Authors are grateful to all the staff of
testing centers for their hard work to carry out
the field evaluation and data recording.
References
Berteroa, H.D., de la Vegab, A.J., Correaa,
G., Jacobsenc, S.E., Mujica, A. 2004.
Genotype and genotype-by-environment
interaction effects for grain yield and
grain size of quinoa (Chenopodium
quinoa Willd.) as revealed by pattern
analysis
of
international
multienvironment trials. Field Crops Res.,
89: 299-318.
Dehghani, H. 2008. Estimating yield stability
by nonparametric stability analysis in
maize (Zea mays L.). Plant Breed Seed
Sci., 58: 61-77.
Dehghani, H., Sabaghnia, N., Moghaddam,
M. 2009. Interpreta¬tion of genotypeby-environment interaction for late
maize hybrids’ grain yield using a biplot
method. Turk. J. Agric. For., 33: 139148.
Ebadi-Segherloo, A., Sabaghpour, S.H.,
Dehghani, H., Kamrani, M. 2008. Nonparametric measures of phenotypic
stability in chickpea genotypes (Cicer
arietinum L.). Euphytica, 2: 221-229.
Farshadfar, E., Mahmudi N. and Sheibanirad,
A. 2014. Nonparametric methods for
interpreting genotype × environment
interaction in bread wheat genotypes. J.
Bio. Env. Sci., 4: 55-62.
Huehn, M.1990a. Non-parametric measures
of phenotypic sta¬bility. Part 1: Theory.
Euphytica, 47:189-194.
Huehn, M.1990b. Non-parametric measures
of phenotypic stability: Part 2.
Application. Euphytica, 47: 195-201.
Hussein, M.A., Bjornstad, A., Aastveit, A.H.
2000. SASG × ES¬TAB: A SAS
program for computing genotype 3
environment stability statistics. Agron.
J., 92: 454-459.
Karimizadeh,
R.,
Mohammadi,
M.,
Sabaghnia, N. and Shefazadeh, M.K.
2012. Using Huehn’s nonparametric
stability statistics to investigate
genotype × environment interaction.
Not. Bot. Horti. Agrobo., 40: 195-200.
Karimzadeh, R., Mohammadi M., Sabaghnia
N., Shefazadeh M.K., Hosseinpour, T.
and Armion, M. 2013. Exploring of
1209
Int.J.Curr.Microbiol.App.Sci (2017) 6(6): 1201-1210
genotype by environment interaction by
nonparametric stability procedures.
Natura montenegrina, 12: 181-204.
Khalili, M., and Pour-Aboughadareh, A.
2016. Parametric and non-parametric
measures for evaluating yield stability
and adaptability in barley doubled
haploid lines. J. Agri. Sci. Tech., 18:
789-803
Liu, Y.J., Duan, C., Tian, M.L., Hu, E.L.,
Huang, Y.B. 2010. Yield stability of
maize hybrids evaluated in maize
regional trials in southwestern China
using nonparametric methods. Agric.
Sci. China, 9: 1413-1422.
Lu, H.Y. 1995. PC-SAS program for
Estimation Huehn’s non parametric
stability statistics. Agron. J., 87: 888891.
Mahtabi, E., Farshadfar, E. and Jowkar, M.M.
2013. Non parametric estimation of
phenotypic stability in Chickpea (Cicer
arietinum L.). Int. J. Agri. Crop Sci., 5:
888-895.
Mohammadi, R., Abdulahi, A., Haghparast,
R., Armion, M. 2007. Interpreting
genotype x environment interactions for
durum wheat grain yields using nonparametric methods. Euphytica, 157:
239–251.
Mohammadi, R. and Ahmed, A. 2008.
Comparison of parametric and non-
parametric methods for selecting stable
and adapted durum wheat genotypes in
variable environments, Euphytica, 159:
419–432.
Mortazavian, S.M.M. and Azizinia, S. 2014.
Nonparametric stability analysis in
multi-environment trial of canola.
Turkish J. Field Crops, 19(1): 108-117.
Sabaghnia, N., Dehghani, H., Sbaghpour,
S.H. 2006. Nonparametric methods for
interpreting genotype × environment
interaction of lentil genotypes. Crop
Sci., 46: 1100-1106.
Thennarasu, K. 1995. On certain nonparametric procedures for studying
genotype × environment interactions
and yield stability. PhD. Thesis. P.J.
School, IARI, New Delhi, India.
Ward J.H. 1963. Hierarchical grouping to
optimize an objective function. J. Am.
Stat. Assoc., 58: 236–224.
Yau, S.K., Hamblin, J. 1994. Relative yield as
a measure of entry performance in
variable environments. Crop Sci., 34:
813-817.
Zali, H., Farshadfar, E. and Sabaghpour, H.
2011. Non-parametric analysis of
phenotypic stability in chickpea (Cicer
arietinum L.) genotypes in Iran. Crop
Breeding J., 1: 85-96.
How to cite this article:
Ajay Verma, J. Singh, V. Kumar, A.S. Kharab and Singh, G.P. 2017. Non Parametric Analysis
in Multi Environmental Trials of Feed Barley Genotypes. Int.J.Curr.Microbiol.App.Sci. 6(6):
1201-1210. doi: />
1210