MiR-107 and miR-99a-3p predict chemotherapy response in patients with advanced colorectal cancer
Bạn đang xem bản rút gọn của tài liệu. Xem và tải ngay bản đầy đủ của tài liệu tại đây (923.25 KB, 10 trang )
Molina-Pinelo et al. BMC Cancer 2014, 14:656
/>
RESEARCH ARTICLE
Open Access
MiR-107 and miR-99a-3p predict chemotherapy
response in patients with advanced colorectal
cancer
Sonia Molina-Pinelo1, Amancio Carnero1, Fernando Rivera2, Purificacion Estevez-Garcia1, Juan Manuel Bozada3,
Maria Luisa Limon4, Marta Benavent1, Javier Gomez5, Maria Dolores Pastor1, Manuel Chaves4, Rocio Suarez1,
Luis Paz-Ares1,4, Fernando de la Portilla6, Andres Carranza-Carranza1, Isabel Sevilla7, Luis Vicioso8 and
Rocio Garcia-Carbonero1,4*
Abstract
Background: MicroRNAs (miRNAs) are involved in numerous biological and pathological processes including
colorectal cancer (CRC). The aim of our study was to evaluate the ability of miRNA expression patterns to predict
chemotherapy response in a cohort of 78 patients with metastatic CRC (mCRC).
Methods: We examined expression levels of 667 miRNAs in the training cohort and evaluated their potential
association with relevant clinical endpoints. We identified a miRNA profile that was analysed by RT-qPCR in an
independent cohort. For a set of selected miRNAs, bioinformatic target predictions and pathway analysis were
also performed.
Results: Eight miRNAs (let-7 g*, miR-107, miR-299-5p, miR-337-5p, miR-370, miR-505*, miR-889 and miR-99a-3p)
were significant predictors of response to chemotherapy in the training cohort. In addition, overexpression of
miR-107, miR-337-5p and miR-99a-3p, and underexpression of miR-889, were also significantly associated with
improved progression-free and/or overall survival. MicroRNA-107 and miR-99a-3p were further validated in an
independent cohort as predictive markers for chemotherapy response. In addition, an inverse correlation was
confirmed in our study population between miR-107 levels and mRNA expression of several potential target
genes (CCND1, DICER1, DROSHA and NFKB1).
Conclusions: MiR-107 and miR-99a-3p were validated as predictors of response to standard fluoropyrimidine-based
chemotherapy in patients with mCRC.
Keywords: MicroRNAs, Advanced colorectal cancer, Chemotherapy response, Prediction
Background
Colorectal cancer (CRC) is one of the most common
malignant tumors worldwide [1]. Despite advances in early
detection, about one third of patients present metastatic
disease at diagnosis, and ~40% of those with early-stage
tumors eventually relapse at some point over the course
of the disease [2]. Systemic therapy is the mainstay of care
* Correspondence:
1
Instituto de Biomedicina de Sevilla (IBiS), Hospital Universitario Virgen del
Rocio/CSIC/Universidad de Sevilla, Manuel Siurot s/n, 41013 Seville, Spain
4
Department of Medical Oncology, Hospital Universitario Virgen del Rocio,
Avda. Manuel Siurot s/n, Sevilla, Spain
Full list of author information is available at the end of the article
for patients with metastatic CRC (mCRC) [3]. Several
combination regimens including fluoropyrimidines and
oxaliplatin and/or irinotecan, with or without monoclonal
antibodies targeting VEGF or EGFR, have been successfully developed and are associated with response rates of
40-60% and a median survival of 20–24 months [4-9].
Despite the undeniable progress achieved, still a considerable proportion of patients do not respond to therapy and
reliable tools to prospectively identify which patients are
more likely to benefit are needed.
Several driver mutations have been identified to be
relevant in CRC carcinogenesis [10,11]. The most commonly involved pathways include the Wnt/β-catenin,
© 2014 Molina-Pinelo et al.; licensee BioMed Central Ltd. This is an Open Access article distributed under the terms of the
Creative Commons Attribution License ( which permits unrestricted use,
distribution, and reproduction in any medium, provided the original work is properly credited. The Creative Commons Public
Domain Dedication waiver ( applies to the data made available in this
article, unless otherwise stated.
Molina-Pinelo et al. BMC Cancer 2014, 14:656
/>
TGF-β/BMP, TP53, receptor tyrosine kinase, KRAS and
PI3K signaling pathways [10]. Many of these proteins are
altered and seem to be affected by microRNA regulation.
In this sense, the miR-135 family may play an important
role in early CRC development as it down-regulates APC,
leading to activation of the Wnt/β-catenin pathway [12].
On the other hand, the lethal-7 (let-7) family of miRNAs
has been found to display tumor suppressor functions by
repressing translation of KRAS. Interestingly, patients
with KRAS-mutated CRC and high let-7 levels seem to
benefit from EGFR-targeted agents, suggesting that let-7
expression could potentially counteract resistance mediated by RAS activating mutations [13]. KRAS has been
also described to be a direct target of other miRNAs such
as miR-143, miR-146b-3p, miR-18a, and miR-486-5p
[14-17] and miR-126 has been implicated in PI3K signalling [18]. Other miRNAs known to be involved in CRC
pathogenesis affect epithelial differentiation (miR-141 and
miR-200c), WNT signaling (miR-145, miR-135a and miR135b), and migration and invasion (miR-21, miR-373 and
miR-520c) [19-22].
From a clinical perspective, several studies have identified groups of miRNAs with potential utility for early
diagnosis or prognostic stratification of CRC patients.
However, there are no robust studies to evaluate the potential ability of miRNA to predict response to selected
chemotherapy regimens. Based on these premises, the
purpose of this study was to evaluate the ability of miRNA
expression patterns to predict chemotherapy response in
patients with mCRC treated with fluoropyrimidine-based
standard chemotherapy regimens.
Methods
Patients and tumor samples
Patients that met the following inclusion criteria were
selected for the present study: (1) histologically confirmed diagnosis of primary CRC; (2) TNM stage IV; (3)
fluoropyrimidine-based first-line chemotherapy for advanced disease; (4) measurable disease per RECIST criteria; (5) adequate clinical data recorded in medical
charts; (6) adequate tissue specimen available (snapfrozen at −80°C with a proportion of tumor cells > 50%).
This study was approved by the ethics committees of
Hospital Universitario Virgen del Rocio (Sevilla), Hospital Marques de Valdecilla (Santander) and Hospital
Virgen de la Victoria (Malaga), and all patients provided
written informed consent prior to study entry.
Tumor tissue samples of 78 patients were collected at
the Hospital Universitario Virgen del Rocio (Sevilla), Hospital Marques de Valdecilla (Santander), Hospital Virgen
de la Victoria (Malaga) and Hospital de la Merced (Osuna).
Main characteristics of study population are summarized
in Table 1 and are representative of a standard metastatic
CRC population. The majority of patients (96%) were
Page 2 of 10
Table 1 Characteristics of study population
Training cohort Validation cohort
(N = 39)
(N = 39)
Age, years – median [range]
62 [54–70]
66 [61–72]
Male
23 (59.0%)
29 (74.4%)
Female
16 (41.0%)
10 (25.6%)
Adenocarcinoma
35 (89.7%)
39 (100%)
Mucinous adenocarcinoma
4 (10.3%)
-
Ox/FP regimens
30 (76.9%)
29 (74.3%)
Ir/FP regimens
7 (17.9%)
9 (23.1%)
FP monotherapy
2 (5.2%)
1 (2.6%)
Objective Response (CR, PR)
18 (46.2%)
24 (61.5%)
No Response (SD, PD)
21 (53.8%)
15 (38.5%)
Gender - N(%)
Histology of primary
tumor - N(%)
Chemotherapy regimen - N(%)
Response to
chemotherapy - N(%)
Survival, months – median
[range]
Progression-free survival
12.2 [6.3-18.9]
11.6 [8.6-18.3]
Overall survival
24.6 [15.8-37.2]
21.5 [13.3-31.1]
Continuous variables are expressed as median [interquartile range (IQR)] and
categorical variables as number of cases (%). Ox: oxaliplatin; FP:
fluoropyrimidine; Ir: Irinotecan. CR: complete response; PR: partial response;
SD: stable disease; PD: progressive disease.
treated with a chemotherapy regimen that included fluoropyrimidines and either oxaliplatin (76%) or irinotecan
(20%). The patient population was divided in a training
cohort (N = 39) that was used for miRNA profile development and an independent validation cohort (N = 39).
Clinical outcome variables and statistical analysis
Descriptive statistics were used to characterize the most
relevant clinical parameters. The association of categorical variables was explored by the chi-squared test or
Fisher’s exact test. To assess distribution of continuous
variables among study groups parametric (t-test) or nonparametric tests (Kruskal-Wallis or Mann–Whitney tests)
were employed when appropriate.
Tumor response was evaluated by conventional methods
according to the standard RECIST 1.0 criteria: a complete
response (CR) was defined as the disappearance of all
measurable and evaluable evidence of disease; a partial response (PR) was defined as a ≥ 30% decrease in the sum of
the longest diameters of target lesions; stable disease (SD)
was considered if the tumor burden decreased less than
30% or increased less than 20%; and progressive disease
(PD) was indicated by a >20% increase in the sum of the
longest diameters of target lesions or the appearance of
any new lesion. Patients were classified according to
Molina-Pinelo et al. BMC Cancer 2014, 14:656
/>
best response to chemotherapy in two groups: those
that achieved an objective response (Responders [R]:
CR + PR) and those that did not (Non-responders [NR]:
SD + PD). Progression Free Survival (PFS) was defined
as the time elapsed from the date of initiation of firstline chemotherapy to the date of the first documented
evidence of disease progression. Overall survival (OS)
was calculated from the start of therapy for advanced
disease to the date of death from any cause. The KaplanMeier product limit method was used to estimate
time-dependent variables (PFS and OS), and differences
observed among patient subgroups were assessed by the
log rank test. Multivariate analyses were performed using
the Cox proportional hazards model. P < 0.05 was considered significant. All analyses were performed using the
Statistical Package for the Social Sciences software (SPSS
17.0 for Windows; SPSS Inc, Chicago, IL).
RNA isolation and miRNA qRT-PCR assay
Total RNA, containing small RNA, was extracted from
tumor tissue samples by mirVana miRNA isolation kit
(Ambion, Austin, TX, USA) according to the manufacturer’s instructions. Mature human miRNA expression
was detected and quantified using the TaqMan® Low
Density Arrays (TLDA) based on Applied Biosystems’
7900 HT Micro Fluidic Cards (Applied Biosystems, CA,
USA) following instructions provided by the manufacturer. The Human MicroRNA Card Set v2.0 array is a
two card set containing a total of 384 TaqMan® MicroRNA Assays per card to enable accurate quantification
of 667 human microRNAs, all catalogued in the miRBase database. TLDAs were performed in a two-step
process, as previously described [23].
Eight miRNAs (let-7 g*, miR-107, miR-299-5p, miR337-5p, miR-370, miR-505*, miR-889 and miR-99a-3p),
which were selected because their expression in the Taqman
Low Density Array card assays was significantly associated
with response to chemotherapy and clinical outcome, were
further analyzed in an independent validation cohort by
qPCR. For this, RNA was reverse transcribed to cDNA
using TaqMan® MicroRNA Assays (Applied Biosystems,
CA, USA). Ten ng of total RNA were reverse transcribed
using the TaqMan miRNA reverse transcription kit in a total
volume of 15 μl, according to the manufacturer's protocol.
The reactions were incubated for 30 min at 16°C, 30 min at
42°C, and 5 min at 85°C, and then kept at 4°C. Thereafter,
1.33 μL of cDNA was used for TaqMan MicroRNA Assays.
The reactions were incubated at 95°C for 10 min, followed
by 40 cycles of 15 sec at 95°C and 1 min at 60°C. All experiments were performed in triplicate.
Page 3 of 10
miRNA control for RT-qPCR in the literature. One
non-human miRNA was used in each experiment as a
negative control. Finally, the cards were processed and
analyzed on an ABIPrism 7900 HT Sequence Detection
System. Cycle threshold (Ct) values were calculated with
the SDS software v.2.3 using automatic baseline settings
and a threshold of 0.2. Relative quantification of miRNA
expression was calculated by the 2−ΔΔCt method (Applied Biosystems user bulletin no.2 (P/N 4303859)).
MicroRNAs expression was computed using Real-Time
Statminer© software v.4.2 (Integromics, Inc). This software performs a moderate t-test between the groups
(R versus NR) and corrects them using the BenjaminiHochberg algorithm with the False Discovery Rate (FDR) set
at a value of 5%. For undetected miRNAs with Ct values beyond the maximum Ct 36, the StatMiner software imputed
a value set to the maximum Ct. For the purpose of this
study, significant miRNA expression was considered only
when miRNAs were detected in at least 50% of samples in
each group being compared. The raw and normalized TaqMan array data have been deposited in the Gene Expression
Omnibus under the accession number GSE48664.
Experimentally verified mRNA by previous research were
determined using the web-accessible information resource
miRWalk [24]. We then validated 9 potential target genes
according to expression levels of mir-107 by Taqman realtime RT-PCR assay (Applied Biosystems, CA, USA). Expression of miR-107 was normalized to the expression of
MammU6. Pearson's correlation coefficient was used to
assess the linear association of miRNA and target mRNA
expression (SPSS 17.0 for Windows; SPSS Inc, Chicago, IL).
3′-UTR reporter assay for miR target validation
Confirmation of miR-107-binding to the 3′-UTR of CCDN1.
HEK 293 cells at 80% confluency were co-transfected with
luciferase reporter plasmids harboring the complete 3′-UTR
of the desired gene (SwitchGear Genomics) along with
100nM of miR107-mimic or miRNA control (Sigma).
DharmaFECT Duo (Thermo Scientific) was used as the
transfection reagent in Opti-MEM (Life Technologies).
Luminescence was assayed 24 hours later using LightSwitch Assay Reagents (SwitchGear Genomics) according to the manufacturer's instructions. Knockdown
was assessed by calculating luciferase signal ratios for
specific miRNA/non-targeting control, using empty
reporter vector as control for non-specific effects. Each
experiment was performed in triplicate
Results
Analysis of miRNA expression profiles
MicroRNA profile development
MicroRNA expression patterns according to objective
response to chemotherapy
Expression of target miRNAs was normalized to the expression of MammU6, the most widely-used endogenous
The relative miRNA expression levels for patients that
achieved an objective response to chemotherapy (R) versus
Molina-Pinelo et al. BMC Cancer 2014, 14:656
/>
Page 4 of 10
those that did not (NR) are represented in Additional file 1:
Figure S1. Of the 667 miRNAs assessed, 7% (N = 46) were
differentially expressed (p < 0.05) among these two subgroups described (R versus NR). However, only eight of
these 46 miRNAs were detected in at least 50% of tested
samples (let-7 g*, miR-107, miR-299-5p, miR-337-5p,
miR-370, miR-505*, miR-889 and miR-99a-3p) (Table 2),
and were therefore considered to be representative of the
general behaviour of the study population.
Impact of selected miRNAs expression on progression free
and overall survival
These selected miRNAs able to predict response to
chemotherapy were further assessed to evaluate their
potential association with progression free survival (PFS)
and overall survival (OS) of patients. Overall, median
PFS was 13.6 months [range: 8.8-21.2] and median OS
was 25.6 months [range: 17.1-39.3], consistent with survival data reported in the literature for this patient population. Kaplan-Meier estimates for PFS and OS according to
miRNA expression levels grouped as above or below the
median are shown in Figure 1A and B, respectively. Among
tested miRNAs, expression of miR-107, miR-337-5p and
miR-99a-3p was significantly associated with both PFS and
OS (p < 0.05), while that of miR-889 was only associated
with OS (p < 0.05). In addition, a trend of borderline
significance was observed for miR-370 with OS (p = 0.094).
Multivariate analyses confirmed miR-107, miR-337-5p
and miR-99a-3p as independent predictive factors for PFS.
Regarding overall survival, only miR-889, together with
age and sex retained independent prognostic significance
in the Cox multiple regression model (Table 3).
Independent validation
As depicted in Figure 2, miRNA expression patterns in
this validation cohort were consistent with those quantified in the training cohort, in the sense that similar
Table 2 Differently expressed miRNAs by objective
response to chemotherapy (Training Cohort)
MicroRNAs
R vs NR (−ΔΔCt)
Adjusted p-values*
let-7 g*
0.863
0.042
miR-107
0.706
0.042
miR-299-5p
0.864
0.006
miR-337-5p
0.952
0.018
miR-370
1.162
< 0.001
miR-505*
0.877
0.006
miR-889
−0.560
0.042
miR-99a-3p
0.715
0.016
R – responders to chemotherapy (complete or partial response); NR – non-responders
to chemotherapy (stable or progressive disease) (RECIST criteria).
*p values adjusted for multiple testing by Benjamini-Hochberg method. The
bold value indicates a statistically significant result.
association trends were observed between over- or
under-expression of miRNAs and response to therapy.
However, this association only achieved statistical significance for miR-107 and miR-99a-3p, with higher expression levels in mCRC patients that achieved an objective
response to chemotherapy as compared to those that did
not (p = 0.026 and p = 0.027, respectively).
MicroRNA target prediction
A bioinformatic approach was used to identify experimentally verified target mRNAs of the validated miRNAs in
our series, miR-107 and miR-99a-3p. However, whereas a
number of genes have been experimentally validated to
date for miR-107, none were identified for miR-99a-3p.
Among the former, 9 of the miR-107 potential target
genes were selected for further validation in our cohort,
including genes involved in the PI3K/Akt signaling pathway and in the RNA-interference processing machinery.
MicroRNA-107 target genes assessed were AKT1 (v-akt
murine thymoma viral oncogene homolog 1), CCND1
(cyclin D1), COX8A (cytochrome c oxidase subunit
VIIIA), DICER1 (dicer 1, ribonuclease type III), DROSHA
(drosha, ribonuclease type III), FASN (fatty acid synthase),
FBXW7 (F-box and WD repeat domain containing 7),
NFKB1 (nuclear factor of kappa light polypeptide gene
enhancer in B-cells 1), and TP53 (tumor protein p53). As
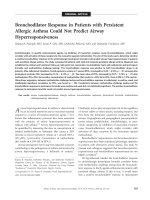
depicted in Figure 3, an inverse correlation was observed
between these nine mRNAs and miR-107 expression
levels, being this correlation significant for CCND1,
DICER1, DROSHA and NFKB1. Therefore, in individual
tumor samples, higher levels of miR-107 were associated
with lower levels of these targets. Subsequently, CCDN1
target was quantified using luciferase reporter gene assays.
We observed that overexpression of miR-107 in HEK 293
cells significantly down-regulated the luciferase activity
of reporter construct containing the CCDN1 3′-UTR
(Figure 4). This data indicate that miR-107 binds directly
to this target RNA and inhibits its expression, further
supporting a potential role for miR-107 in the regulation
of these genes.
Discussion
In this study, we have evaluated global miRNA expression
patterns in mCRC patients treated with fluoropyrimidinebased standard chemotherapy regimens. We identified
eight miRNAs (let-7 g*, miR-107, miR-299-5p, miR-3375p, miR-370, miR-505*, miR-889 and miR-99a-3p), the
expression of which was significantly associated with
response to chemotherapy. In addition, overexpression
of miR-107, miR-337-5p and miR-99a-3p, and underexpression of miR-889, were also significantly associated
with improved progression-free and/or overall survival.
Moreover, miR-107 and miR-99a-3p were further validated in an independent cohort as predictive markers
Molina-Pinelo et al. BMC Cancer 2014, 14:656
/>
Page 5 of 10
Figure 1 Training cohort: Clinical outcome of patients by miRNA expression levels. (A) Progression-free survival (PFS) and (B) Overall survival.
The solid red line represents patients with higher miRNA expression levels (above the median). The solid green line represents patients with lower
miRNA expression levels.
Molina-Pinelo et al. BMC Cancer 2014, 14:656
/>
Page 6 of 10
Table 3 Univariate and multivariate analysis of predictive miRNA for PFS and OS in metastatic colorectal cancer
patients (Training Cohort)
VARIABLES
PFS
Univariate Analysis
OS
Multivariate Analysis
Univariate Analysis
Mutivariate Analysis
HR (95% CI)
p-value
HR (95% CI)
p-value
HR (95% CI)
p-value
HR (95% CI)
p-value
Age
0.99 [0.95-1.02]
0.357
0.99 [0.95-1.04]
0.765
1.01 [0.96-1.05]
0.746
1.06 [1.01-1.12]
0.027
Sex
0.51 [0.24-1.07]
0.069
0.60 [0.26-1.40]
0.232
0.42 [0.16-1.10]
0.069
0.17 [0.05-0.54]
0.003
miR-107
2.12 [1.05-4.29]
0.043
2.52 [1.18-5.42]
0.017
2.65 [1.06-6.67]
0.035
2.61 [0.86-7.92]
0.091
miR-337-5p
2.27 [1.12-4.58]
0.018
3.02 [1.34-6.83]
0.008
2.53 [0.95-6.80]
0.018
1.40 [0.42-4.69]
0.584
miR-99a-3p
2.34 [1.11-4.93]
0.030
2.50 [1.00-6.05]
0.050
3.46 [1.26-9.53]
0.008
1.99 [0.62-6.36]
0.243
miR-889
0.45 [0.22-0.94]
0.073
0.40 [0.16-0.90]
0.027
0.26 [0.10-0.71]
0.017
0.15 [0.04-0.47]
0.001
PFS: progression free survival; OS: overall survival; CI: confidence interval; HR: Hazard Ratio.
The bold value indicates a statistically significant result.
Figure 2 Validation cohort: Median ΔCt values of validated miRNAs in patients with objective response to chemotherapy responders
versus non-responders. *p-value < 0.05. Data derived from RT-qPCR are presented as ΔCt values, with higher values standing for lower
miRNA-expression. R: Responders; NR: Non-Responders.
Molina-Pinelo et al. BMC Cancer 2014, 14:656
/>
Page 7 of 10
Figure 3 Negative correlation between several potential target genes and miR-107 expression.
for chemotherapy response. This is to our knowledge
the first study to assess the predictive role of miRNA
expression profiles in patients with advanced CRC treated
with fluoropyrimidines in combination with either oxaliplatin (77%) or irinotecan (18%), the most commonly used
chemotherapy regimens in the treatment of this
disease.
Altered miR-107 expression has been involved in several
cancer types, including head and neck squamous cell carcinoma (HNSCC), ovarian, gastric or breast cancer, among
others [25-27]. Our results have demonstrated that expression of this miRNA significantly influences sensitivity to
fluoropyrimidine-based chemotherapy in patients with
advanced colorectal cancer. miR-107 transcription is
induced by p53 and it seems to function as a tumor
suppressor gene in HNSCC cell lines through downregulation of protein kinase Cε (PKCε) [25]. PKCε is elevated in HNSCC and has been associated with a more
aggressive phenotype [28]. Consistent with this, other
groups have reported a tumor suppressor function for
miR-107 in other cancer models including bladder, colon
and pancreatic cancer. With regard to human colon cancer, miR-107 has been shown to regulate tumor angiogenesis by targeting hypoxia inducible factor-1β (HIF-1β)
[29]. Indeed, overexpression of miR-107 in HCT116 colon
cancer cells suppressed angiogenesis, tumor growth and
Molina-Pinelo et al. BMC Cancer 2014, 14:656
/>
Page 8 of 10
TP53 are involved in several key pathways relevant to
cancer such as the PI3K/Akt pathway and the miRNAprocessing machinery [34-39]. As expected, we confirmed
in individual tumor samples of our patients an inverse
correlation of these target mRNA and miR-107 expression
levels, being this correlation significant for CCND1, DICER1,
DROSHA and NFKB1. These results may be considered a
further validation of the functional role of miR-107 in the
transcriptional regulation of these key genes in cancer.
Figure 4 3′-UTR reporter assay for miR target validation. HEK
293 cells were transfected with luciferase reporter vector
containing the 3′-UTR region of CCDN1. Reporter vectors were
co-transfected with a miR-107 mimic or control miRNA mimic (miR NC).
Following 24 h incubation, luciferase activity was measured.
tumor VEGF expression in mice. Decreased tumor angiogenesis induced by miR-107 may make tumor cells more
vulnerable to a variety of cellular insults including genotoxic stress induced by DNA-damaging agents (i.e. conventional cytotoxic chemotherapy). In fact, antiangiogenic drugs
such as the VEGF-targeting agents bevacizumab or aflibercept have demonstrated to be synergistic in combination
with fluoropyrimidine-based chemotherapy in patients
with advanced colorectal cancer. Moreover, other authors
have shown that, compared with wild type tumors, tumors
that lack HIF-1α are poorly vascularized but are faster
growing, perhaps because of a loss of dependency upon
neovascularization. These findings would be consistent
with the increased response rate and improved prognosis
observed in our series for patients over-expressing miR107 [30,31]. In addition, overexpression of miR-107 has
been recently shown in gastric cancers in comparison with
normal tissue, and up-regulation of these miRNA increased the proliferation of gastric cancer cells [32]. In
colon cancer models some authors have reported that
miR-103/107 may promote metastasis by targeting the
metastasis suppressors DAPK and KLF4 [33]. They also
found that, in the clinical setting, the signature of a miR103/107 high, DPAK and KLF4 low expression profile
correlated with the extent of lymph node and distant metastasis. However, no information was provided this study
regarding relevant characteristics of the patient population
such as stage of disease or therapeutic interventions. The
discrepancies observed related to miR-103/107 function could be attributed to tissue- or context–specific
effects, or may simply reflect the great complexity
governing intra- and inter-cellular signaling networks.
On the other hand, the precise role in cancer of the
other validated miRNA in our series, miR-99a-3p,
remain greatly unknown to date.
To explore the potential biological function of miR-107,
we then identified validated targets using the computational prediction algorithm from miRWalk [24]. AKT1,
CCND1, DICER1, DROSHA, FASN, FBXW7, NFKB1 and
Conclusions
Our study has identified that miR-107 and miR-99a-3p
may be used to predict response to therapy with standard fluoropyrimidine-based chemotherapy regimens in
patients with mCRC. These results underline the great
potential of miRNAs as novel biomarkers for personalized treatment strategies and also as potential therapeutic targets. Moreover, given the fact that CRC cells
may release aberrantly expressed miRNAs into peripheral blood, miRNA profiling could also have a great
potential as a minimally-invasive tool for prediction or
monitoring of therapeutic outcome.
Additional file
Additional file 1: Figure S1. Volcano plot of differentially expressed
miRNAs among responders versus non-responders to chemotherapy. The
log2 of fold change is represented on the x-axis and the negative log of
p-values from the t-test is represented on the y-axis. Dots above the dashed
line have a p-value < 0.05 and points below that line have a p-value > 0.05.
Competing interests
The authors declare that they no competing interests.
Authors’ contributions
SM-P and RGC are guarantors of the paper, taking responsibility for the
integrity of the work as a whole, from inception to published article. SM-P,
AC, and RG-C have contributed to study design, data analysis and interpretation,
drafting and revising the manuscript critically for important intellectual content.
FR, PE-G JMB, MLL, MB, JG, MDP, MC, RS, LP-A, FP, AC-C, IS, and LV have
contributed to acquisition of data. All authors read and approved the final
manuscript.
Acknowledgments
RGC is funded by Fondo de Investigación Sanitaria (PI10/02164), Servicio
Andaluz de Salud (PI-0259/2007) and RTICC (R12/0036/0028). SM-P is funded
by Fondo de Investigación Sanitaria (CD1100153) and Fundación Científica
de la Asociación Española Contra el Cáncer. MDP is funded by Fondo de
Investigación Sanitaria (CD0900148). AC lab was supported by grants to from
the Spanish Ministry of Economy and Competitivity, ISCIII (Fis: PI12/00137,
RTICC: RD12/0036/0028), Consejeria de Ciencia e Innovacion (CTS-6844) and
Consejeria de Salud of the Junta de Andalucia (PI-0135-2010 and PI-0306-2012).
The authors thank the donors and the Andalusian Public Health System Biobank
Network (ISCIII-Red de Biobancos RD09/0076/00085) for the human tumor
specimens provided for this study.
Author details
1
Instituto de Biomedicina de Sevilla (IBiS), Hospital Universitario Virgen del
Rocio/CSIC/Universidad de Sevilla, Manuel Siurot s/n, 41013 Seville, Spain.
2
Department of Medical Oncology, Hospital Marqués de Valdecilla, Avda.
Valdecilla s/n, Santander, Spain. 3Department of Gastroenterology, Hospital
Universitario Virgen del Rocio, Avda. Manuel Siurot s/n, Sevilla, Spain.
Molina-Pinelo et al. BMC Cancer 2014, 14:656
/>
4
Department of Medical Oncology, Hospital Universitario Virgen del Rocio,
Avda. Manuel Siurot s/n, Sevilla, Spain. 5Department of Pathology, Hospital
Marqués de Valdecilla, Avda. Valdecilla s/n, Santander, Spain. 6Department of
Surgery, Hospital Universitario Virgen del Rocio, Avda. Manuel Siurot s/n,
Sevilla, Spain. 7Department of Medical Oncology, Hospital Virgen de la
Victoria, Lugar Arroyo Teatinos s/n, Malaga, Spain. 8Department of Pathology,
Hospital Virgen de la Victoria, Lugar Arroyo Teatinos s/n, Malaga, Spain.
Page 9 of 10
15.
16.
Received: 3 February 2014 Accepted: 20 August 2014
Published: 7 September 2014
17.
References
1. Jemal A, Bray F, Center MM, Ferlay J, Ward E, Forman D: Global cancer
statistics. CA Cancer J Clin 2011, 61(2):69–90.
2. Parkin DM: International variation. Oncogene 2004, 23(38):6329–6340.
3. Andre T, Boni C, Navarro M, Tabernero J, Hickish T, Topham C, Bonetti A,
Clingan P, Bridgewater J, Rivera F, de Gramont A: Improved overall
survival with oxaliplatin, fluorouracil, and leucovorin as adjuvant
treatment in stage II or III colon cancer in the MOSAIC trial. J Clin Oncol
2009, 27(19):3109–3116.
4. de Gramont A, Figer A, Seymour M, Homerin M, Hmissi A, Cassidy J, Boni C,
Cortes-Funes H, Cervantes A, Freyer G, Papamichael D, Le Bail N, Louvet C,
Hendler D, de Braud F, Wilson C, Morvan F, Bonetti A: Leucovorin and
fluorouracil with or without oxaliplatin as first-line treatment in advanced
colorectal cancer. J Clin Oncol 2000, 18(16):2938–2947.
5. Cunningham D, Sirohi B, Pluzanska A, Utracka-Hutka B, Zaluski J, Glynne-Jones R,
Koralewski P, Bridgewater J, Mainwaring P, Wasan H, Wang JY, Szczylik C, Clingan P,
Chan RT, Tabah-Fisch I, Cassidy J: Two different first-line 5-fluorouracil regimens
with or without oxaliplatin in patients with metastatic colorectal cancer.
Ann Oncol 2009, 20(2):244–250.
6. Douillard JY, Cunningham D, Roth AD, Navarro M, James RD, Karasek P,
Jandik P, Iveson T, Carmichael J, Alakl M, Gruia G, Awad L, Rougier P:
Irinotecan combined with fluorouracil compared with fluorouracil alone
as first-line treatment for metastatic colorectal cancer: a multicentre
randomised trial. Lancet 2000, 355(9209):1041–1047.
7. Saltz LB, Cox JV, Blanke C, Rosen LS, Fehrenbacher L, Moore MJ, Maroun JA,
Ackland SP, Locker PK, Pirotta N, Elfring GL, Miller LL: Irinotecan plus
fluorouracil and leucovorin for metastatic colorectal cancer. Irinotecan
Study Group. N Engl J Med 2000, 343(13):905–914.
8. Garcia-Carbonero R, Gomez Espana MA, Casado Saenz E, Alonso Orduna V,
Cervantes Ruiperez A, Gallego Plazas J, Garcia Alfonso P, Juez Martel I,
Gonzalez Flores E, Lomas Garrido M, Isla Casado D: SEOM clinical guidelines
for the treatment of advanced colorectal cancer. Clin Transl Oncol 2010,
12(11):729–734.
9. Aranda E, Abad A, Carrato A, Cervantes A, Garcia-Foncillas J, Garcia Alfonso P,
Garcia Carbonero R, Gomez Espana A, Tabernero JM, Diaz-Rubio E: Treatment
recommendations for metastatic colorectal cancer. Clin Transl Oncol 2011,
13(3):162–178.
10. Sjoblom T, Jones S, Wood LD, Parsons DW, Lin J, Barber TD, Mandelker D,
Leary RJ, Ptak J, Silliman N, Szabo S, Buckhaults P, Farrell C, Meeh P,
Markowitz SD, Willis J, Dawson D, Willson JK, Gazdar AF, Hartigan J, Wu L,
Liu C, Parmigiani G, Park BH, Bachman KE, Papadopoulos N, Vogelstein B,
Kinzler KW, Velculescu VE: The consensus coding sequences of human
breast and colorectal cancers. Science 2006, 314(5797):268–274.
11. Wood LD, Parsons DW, Jones S, Lin J, Sjoblom T, Leary RJ, Shen D, Boca SM,
Barber T, Ptak J, Silliman N, Szabo S, Dezso Z, Ustyanksky V, Nikolskaya T,
Nikolsky Y, Karchin R, Wilson PA, Kaminker JS, Zhang Z, Croshaw R, Willis J,
Dawson D, Shipitsin M, Willson JK, Sukumar S, Polyak K, Park BH,
Pethiyagoda CL, Pant PV, et al: The genomic landscapes of human breast
and colorectal cancers. Science 2007, 318(5853):1108–1113.
12. Nagel R, le Sage C, Diosdado B, van der Waal M, Oude Vrielink JA, Bolijn A,
Meijer GA, Agami R: Regulation of the adenomatous polyposis coli gene by
the miR-135 family in colorectal cancer. Cancer Res 2008, 68(14):5795–5802.
13. Ruzzo A, Graziano F, Vincenzi B, Canestrari E, Perrone G, Galluccio N,
Catalano V, Loupakis F, Rabitti C, Santini D, Tonini G, Fiorentini G, Rossi D,
Falcone A, Magnani M: High Let-7a MicroRNA levels in KRAS-mutated
colorectal carcinomas May rescue anti-EGFR therapy effects in patients with
chemotherapy-refractory metastatic disease. Oncologist 2012, 17(6):823–829.
14. Ragusa M, Majorana A, Statello L, Maugeri M, Salito L, Barbagallo D,
Guglielmino MR, Duro LR, Angelica R, Caltabiano R, Biondi A, Di Vita M,
Privitera G, Scalia M, Cappellani A, Vasquez E, Lanzafame S, Basile F, Di Pietro C,
18.
19.
20.
21.
22.
23.
24.
25.
26.
27.
28.
29.
30.
31.
32.
33.
34.
Purrello M: Specific alterations of microRNA transcriptome and global
network structure in colorectal carcinoma after cetuximab treatment.
Mol Cancer Ther 2010, 9(12):3396–3409.
Johnson SM, Grosshans H, Shingara J, Byrom M, Jarvis R, Cheng A, Labourier E,
Reinert KL, Brown D, Slack FJ: RAS is regulated by the let-7 microRNA family.
Cell 2005, 120(5):635–647.
Chen X, Guo X, Zhang H, Xiang Y, Chen J, Yin Y, Cai X, Wang K, Wang G, Ba Y,
Zhu L, Wang J, Yang R, Zhang Y, Ren Z, Zen K, Zhang J, Zhang CY: Role of
miR-143 targeting KRAS in colorectal tumorigenesis. Oncogene 2009,
28(10):1385–1392.
Tsang WP, Kwok TT: The miR-18a* microRNA functions as a potential
tumor suppressor by targeting on K-Ras. Carcinogenesis 2009, 30(6):953–959.
Guo C, Sah JF, Beard L, Willson JK, Markowitz SD, Guda K: The noncoding
RNA, miR-126, suppresses the growth of neoplastic cells by targeting
phosphatidylinositol 3-kinase signaling and is frequently lost in colon
cancers. Genes Chromosomes Cancer 2008, 47(11):939–946.
Burk U, Schubert J, Wellner U, Schmalhofer O, Vincan E, Spaderna S, Brabletz T:
A reciprocal repression between ZEB1 and members of the miR-200 family
promotes EMT and invasion in cancer cells. EMBO Rep 2008, 9(6):582–589.
Huang Q, Gumireddy K, Schrier M, le Sage C, Nagel R, Nair S, Egan DA, Li A,
Huang G, Klein-Szanto AJ, Gimotty PA, Katsaros D, Coukos G, Zhang L, Puré E,
Agami R: The microRNAs miR-373 and miR-520c promote tumour invasion
and metastasis. Nat Cell Biol 2008, 10(2):202–210.
Slaby O, Svoboda M, Michalek J, Vyzula R: MicroRNAs in colorectal cancer:
translation of molecular biology into clinical application. Mol Cancer 2009, 8:102.
Slaby O, Svoboda M, Fabian P, Smerdova T, Knoflickova D, Bednarikova M,
Nenutil R, Vyzula R: Altered expression of miR-21, miR-31, miR-143 and
miR-145 is related to clinicopathologic features of colorectal cancer.
Oncology 2007, 72(5–6):397–402.
Molina-Pinelo S, Suarez R, Pastor MD, Nogal A, Marquez-Martin E, Martin-Juan J,
Carnero A, Paz-Ares L: Association between the miRNA signatures in
plasma and bronchoalveolar fluid in respiratory pathologies.
Dis Markers 2012, 32(4):221–230.
Dweep H, Sticht C, Pandey P, Gretz N: miRWalk–database: prediction of
possible miRNA binding sites by "walking" the genes of three genomes.
J Biomed Inform 2011, 44(5):839–847.
Datta J, Smith A, Lang JC, Islam M, Dutt D, Teknos TN, Pan Q: microRNA-107
functions as a candidate tumor-suppressor gene in head and neck
squamous cell carcinoma by downregulation of protein kinase Cvarepsilon.
Oncogene 2011, 31(36):4045–4053.
Volinia S, Calin GA, Liu CG, Ambs S, Cimmino A, Petrocca F, Visone R, Iorio M,
Roldo C, Ferracin M, Prueitt RL, Yanaihara N, Lanza G, Scarpa A, Vecchione A,
Negrini M, Harris CC, Croce CM: A microRNA expression signature of human
solid tumors defines cancer gene targets. Proc Natl Acad Sci U S A 2006,
103(7):2257–2261.
Van der Auwera I, Limame R, van Dam P, Vermeulen PB, Dirix LY, Van
Laere SJ: Integrated miRNA and mRNA expression profiling of the
inflammatory breast cancer subtype. Br J Cancer 2010, 103(4):532–541.
Pan Q, Bao LW, Teknos TN, Merajver SD: Targeted disruption of protein
kinase C epsilon reduces cell invasion and motility through inactivation
of RhoA and RhoC GTPases in head and neck squamous cell carcinoma.
Cancer Res 2006, 66(19):9379–9384.
Yamakuchi M, Lotterman CD, Bao C, Hruban RH, Karim B, Mendell JT, Huso D,
Lowenstein CJ: P53-induced microRNA-107 inhibits HIF-1 and tumor
angiogenesis. Proc Natl Acad Sci U S A 2010, 107(14):6334–6339.
Carmeliet P, Dor Y, Herbert JM, Fukumura D, Brusselmans K, Dewerchin M,
Neeman M, Bono F, Abramovitch R, Maxwell P, Koch CJ, Ratcliffe P, Moons L,
Jain RK, Collen D, Keshert E: Role of HIF-1alpha in hypoxia-mediated apoptosis,
cell proliferation and tumour angiogenesis. Nature 1998, 394(6692):485–490.
Yu JL, Rak JW, Carmeliet P, Nagy A, Kerbel RS, Coomber BL: Heterogeneous
vascular dependence of tumor cell populations. Am J Pathol 2001,
158(4):1325–1334.
Li F, Liu B, Gao Y, Liu Y, Xu Y, Tong W, Zhang A: Upregulation of
MicroRNA-107 induces proliferation in human gastric cancer cells by
targeting the transcription factor FOXO1. FEBS Lett 2014, 588(4):538–544.
Chen RH, Chen HY, Lin YM, Chung HC, Lang YD, Lin CJ, Huang J, Wang WC,
Lin FM, Chen Z, Huang HD, Shyy JY, Liang JT, Chen RH: miR-103/107
promote metastasis of colorectal cancer by targeting the metastasis
suppressors DAPK and KLF4. Cancer Res 2012, 72(14):3631–3641.
Shimizu T, Tolcher AW, Papadopoulos KP, Beeram M, Rasco DW, Smith LS,
Gunn S, Smetzer L, Mays TA, Kaiser B, Wick MJ, Alvarez C, Cavazos A,
Molina-Pinelo et al. BMC Cancer 2014, 14:656
/>
35.
36.
37.
38.
39.
Page 10 of 10
Mangold GL, Patnaik A: The clinical effect of the dual-targeting strategy
involving PI3K/AKT/mTOR and RAS/MEK/ERK pathways in patients with
advanced cancer. Clin Cancer Res 2012, 18(8):2316–2325.
Leong S, Messersmith WA, Tan AC, Eckhardt SG: Novel agents in the
treatment of metastatic colorectal cancer. Cancer J 2010, 16(3):273–282.
Carnero A: Novel inhibitors of the PI3K family. Expert Opin Investig Drugs
2009, 18(9):1265–1277.
Carnero A: The PKB/AKT pathway in cancer. Curr Pharm Des 2010, 16(1):34–44.
Vivanco I, Sawyers CL: The phosphatidylinositol 3-Kinase AKT pathway in
human cancer. Nat Rev Cancer 2002, 2(7):489–501.
Paz-Ares L, Blanco-Aparicio C, Garcia-Carbonero R, Carnero A: Inhibiting
PI3K as a therapeutic strategy against cancer. Clin Transl Oncol 2009,
11(9):572–579.
doi:10.1186/1471-2407-14-656
Cite this article as: Molina-Pinelo et al.: MiR-107 and miR-99a-3p predict
chemotherapy response in patients with advanced colorectal cancer.
BMC Cancer 2014 14:656.
Submit your next manuscript to BioMed Central
and take full advantage of:
• Convenient online submission
• Thorough peer review
• No space constraints or color figure charges
• Immediate publication on acceptance
• Inclusion in PubMed, CAS, Scopus and Google Scholar
• Research which is freely available for redistribution
Submit your manuscript at
www.biomedcentral.com/submit