Multi-correlation between nematode communities and environmental variables in mangrove-shrimp ponds, Ca Mau province, southern Vietnam
Bạn đang xem bản rút gọn của tài liệu. Xem và tải ngay bản đầy đủ của tài liệu tại đây (1.12 MB, 15 trang )
ACADEMIA JOURNAL OF BIOLOGY 2020, 42(3): 15–29
DOI: 10.15625/2615-9023/v42n3.14546
MULTI-CORRELATION BETWEEN NEMATODE COMMUNITIES AND
ENVIRONMENTAL VARIABLES IN MANGROVE-SHRIMP PONDS,
CA MAU PROVINCE, SOUTHERN VIETNAM
Thai Thanh Tran1, Nguyen Thi My Yen1, Hoang Nghia Son1,2, Ngo Xuan Quang1,2,*
1
Institute of Tropical Biology, VAST, Vietnam
Graduate University of Science and Technology, VAST, Vietnam
2
Received 26 October 2019, accepted 28 July 2020
ABSTRACT
Multi-correlation between bio-indices of nematode communities and ecological parameters in
mangrove-shrimp farming ponds in Tam Giang commune, Nam Can District, Ca Mau Province,
Vietnam were investigated. In which, diversities of nematode communities and several
environmental variables in eight ponds were considered to process. Our findings underlined the
high diversity of nematode communities in mangrove-shrimp farming ponds compared to other
mangrove habitats. Nematode diversities provided more oppotunity in natural food for shrimp.
Single correlation analyses showed that the species richness index correlated significantly to
three variables (salinity, total organic carbon, and total nitrogen), the Margalef diversity index
correlated to two variables (salinity, total organic carbon), and the expected number of species
for 50 individuals index correlated with one variable (salinity). Results of multi-correlation
analyses between the nematode bio-indices and the environmental variables were completely
different from those of single-correlation analyses. In multi-correlation analyses, the species
richness and the Margalef diversity index correlated to two variables (salinity, total organic
carbon), Pielou’s evenness index and Hill indices correlated with dissolved oxygen, also the
Hurlbert index correlated to total organic carbon. Hence, it is necessary to pay attention to the
impact of complex interactions between the multi-environmental variables and nematode
communities. This research aims to explain the differences between single- and multi-correlation
for evaluation of the effects of environmental factors on nematodes as well as aquatic organisms.
Keywords: Aquaculture, aquatic ecology, benthic fauna, chemical water diversity, mangroves,
sediment.
Citation: Thai Thanh Tran, Nguyen Thi My Yen, Hoang Nghia Son, Ngo Xuan Quang, 2020. Multi-correlation
between nematode communities and environmental variables in mangrove-shrimp ponds, Ca Mau Province, Southern
Vietnam. Academia Journal of Biology, 42(3): 15–29. />*Corresponding author email:
©2020 Vietnam Academy of Science and Technology (VAST)
15
Thai Thanh Tran et al.
INTRODUCTION
The largest remaining area of mangrove
forest in Vietnam is situated in coastal
provinces and river mouths of Mekong Delta
which covers approximately 100,000 ha. The
Ca Mau Province has the largest area of
mangroves with over 58,285 ha, followed by
Tra Vinh (8,582 ha), Ben Tre (7,153 ha), Bac
Lieu (4,142 ha), and Soc Trang (2,943 ha)
(Truong & Do, 2018). Ca Mau mangroves are
very rich in biodiversity, containing 98 species
of mangroves (e.g. Rhizophora apiculata,
Kandelia obovata, Sonneratia caseolaris and
Avicennia alba) with R. apiculata being the
most abundant (Vu, 2004). Studies on aquatic
fauna indicated that Ca Mau mangroves have a
fauna of 46 species of fish, 25 species of
shrimps and 57 species of birds including 17
migratory species (Phan & Hoang, 1993). Also,
the Ca Mau mangroves had 28 species of
mammals belonging to 12 families, 5 species
are listed in Vietnam's Red Book, 1 species in
the IUCN’s Red Book (Ca Mau Province
Portal, 2013).
In 2017–2018, several studies were
conducted to determine the biodiversity of
aquatic organisms in mangrove-shrimp farming
ponds in Nam Can District, Ca Mau Province.
The phytoplankton communities contained 64
species belonging to four groups namely bluegreen algae, diatom, green algae and
dinoflagellates (Pham et al., 2017). Macrofauna
communities contained 22 species of 15
families belonging to 5 classes: Polychaeta,
Oligochaeta, Crustacea, Gastropoda, and
Bivalvia of 3 phyla: Annelida, Arthropoda and
Mollusca (Tran et al., 2017b). Tran et al.
(2017c) studied meiofauna assemblages in
mangrove-shrimp farming ponds in Ca Mau
Province and recorded 15 major taxa, including
Nematoda, Copepoda, Turbellaria, Polychaeta,
Oligochaeta,
Amphipoda,
Tardigrada,
Ostracoda,
Rotifera,
Sarcomastigophora,
Kinorhyncha,
Isopoda,
Halacaroidea,
Thermosbaenacea, and Cladocera.
The nematode communities consisted of 75
genera belonging to 24 families and 7 orders.
The density was quite high, ranging from 221 ±
122 (inds/10 cm2) to 7254 ± 5454 (inds/10
16
cm2) and the Shannon-Wiener index expressed
high diversity, ranging from 2.35 ± 1.02 to 3.61
± 0.24 (Tran et al., 2018c). Thus, nematode
communities of Ca Mau mangrove-shrimp
farming ponds (CMMSFP) could be
characterized by high biodiversity. Nematode
communities play a vital role in benthic
ecosystems processes. They form a crucial
component in benthic food webs with trophic
links between microfauna and larger fauna.
Main food sources of nematode
communities are organic detritus, bacteria and
benthic diatoms. In turn, nematode
communities can provide food for a number
of predators such as juvenile fish, shellfishes,
and also other nematodes (Liu et al., 2014).
Chong & Sasekumar (1981) found that the
white prawn Penaeus merguiensis is a
carnivore that feeds largely on nematodes and
other small organisms. Thus, nematode
communities can make a substantial
contribution as a food source for shrimps in
the CMMSFP. Also, nematode communities
play a vital role in the flow of nutrients,
materials, and energy in benthic and aquatic
ecosystems. Several studies showed that
mineralization of organic matter is enhanced
and stimulated by the presence of nematode
communities (Semprucci et al., 2013).
Ensuring
suitable
environmental
conditions for nematode communities is
essential to maintain their diversities and
densities, and to provide sufficient food
sources for shrimp in the CMMSFP. To
optimize this environment, interaction
between nematodes and environmental
variables should be analyzed. It is well known
that densities, diversities, distribution, and
functional properties of meiofauna (including
nematodes) could be affected by a number of
environmental variables such as salinity,
temperature, hydrodynamics, granulometrics,
dissolved oxygenation level, and food
availability (Ingels et al., 2011; Cai et al.,
2012; Ngo et al., 2013a; Zeppilli et al., 2013;
Górska et al., 2014). According to Tran et al.
(2018a),
diversities
of
meiofauna
communities in shrimp farm in the CMMSFP
showed significant positive correlation with
Multi-correlation between nematode communities
dissolved oxygen but significant negative
correlation with total organic carbon and total
nitrogen. Furthermore, abundances of the
genera Sabatieria and Terschellingia showed
significant positive correlation with total
organic carbon, total nitrogen, and depth. In
contrast, Desmodora, Halalaimus and
Ptycholaimellus showed negative correlation
with organic enrichment (Tran et al., 2018c).
However, these correlations were based on
single-correlation analyses, which were
designed to determine the impact of a single
quantitative
environmental
factor
on
nematode characteristics. While studies and
reviews on the single-correlation between
environmental variables and nematodes are
increasingly common, to date, few studies
have assessed the multi-correlation between
environmental variables and the nematode
characteristics. Differences between single- vs
multi-correlation analyses and the effects of
environmental variables on the nematode
characteristics needs to be investigated.
In this study, we provide (i) additional
information on the nematode bio-indices in the
CMMSFP and (ii) explore multi-factorial
interactions between the nematode bio-indices
and the environmental variables. Results
obtained in this study are valuable for
understanding
biodiversities
of
benthic
nematofauna and their complex interactions with
environmental variables in mangrove forest.
MATERIALS AND METHODS
Study location
The present study was carried out in eight
different stations in the CMMSFPs (P1–P8)
situated in the Tam Giang Commune, Nam
Can District, Ca Mau Province (Fig. 1).
Detailed information about the study area has
been described by Tran et al. (2018c).
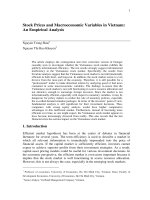
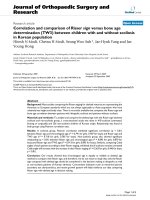
Figure 1. Map and ordinations of sampling stations in eight mangrove-shrimp farming ponds
in Tam Giang commune, Nam Can District, Ca Mau Province
Sampling and laboratory activities
Nematode communities in the CMMSFP
were investigated in three periods: March-dry
season, July-transient season and November-
rainy season of 2015. Nematode samples were
collected in triplicate using 10 cm2 cores with
3.5 cm in diameter, pushed in the sediment at
least 10 cm deep. Only samples with clear
overlying water with sediment depth up to 10
17
Thai Thanh Tran et al.
cm were retained. Sediment samples were
then
preserved
in
7%
neutralized
formaldehyde (heated to 60 oC). In the
laboratory, nematode specimens were
extracted from the sediment using a 1-mm
mesh upper sieve and a 38 μm mesh lower
sieve. The flotation technique using LudoxTM50 (specific gravity of 1.18) was applied
to separate the specimens from the sediment
(Vincx, 1996). To facilitate the sorting and
counting of nematodes under a stereomicroscope, the samples were further stained
with 1% Rose Bengal solution. About 100
nematodes from each sample (if the sample
consists of less than 100, all nematodes in that
sample) were picked out randomly and
specimens were processed and mounted on
permanent slides for identification (De Grisse,
1969). Nematodes were identified to genus
level according to Platt & Warwick (1983,
1988), Warwick et al. (1988), Zullini (2005),
Nguyen (2007) and the NEMYS database of
the Marine Biology Section, Ghent
University, Belgium (Bezerra et al., 2018)
(www.nemys.ugent.be).
Furthermore, data and methods of
sampling of sediment characteristics such as
depth (Dep, cm), dissolved oxygen (DO,
mg/l), salinity (Sal, ‰), pH, Fe2+ (mg/100 g),
Fe3+ (mg/100 g), total organic carbon (TOC,
%), and total nitrogen (TN, %) followed those
described by Tran et al. (2018a).
Data analyses
All data of nematode communities was
presented as an average ± standard deviation.
The following bio-indices: genera richness
(S), Margalef diversity index (d), Pielou's
evenness index (J’), the expected number of
species at Hurlbert’s index (ES(50)), and Hill
indices (N1, N2, and Ninf) were used as
biodiversity
measures
for
nematode
communities. The software Primer v.6.1.6
was used to calculate the diversity indices.
Non-parametric
Spearman’s
rank
correlation coefficient was used to identify the
correlation between the environmental
variables and the nematode bio-indices (S, d,
J’, ES(50), N1, N2, and Ninf). A regression
18
procedure was applied to construct a statistical
model describing the multi-correlation of the
multi-quantitative variables (Dep, Sal, pH,
Fe2+, Fe3+, TOC, and TN) on a dependent
variable (nematode bio-indices). Moreover, a
two-way ANOVA test was carried out to
compare the attributes of the nematode
communities between seasons and ponds.
Tukey’s honestly significant difference (Tukey
HSD) multiple range test was used when a
significant difference (p < 0.05) was detected
in two-way ANOVA tests. All statistical
analysis was performed using the software
Statgraphic Centurion XV version 15.1.02.
RESULTS
The nematode bio-indices in the mangroveshrimp farming pond
Composition and densities of nematode
communities in CMMSFP have been
described in details by Tran et al. (2018c).
The lowest biodiversity value was observed at
the dry season in P1 and P2, whereas the
highest biodiversity value was observed at the
dry season in other ponds (except for Hill
indices in P3, P4, and P6). The nematode
biodiversity decreased gradually from the dry
season to the rainy season (except for ES(50)
in P4, Hill indices in P3, P4, and P6). More
specifically, the average species richness
index (S) ranged from 13.33 ± 0.62 (P1) to
21.33 ± 0.77 (P6) in the dry season, from
16.33±0.83 (P7) to 21.00 ± 0.76 (P6) in the
transient season, and from 11.33 ± 0.65 (P7)
to 17.33 ± 0.82 (P6) in the rainy season (Fig.
2A). The diversity of nematode communities
measured by the Margalef diversity index (d)
ranged from 2.35 ± 1.13 (P1) to 4.32 ± 0.32
(P6) in the dry season, ranging from 3.20 ±
1.46 (P7) to 4.25 ± 0.66 (P6) in the transient
season and from 2.20 ± 1.50 (P7) to 3.65 ±
0.48 (P6) in the rainy season (Fig. 2B). The
Pielou’s evenness index (J’) ranged from 0.62
± 0.18 (P1) to 0.83 ± 0.06 (P5) in the dry
season but was higher in the transient and
rainy seasons, ranging from 0.71 ± 0.05 (P7)
to 0.85 ± 0.15 (P3) and from 0.65 ± 0.16 (P7)
to 0.85 ± 0.03 (P3), respectively (Fig. 2C).
The ES(50) index showed a trend similar to
Multi-correlation between nematode communities
other indices (S, d, J’ index). ES(50) value
was highest in the dry season (except for P1
and P2), and gradually decreased from the dry
season to the rainy season (except for P6)
(Fig. 2D). Regarding Hill indices, P1, P2, P3,
P4, P5, and P6 showed the highest value
during the sampling period, whereas P7
showed the lowest value (Figs. 2E–2D).
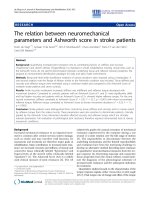
Figure 2. Average and standard deviation of different nematode bio-indices for eight different
ponds (P1–P8) during the dry season (DS), transient season (TS), and the rainy season (RS)
Two-way ANOVA test was carried out to
compare the biodiversity indices (S, d, J’,
ES(50) and Hill indices) between seasons
and ponds. Results indicated that seasonal
factors and the factor interaction between
seasons and ponds (season*pond) have no
statistically significant effect on any indexes.
In contrast, the pond factor showed
statistically significant effect on S, d, ES(50),
and N1 index (Table 1).
Table 1. The p value of the two - way ANOVA for the nematode bio-indices
S
d
J’
ES(50)
N1
N2
Ninf
Season
0.10 0.14 0.68
0.36
0.78 0.98 0.87
Pond
0.01 0.02 0.17
0.02
0.02 0.06 0.09
Season*Pond
0.62 0.61 0.08
0.31
0.17 0.22 0.27
Tukey HSD tests with a multiple
comparison procedure were used to check
whether the nematode bio-indices were
significantly
different
between
seasons/ponds. With this method, there was a
5.0% risk of calling one or more pairs
significantly different when their actual
difference equaled 0. Figs. 3–4 showed the
means of the nematode bio-indices with their
95% Tukey HSD intervals. For each index,
there was no statistically significant
difference between seasons (Fig. 3).
Compared to the biodiversity indices
between ponds, there were significant
differences for S, d, ES(50), and N1 indices
between P6 and P7 (Fig. 4).
19
Thai Thanh Tran et al.
Figure 3. Tukey HSD multiple range tests for nematode community attributes (factor seasons)
Figure 4. Tukey HSD multiple range tests for the nematode bio-indices (factor ponds)
Correlations between the nematode
communities and the environmental
variables
In order to investigate a possible
significant
correlation
between
the
20
environmental
variables
with
the
characteristics of nematode communities,
Spearman rank correlation analysis was
conducted between the environmental data
and the nematode bio-indices. Results
Multi-correlation between nematode communities
confirmed that three variables (Sal, TOC, and
TN) correlated significantly with three bioindices of the nematode communities (S, d,
and ES(50)). Specifically, salinity was
significantly positively correlated with S and
d index (r = 0.31 and 0.29, respectively). By
contrast, TOC showed negative correlations
with S, d, and ES(50) (r = -0.32, -0.32, and 0.26, respectively); TN also showed negative
correlation with S (r = -0.25). Overall, both
organic enrichment variables have a negative
effect on the nematode bio-indices (Table 2).
Table 2. The r and p-value of Spearman rank correlation between the environmental variables
and the nematode bio-indices (n = 72) (p-values < 0.05 indicated with bold values)
EnV. variables
S
d
J′
ES(50)
N1
N2
Ninf
r -0.21
-0.16
0.11
-0.07
0.00
0.04
0.06
Dept.
p
0.08
0.17
0.37
0.54
1.00
0.75
0.59
r -0.15
-0.12
-0.15
-0.08
-0.14
-0.19
-0.19
DO
p
0.20
0.32
0.20
0.48
0.23
0.12
0.11
r
0.31
0.29
-0.14
0.20
0.09
0.00
-0.01
Sal
p
0.01
0.01
0.23
0.10
0.44
0.98
0.94
r -0.12
-0.11
0.09
-0.05
0.00
0.04
0.09
pH
p
0.32
0.35
0.44
0.68
0.99
0.73
0.44
r
-0.05
-0.06
0.03
-0.05
-0.03
-0.01
0.01
Fe2+
p
0.68
0.62
0.80
0.65
0.81
0.95
0.92
r
-0.17
-0.12
0.19
0.02
0.07
0.11
0.07
Fe3+
p
0.16
0.29
0.12
0.87
0.57
0.37
0.54
r -0.32
-0.32
-0.11
-0.26
-0.21
-0.19
-0.22
TOC
p
0.01
0.01
0.37
0.03
0.08
0.11
0.06
r -0.25
-0.23
-0.13
-0.16
-0.17
-0.16
-0.15
TN
p
0.04
0.06
0.29
0.19
0.15
0.19
0.22
Multi-interactions
between
nematode
communities and the environmental
variables
Overall,
multi-interaction
analyses
showed that each nematode bio-index was at
most affected by independent variables, e.g. S
and d were influenced by Sal and TOC. Other
bio-indices were affected by only one variable
such as DO, except for ES(50). A multiple
linear regression model was built to describe
the relationship between S and 8 independent
environmental variables (Table 3). The
equation of the fitted model was S = 16.82 +
0.17*Sal – 0.97*TOC. Since the p-value in
the ANOVA test was 0.0002, there is a
statistically significant relationship between
the variables at a 95.0% confidence level.
The R-Squared statistic indicated that the
model fitted explains 22.5% of the variability
in S index. The standard error of the estimate
(SE Est.) showed the error range of the
residuals to be 3.19. The average value of the
residuals (the mean absolute error-MAE) was
2.36. The Durbin-Watson (DW) statistic tests
the residuals to see if there are any
significant correlation based on the order in
which they occur in the data file. Since the pvalue of 0.53 was > 0.05, there is no
indication of serial autocorrelation in the
residuals at a 95.0% confidence level. Figure
5A showed a plot of the fitted model of S
index with salinity and TOC. The multiple
regression model of d and the environmental
variables (Fig. 5B) were interpreted
similarly. The other indices including J’,
ES(50), Hill indices were affected only by
DO. Therefore, a linear regression model was
used to describe the relationship between
these indices and 8 independent variables.
For example, the equation of the fitted model
between J’ and DO was J’ = 0.86 – 0.01*DO
21
Thai Thanh Tran et al.
(p = 0.03 < 0.05). Moreover, the R-Squared
statistic showed that the model as fitted
explains 6.4% of the variability in J’. The
standard error of the estimate indicated that
the range of the eorror of the residuals was
0.08. Furthermore, the average value of the
residuals (MAE) was 0.06. Since the p-value
(0.38) of D-W statistic test was > 0.05, there
was no proof of serial autocorrelation in the
residuals at the 95.0% Confidential level
(Table 3). The plot of the fitted linear model
between J’ and DO was presented in Figure
5C. In addition, the single linear regression
model
of
remaining
indices
and
environmental variables was similarly
interpreted.
Table 3. Multiple regression coefficients and results of fitting the regression model to describe
the relationship between the nematode communities and the environmental variables
SE
D-W
pNema.-En.V
Multi-regression model
R2
MAE
Est.
statistic value
S- EnV.F.
S = 16.82 + 0.17*Sal – 0.97*TOC 22.49 3.19 2.36
0.53
0.0002
d-EnV.F.
D = 3.58 + 0.03*Sal – 0.21*TOC 21.23 0.70 0.52
0.70
0.0003
J’-EnV.F.
J’ = 0.86 – 0.01*DO
6.38 0.08 0.06
0.38
0.03
ES(50)-EnV.F. ES(50) = 16.29 – 0.68*TOC
13.51 2.44 1.88
0.63
0.001
N1-EnV.F.
N1 = 13.36 – 0.50*DO
11.58 2.72 2.23
0.55
0.003
N2-EnV.F.
N2 = 9.92 – 0.41*DO
11.46 2.25 1.88
0.61
0.003
Ninf-EnV.F.
Ninf = 5.36 – 0.21*DO
10.63 1.21 0.94
0.60
0.005
Notes: Environmental variables (En.V:), standard error of the estimate (SE Est:); mean absolute error
(MAE), Durbin-Watson statistic (D-W statistic).
Figure 5. A plot of fitted (A) Multi-regression model between S and Sal/TOC, (B) Multiregression model between d and Sal/TOC, (C-G) Simple regression model between J’ and DO,
ES(50)-TOC, Hill indices-DO, respectively
22
Multi-correlation between nematode communities
DISCUSSION
Comparison of nematode bio-indices in Ca
Mau mangrove-shrimp farming ponds with
other similar habitats and its impact
The recent study by Tran et al. (2018c) is
one of the first investigations on nematode
biodiversities in the CMMSFP. Therefore,
we used their biodiversity data (Tran et al.
2018c) in combination with results of the
present study to better understand the
diversity of nematode communities in the
CMMSFP and to compare them with similar
studies on MSFPs around the world. The
composition and densities of nematode
communities in some ponds were different
leading to differences in bio-indices.
However, seasonal factors do not often
significantly affect bio-indices of nematode
communities because the tropical climate
allows for continuous cycle of reproduction
of nematodes (Ngo et al., 2013c).
Among biodiversity indices, H’ index has
been widely used for quantifying species
diversity, especially for nematode diversities
(Semprucci & Balsamo, 2012). The present
study estimated the nematode diversities in
CMMSFP not only based on the H’ index but
also on other indices such as S, d, J’, and Hill
indices. A first attempt is made to compare our
results with other data on nematode
biodiversities in mangroves and mudflats
(Table 4). Although the primary objectives of
other studies were quite different and not
completely similar methods or techniques were
applied, it gives an indication of nematode
diversity in our farming ponds. In general, the
biodiversity of nematode communities in the
CMMSFP was higher than those in a temperate
intertidal mudflat in France or in the intertidal
tropical mangrove mudflats in Brazil and
Australia. This supports the point that Ca
Mau’s mangrove forest is characterized by
high nematode diversities.
Table 4. Global data on nematode diversities from mangroves
Location
Habitat
Diversities
References
H’: 2.14±1.07–
Mangrove-shrimp
Ca Mau mangrove,
H’ from Tran et al.
3.61±0.24
farming ponds (38Vietnam
(2018c)
104 cm in depth)
H’: 3.6–4.2
Can Gio mangrove,
Mangrove mudflat
Ngo et al. (2007)
Vietnam
Hunter river and
Hodda &
Fullerton,
Mangrove
H’: 1.28–2.76
Nicholas (1985)
Australia
Mangrove
Cape York
H’: 2.02–2.91
Alongi (1987)
peninsula, Australia
estuarine
Merbok,
Rhizophora,
Gee &
H’: 2.0–3.2
Malaysia
Brugiera
Somerfield (1997)
Victoria, SE
Only Avicennia
H’: 0.558 ± 0.084 Gwyther (2003)
Australia
Marennes-Oléron,
Temperate
Rzeznik–Orignac
H’: 2.7–3.5
France
intertidal mudflat
et al. (2003)
Santa Catarina,
Netto & Gallucci
Mangrove
H’: 2.5–3.5
South Brazil
(2003)
Globally, mangrove forests have been
destroyed by coastal aquaculture, mainly
shrimp farming (Hamilton, 2013; Richards &
Friess, 2016). Integrated mangrove-shrimp
farming has emerged as a part of the
potential solution to protect mangrove-forest
23
Thai Thanh Tran et al.
faced by shrimp aquaculture (Primavera et
al., 2000). In 1978, integrated mangroveshrimp farming was first used in Vietnam
(Hai, 2005). Nowadays, this model has been
widely practiced in the country (especially in
Ca Mau Province), considered as the best
method for providing farming households
with a sustainable livelihood through
mangrove conservation (Ha et al., 2012). In
recent years, the model has been faced with
many challenges, mainly due to poor
technical knowledge (Bosma et al., 2016). In
CMMSFP, farmers do not apply feeds and
chemicals but depend on natural recruitment
of shrimp (Primavera et al., 2000).
Therefore, abundances of natural food play a
pivotal role in the success of the model.
Presently, Penaeus monodon, commonly
known as the giant tiger prawn or Asian tiger
shrimp has been broadly farmed in the
CMMSFP (Tho et al., 2011). The
productivity of shrimp is affected by several
variables including farm management, pond
size, availability of natural food (zoobenthos,
periphyton, phytoplankton and zooplankton),
water quality (dissolved oxygen, pH), and
weather conditions (sunlight, rainfall)
(Fitzgerald, 2000; Takashima, 2000). While
El Hag (1984) reported that Penaeus
monodon adults are omnivores, being able to
feed on both small organisms and organic
matter, nematodes and small organism are
still considered to be a main food source of
Penaeus monodon (Chong & Sasekumar,
1981). The high density and biodiversity of
the nematode communities in the CMMSFP
have been providing a very suitable natural
food source for shrimps. This is an advantage
of ecological solution of the CMMSFP
model in Vietnam.
Comparison between single vs multicorrelations and interpretation of their
effects on nematode bio-indices
Regarding the single correlations, S
index significantly correlated with three
variables (Sal, TOC, and TN), d with two
variables (Sal, TOC), and ES(50) with one
(Sal), whereas other indices did not correlate
with any variables. Thus, the question was
whether these correlations were still true in
multi-correlation analysis. In fact, there was
only the d index that still correlated with two
variables (its model: d = 3.58 + 0.03*Sal –
0.21*TOC). The multi-correlation of others
was completely different from the singlecorrelations. More specifically, S index was
affected by two variables (its model: S =
16.82 + 0.17*Sal – 0.97*TOC), J’ and Hill
indices were affected by one variable (DO),
also ES(50) by one (TOC) (Fig. 6). This
study suggested that it is necessary to pay
attention to the complex interactions between
the environmental variables and the impacted
nematode communities. Answers to the
question could help explain the differences
between single-and multi-correlation as well
as its effect on nematodes in particular and
aquatic organisms in general.
Figure 6. Single and multi-correlation between the nematode bio-indices
and the environmental variables
24
Multi-correlation between nematode communities
What variables need to be considered to
raise biodiversity of nematode communities
(shrimp’s food source)?
Using the multi-correlation results from
this study in combination with other studies
(Table 5), high salinity could help promoting
nematode diversities, whereas a high value of
depth, DO, pH, and organic concentration
(TOC, TN) could decrease the diversity.
Although nematode diversities can be affected
by a number of abiotic variables such as
salinity,
temperature,
hydrodynamics,
sediment grain size, oxygenation level and
food availability (Ingels et al., 2011; Cai et al.,
2012; Ngo et al., 2013a; Zeppilli et al., 2013;
Górska et al., 2014), salinity is the most
important variable. Several studies showed
that salinity is one of the most common
ancillary measures used in coastal and marine
ecological studies to monitor drivers of
benthic assemblages (Alber, 2002; Ysebaert &
Herman, 2002; Kimmel & Roman, 2004).
Moreover, salinity gradients could be more
important in explaining diversity across
multiple estuarine systems (Van Diggele,
2016). Therefore, salinity concentration
should be considered and regularly monitored
in CMMSFP. The optimal salinity for shrimp
culture is about 15−25 ppt (Boyd, 1995)
which is vital for pond dynamics, although
shrimps can be grown in salinities varying
from 4 ppt to 26 ppt. Likewise, in an earlier
study, P. monodon favored salinity ranging
from of 6.5 ppt to 25.5 ppt favored the
growth (Das et al., 2001).
Table 5. Single-correlation between the nematode bio-indices
and the environmental variables form others studies
Dep
Sal
DO
pH
S
-[1]
+[2, 7]
-[3]
-[4]
d
-[5]
+[7]
N.A
-[4]
H′
-[5, 6]
+[2]
-[3]
-[4]
ES(50)
N.A
N.A
-[3]
N.A
N1
-[5]
+[2]
-[3]
-[3]
N2
-[5]
N.A
-[3]
-[3]
Ninf
-[5]
N.A
N.A
-[3]
TN
-[7]
-[7]
-[3]
-[7]
-[3]
-[3]
-[3]
Notes: “+”: Positive correlations; “-”: Negative correlations; N.A: Not available; [1]: Gambi et al. (2003);
[2]: Tran et al. (2018b); [3]: Ngo et al. (2016); [4]: Ngo et al. (2013b); [5]: Tran et al. (2017a); [6]: Liu et
al. (2015); [7]: This contribution.
CONCLUSION
This study found significant multiinteraction between nematode communities’
bioindices with environmental variables in the
CMMSFPs. The biodiversity of nematode
communities have been considered to be high
which provided more natural food for
shrimps. Furthermore, the multi-correlation
between the nematode bio-indices and the
environmental variables produced completely
different results from those of singlecorrelation analyses. Although the present
study has been able to show the advantage of
the multi-correlation, there are still some
points we would like to address in future
work, especially the complex interactions
between the environmental variables and
nematode communities.
REFERENCES
Alber M., 2002. A conceptual model of
estuarine freshwater inflow management.
Estuaries, 25(6): 1246–1261.
Alongi D. M., 1987. Inter-estuary variation
and intertidal zonation of free-living
nematode communities in tropical
mangrove systems. Marine Ecology
Progress Series, 40(1): 103–114.
25
Thai Thanh Tran et al.
Bezerra T. N., Decraemer W., EisendleFlöckner U., Hodda M., Holovachov O.,
Leduc D., Miljutin D., Mokievsky V.,
Peña Santiago R., Sharma J., Smol N.,
Tchesunov A., Venekey V., Zeng Z.,
Vanreusel, A., 2018. Nemys: World
Database of Nematodes.
Bosma R. H., Nguyen T. H., Siahainenia A.
J., Tran H. T., Tran H. N., 2016. Shrimp‐
based livelihoods in mangrove silvo‐
aquaculture farming systems. Reviews in
Aquaculture, 8(1): 43–60.
Boyd C. E., 1995. Soil and water quality
management in aquaculture ponds.
INFOFISH International, 5: 29–36.
Ca Mau Province Portal, 2013. Retrieved
December
1,
2013,
from
.
Cai L., Fu S., Yang J., Zhou X., 2012.
Distribution of meiofaunal abundance in
relation to environmental variables in
Beibu Gulf, South China Sea. Acta
Oceanologica Sinica, 31(6): 92–103.
Chong V. C. & Sasekumar A., 1981. Food
and feeding habits of the white prawn
Penaeus merguiensis. Marine ecology
progress series, 5(20): 185–191.
Das S. K., Saksena D. N., 2001. Farm
management and water quality in relation
to growth of Penaeus monodon in
modified extensive shrimp culture system.
Journal of Inland Fisheries Society of
India, 33(2): 55–61.
De Grisse A. T., 1969. Redescription ou
modification de quelques techniques
utilisées dans l’étude des nématodes
phytoparasitaires. Meded. Rijksfakulteit
Landbouwwetenschappen, Gent 34:
351–369.
El Hag E. A., 1984. Food and food selection
of the Penaeid prawn Penaeus monodon
(Fabricius). In Limnology and Marine
Biology in the Sudan (pp. 213–217).
Springer, Dordrecht.
Fitzgerald W. J., 2000. Integrated mangrove
forest and aquaculture systems in
Indonesia.
In
Mangrove-friendly
26
aquaculture: Proceedings of the workshop
on mangrove-friendly aquaculture, eds.
J.H. Primavera, L.M.B. Garcia, M.T.
Castaños, and M.B. Surtida, 21–34. Iloilo
City, Philippines: Organized by the
Aquaculture Department, SEAFDEC.
Gambi C., Vanreusel A., Danovaro, R., 2003.
Biodiversity of nematode assemblages
from deep-sea sediments of the Atacama
Slope and Trench (South Pacific Ocean).
Deep
Sea
Research
Part
I:
Oceanographic Research Papers, 50(1):
103–117.
Gee J. M., Somerfield P. J., 1997. Do
mangrove diversity and leaf litter decay
promote meiofaunal diversity?. Journal of
experimental marine Biology and
Ecology, 218(1): 13–33.
Górska B., Grzelak K., Kotwicki L.,
Hasemann C., Schewe I., Soltwedel T.,
Włodarska-Kowalczuk
M.,
2014.
Bathymetric variations in vertical
distribution patterns of meiofauna in the
surface sediments of the deep Arctic
ocean (HAUSGARTEN, Fram strait).
Deep
Sea
Research
Part
I:
Oceanographic
Research
Papers,
91: 36–49.
Gwyther J., 2003. Nematode assemblages
from Avicenniamarina leaf litter in a
temperate mangrove forest in southeastern Australia. Marine Biology, 142(2):
289–297.
Ha T. T. T., van Dijk H., Bush, S. R., 2012.
Mangrove conservation or shrimp farmer's
livelihood? The devolution of forest
management and benefit sharing in the
Mekong Delta, Vietnam. Ocean &
Coastal Management, 69: 185–193.
Hai T. N., 2005. Effects of mangrove leaf
litters on the integrated mangrove–shrimp
farming systems in Ca Mau Province,
Vietnam. School of Environment,
Resources and Development. Asian
Institute of Technology, Thailand.
Hamilton S., 2013. Assessing the role of
commercial aquaculture in displacing
Multi-correlation between nematode communities
mangrove forest. Bulletin of Marine
Science, 89(2): 585–601.
Hodda M., Nicholas W. L., 1985. Meiofauna
associated with mangroves in the Hunter
River estuary and Fullerton Cove, southeastern Australia. Marine and Freshwater
Research, 36(1): 41–50.
Ingels J., Tchesunov A. V., Vanreusel A.,
2011. Meiofauna in the Gollum Channels
and the Whittard Canyon, Celtic Marginhow local environmental conditions shape
nematode structure and function. PLoS
One, 6(5): e20094.
Kimmel D. G., Roman M. R., 2004. Longterm
trends
in
mesozooplankton
abundance in Chesapeake Bay, USA:
influence of freshwater input. Marine
Ecology Progress Series, 267: 71–83.
Liu X. S., Xu M., Zhang J. H., Mu G., Liu D.,
Li X., 2014. Abundance and biomass of
deep-sea meiofauna in the northern South
China Sea. Journal of Tropical
Oceanography, 33(2): 52–59.
Liu X., Xu M., Zhang J., Liu D., Li X., 2015.
Community structure and biodiversity of
free-living marine nematodes in the
northern South China Sea. Acta
Oceanologica Sinica, 34(6): 77–85.
Netto S. A., & Gallucci F., 2003. Meiofauna
and macrofauna communities in a
mangrove from the Island of Santa
Catarina, South Brazil. Hydrobiologia,
505(1−3): 159–170.
Ngo X. Q., Chau N. N., & Tu N. D., 2013a.
Correlation
between
nematode
communities with some environmental
parameters in the Dai estuary, Ben Tre.
Journal of Biology, 35(3se): 1–7.
Ngo X. Q., Chau, N. N., Nguyen D. T., Pham
V. L, Vanreusel A., 2013c. Distribution
pattern of free living nematode
communities in the eight Mekong
estuaries by seasonal factor. Journal
Vietnamese Environment, 4(1): 28–33.
Ngo X. Q., Chau, N. N., Smol N., Prozorova
L., & Vanreusel A., 2016. Intertidal
nematode communities in the Mekong
estuaries of Vietnam and their potential for
biomonitoring. Environmental monitoring
and assessment, 188(2): 91–106.
Ngo X. Q., Smol N., Vanreusel A., 2013b.
The meiofauna distribution in correlation
with environmental characteristics in 5
Mekong estuaries, Vietnam. Cahiers de
Biologie Marine 54: 71–83.
Ngo X. Q., Vanreusel A., Thanh N. V., Smol
N., 2007. Biodiversity of meiofauna in the
intertidal Khe Nhan mudflat, Can Gio
mangrove forest, Vietnam with special
emphasis on free living nematodes. Ocean
Science Journal, 42(3): 135–152.
Nguyen V. T., 2007. Fauna of Vietnam. Freeliving nematodes orders Monhysterida,
Araeolaimida, Chromadorida, Rhabditida,
Enoplida, Mononchida and Dorylaimida.
No.22, Science and Technics Publishing
House, 455 pp.
Pham T. L., Tran T. T., Nguyen T. M. Y., Ngo
X. Q., 2017. Phytoplankton community in
integrated shrimp-mangrove farming ponds
in Ca Mau Province. Proceedings of the 7th
National Scientific Conference on Ecology
and Biological Resources Hanoi,793–800.
(in Vietnamese).
Phan N. H., San H. T., 1993. Mangroves of
Vietnam, IUCN Wetlands Programme,
Bangkok, Thailand.
Platt H. M., Warwick R. M., 1983. Free-living
Marine Nematodes (Part I. British
Enoplids). Synopses of the British Fauna
No.
28,
Linnean
Society
of
London/Estuarine & Brackish Water
Society.
Platt H. M., Warwick R. M., 1988. Free-living
Marine Nematodes (Part II. British
Chromadorids). Linnean Society of
London and the Estuarine and BrackishWater Sciences Association.
Primavera J. H., 2000. Development and
conservation of Philippine mangroves:
institutional
issues.
Ecological
Economics, 35(1): 91–106.
27
Thai Thanh Tran et al.
Richards D. R., Friess, D. A., 2016. Rates and
drivers of mangrove deforestation in
Southeast Asia, 2000–2012. Proceedings
of the National Academy of Sciences,
113(2): 344–349.
Rzeznik-Orignac J., Fichet D., Boucher G.,
2003. Spatio-temporal structure of the
nematode assemblages of the Brouage
mudflat (Marennes Oléron, France).
Estuarine, Coastal and Shelf Science,
58(1): 77–88.
Semprucci F., Balsamo M., 2012. Free-living
marine nematodes as bioindicators: past,
present
and
future
perspectives.
Environmental Research Journal, 6(1):
17–35.
Semprucci F., Moreno M., Sbrocca S., Rocchi
M., Albertelli G., Balsamo M., 2013. The
nematode assemblage as a tool for the
assessment of marine ecological quality
status: a case-study in the Central Adriatic
Sea. Mediterranean Marine Science,
14(1): 48–57.
Takashima F., 2000. Silvofishery: An
aquaculture system harmonized with the
environment.
In
Mangrove-friendly
aquaculture: Proceedings of the workshop
on mangrove-friendly aquaculture, eds. J.
H. Primavera, L. M. B. Garcia, M. T.
Castaños, and M. B. Surtida, 13–19. Iloilo
City, Philippines: SEAFDEC, Organized
by the Aquaculture Department.
Tho N., Ut V. N., Merckx R., 2011. Physico‐
chemical characteristics of the improved
extensive shrimp farming system in the
Mekong Delta of Vietnam. Aquaculture
Research, 42(11): 1600–1614.
Tran T. T., Lam N. L. Q., Quang N. X., Hieu
H. H., 2018a. Seasonal and spatial
variations of meiofauna communities in
correlation
to
environmental
characteristics in the organic shrimp farms
of Tam Giang commune, Nam Can
district, Ca Mau Province. VNU Journal
of Science: Natural Sciences and
Technology, 34(1): 55–64.
28
Tran T. T., Le Q. L. N., Le H. D., Nguyen T.
M. Y., Ngo X. Q., 2018b. Intertidal
meiofaunal communities in relation to
salinity gradients in the Ba Lai river,
Vietnam.
Journal
of
Vietnamese
Environment, 10(2): 138–150.
Tran T. T., Nguyen T. M. Y., Ngo X. Q.,
Pham T. L., 2017a. Effect of different
water column depths on nematode
communities in the mangrove-shrimp
farming system, Ca Mau Province,
Vietnam Journal of Marine Science and
Technology, 17(4A): 269–278.
Tran T. T., Nguyen T. M. Y., Ngo X. Q.,
Truong T. N., Nguyen N. S., 2017b.
Diversity
assessment
of
benthic
macroinvertebrate in shrimp-mangro
farming ponds, Ca Mau Province
Proceedings of the 7th national scientific
conference on ecology and biological
resources.
Science
and
Technics
Publishing House. (in Vietnamese).
Tran T. T., Nguyen T. M. Y., Nguyen T., Ngo
X. Q., 2017c. Meiofauna in the mangroveshrimp farms ponds, Ca Mau Province.
Journal of Science and Technology, 55(3):
271–284.
Tran T. T., Pham T. L., Nguyen T., Ngo X. Q.,
2018c.
Relationship
of
free-living
nematode
communities
to
some
environmental variables in an organic
shrimp farms, Ca Mau Province. Journal of
Science and Technology, 56(5): 526–648.
Truong T. D., & Do L. H., 2018. Mangrove
forests and aquaculture in the Mekong
river delta. Land use policy, 73: 20–28.
Van Diggele, A. D. & Montagna P. A., 2016.
Is salinity variability a benthic disturbance
in estuaries? Estuaries and Coasts, 39(4):
967–980.
Vincx M., 1996. Meiofauna in marine and
freshwater sediments. In G. S. Hall (Ed.),
Methods for the examination of
organismal diversity in soils and
sediments (pp. 187–195). Wallinfort, UK:
CAB International.
Multi-correlation between nematode communities
Vu T. P., 2004. National Report on Mangrove
in South China Sea. Vietnam Research
Centre
for
Forest Ecology and
Environment, Vietnam.
Warwick R. M., Platt H. M., Somerfield P. J.,
1988. Free living marine nematodes (Part
III. Monhysterids). The Linnean Society
of London and the Estuarine and Coastal
Sciences Association, London.
Ysebaert T., Herman, P. M. J., 2002. Spatial
and temporal variation in benthic
macrofauna and relationships with
environmental variables in an estuarine,
intertidal soft-sediment environment.
Marine Ecology Progress Series, 244:
105–124.
Zeppilli D., Bongiorni L., Cattaneo A.,
Danovaro R., Santos R. S., 2013.
Meiofauna assemblages of the Condor
Seamount (North-East Atlantic Ocean)
and adjacent deep-sea sediments. Deep
Sea Research Part II: Topical Studies in
Oceanography, 98: 87–100.
Zullini A., 2005. The Identification manual
for freshwater nematode genera, Lecture
book, MSc Nematology Ghent University.
29