Bank concentration and efficiency of commercial banks in vietnam
Bạn đang xem bản rút gọn của tài liệu. Xem và tải ngay bản đầy đủ của tài liệu tại đây (343.37 KB, 37 trang )
666 | ICUEH2017
Bank concentration and efficiency of
commercial banks in Vietnam
LE NGUYEN QUYNH HUONG
University of Economics HCMC –
NGUYEN HUU BINH
University of Economics HCMC –
Abstract
The relationship between bank concentration and bank efficiency
remains a controversial topic. This paper investigates to what degree
bank concentration dampens or enhances the response of bank
efficiency in Vietnam and vice versa. This study applies Concentration
Ratio (CR) and Herfindahl - Hirschman Index (HHI) as proxies of bank
concentration, while efficiency scores are calculated by stochastic
frontier approach (SFA) and data envelopment analysis (DEA). To test
the Structure Conduct Performance (SCP) and Efficient Structure (ES)
paradigm, the authors use Granger causality approach. However,
regarding the causality running from bank efficiency and bank
concentration, the results are complex: we find the causality running
from concentration to efficiency is weak, whereas efficiency Grangercaused negatively competition. Over a relatively long time period, from
2007 to 2014, the more efficient commercial banks operated in the less
concentrated market.
Keywords: Vietnam; bank concentration; efficiency; structure
conduct performance.
1. Introduction
In the process of integration into the world economy, Vietnam's
financial market is under great pressure. Strong competition
among commercial banks would be a great opportunity for the
banking sector if Vietnam domestic banks are more adaptable and
operate more efficiently, especially under the Restructuring Plan.
Thus, operational efficiency becomes a vital part for the survival
of a bank in the increasingly competitive environment. The
relationship between bank concentration and bank efficiency,
especially in Vietnam, is open to doubt and highly ambiguous.
There are numerous studies testing for this relationship. Some
concentrate on the Structure Conduct
Le Nguyen Quynh Huong & Nguyen Huu
Binh| 667
Performance (SCP) paradigm (Bikker & Haaf, 2002a; Deltuvaitė,
Vaškelaitis, & Pranckevičiūtė, 2015; T. P. T. Nguyen & Nghiem,
2016), while others support the reverse relationship namely
efficient structure hypothesis (ES), which considers that bank
efficiency positively influence on market concentration (Punt &
Van Rooij, 2003; Weill, 2004). Recently, this topic has received
tremendous attention in Vietnam, and only three studies found
hitherto (Chinh & Tiến, 2016; Huyền, 2016; Thơm & Thủy, 2016).
Unfortunately, no study analyses simultaneously the relationship
between bank concentration and efficiency by using Granger
causality. Thus, this is a noticeable research gap needed further
investigation.
The purpose of this paper is to examine the relationship
between bank concentration and efficiency by using the
application of Granger causality method. It also tests Structure
Conduct Performance and Efficient Structure hypothesis. The rest
of the paper is structured as follow. Section 2 presents a brief
overview of Vietnamese banking system. Section 3 contains the
previous related literature. Section 4 describes the methodology
and the data. Section 5 contains the empirical results while
section 6 gives conclusions and policy recommendations.
2. Overview of Vietnamese banking system
According to the State Bank of Vietnam (SBV), the history of
banking activities is divided into four stages, including 2 critical
periods: 1986 - 2001 (reforming from the mono-banking system into
the two-tier banking system) and after 2011 (restructuring the
Vietnamese banking system). The process of restructuring the
banking system and clean-up bad debts has implemented drastically
under Vietnam’s banking restructuring Scheme in 2011-2015
(Decision 254, 1/3/2012) and Non-performing debt settlement
Scheme of credit institutions (Decision 843, 31/5/2013). These
Schemes focus on some central goals, including controlling the weak
credit institutions, bad debts, development of the banking system
and to contribute significantly to macroeconomic stability, removing
difficulties for production and business, promoting economic growth.
To sum up, the process of restructuring of Vietnam's banking system
consists:
•
The privatisation of state-owned commercial banks.
• Increasing the financial scale and capacity: raising
capital, acquisitions and mergers, expanding mobilisation.
668 | ICUEH2017
• Improving asset quality, credit quality and reduce bad
debt.
Vietnamese commercial banking system can be classified into 4
main groups: (1) State-owned commercial bank, (2) Joint stock
commercial bank, (3) Foreign commercial bank, and (4) Joint
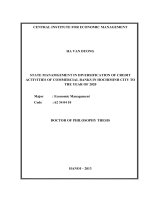
venture commercial bank. Figure 1 shows the number of
commercial banks as well as Non-performing loans (NPLs) over
the period of 8 years. It is noticed that State-owned banks and
foreign banks still remained in number, while Joint stock
commercial banks decreased their number from 40 in 2008 to 30
in 2014. According to Vietnam’s banking restructuring Scheme
mentioned above, some weak banks (Joint-stock commercial
banks) took actively and hospitably M&A with other leading banks
resulted in the drop in the number of commercial banks from 52 in
2007 to 44 in 2014. For example, Vietnam Tin Nghia Bank
together with SCB and First Bank of VN merged into SCB, Western
Bank and PVFC consolidated in PVcombank, Habubank is acquired
by SHB, etc. Because of high NPLs in weak banks, merging with
leading banks could be an efficient solution encouraged by SBV in
order to strengthen and improve the competition of Vietnamese
domestic banks. NPLs figures shown in Figure 1 followed an
upward trend, from 2% (2007) to 4.55% (2013). After reaching a
peak at 4.55% in 2013, NPLs decreased significantly to 3.25%. It
is doubtful that some banks could “cook the book”, deliberately
failed to comply with regulations on debt classification and
recorded bad debts in financial statements lower than actual.
However, some argue that 2014 is the first year Vietnam Asset
Management Company (VAMC) bought bad debt from troubled
banks and moved a considerable amount of NPLs out of banks’
financial statements (approximately 123 thousand billion VND,
according to SBV – 23/12/2014).
Number of banks
Le Nguyen Quynh Huong & Nguyen Huu
Binh| 669
State owned commercial
bank
Joint stock commercial bank
Joint venture commercial
bank
Foreign commercial bank
Non-performing loans
Figure 1. Number of Vietnamese banks and NPLs from 2007 to 2014
Source: Annual Statements of State Bank of Vietnam (SBV)
3. Literature review
This section reviews the theoretical and empirical results
between bank concentration and efficiency.
There have been long theoretical debates about the
relationship between market concentration and efficiency. These
debates dated back to three distinct hypotheses that reflect the
opinions on this relationship.
Two hypothesis in the structural approach including the traditional
Structure-Conduct-Performance (SCP) hypothesis, which is originated
from the traditional industrial organisation literature, and the
Efficient Structure (ES) hypothesis. In which, SCP hypothesis argues
the direct positive link between market concentration and
profitability based on the presumption that banks in a high
concentrated market can collude to earn higher profits resulting in
efficiency (Bain, 1951, 1956). ES hypothesis, meanwhile, assumes a
reverse causality that efficient banks are more profitable and gain
market shares, resulting in a concentrated market. In other words,
the higher efficiency of market leads to the higher market
concentration (Demsetz, 1973). The “quiet life” (QL)
670 | ICUEH2017
hypothesis developed by Hicks (1935), by contrast, supports a
negative relationship between market concentration and
performance. Following this, firms with market concentration tend
to make few efforts to maximise efficiency. Because managers in
these firms may have no motivation and enjoy the monopoly
profit of a “quiet life”, and this may result in inefficient operation.
Based on these hypotheses, there were a numerous number of
studies performed in the banking sector in many parts of the
world. Some of the studies are summarised in Table 1.
Table 1
Authors
Homma, Tsutsui, and Uchida
(2014)
Fu and Heffernan (2009)
Lloyd-Williams, Molyneux, and
Thornton (1994)
Molyneux and Forbes (1995)
Goldberg and Rai (1996)
Coccorese and Pellecchia (2010)
Al-Muharrami and Matthews
(2009)
Koetter and Vins (2008)
Fang, Hasan, and Marton (2011)
Berger and Hannan (1998)
Casu and Girardone (2009)
Ferreira (2013)
Nguyen, Stewart (2013)
Hypothesis
tested
Authors
Zhang, Jiang, Qu, and Wang
(2013)
Celik and Kaplan (2016)
As can be seen from the Table 1, there are differences in the
results of empirical studies concerning the relationship between
bank concentration and efficiency proposed by three hypotheses
mentioned above. This shows that the relationship between bank
concentration and efficiency depends on the characteristics of
each country and region. This paper uses Granger causality to
test simultaneously both SCP and ES in the case of Vietnam.
4. Methodology
To test the Granger causality relationship between bank
concentration and bank efficiency, this section explains the
methodological framework and the data: how to measure bank
concentration and bank efficiency, how to choose inputs and
outputs from financial statements of commercial banks, and the
Granger causality procedure.
4.1. Bank concentration
The market concentration is scaled from low to high, and in this regard, the market
is catalogued into four cases: (1) perfect competition, (2) monopolistic competition,
(3) oligopoly and (4) monopoly. The market which is considered as perfect
competition is addressed as low concentrated, and on the opposite side of the scale
- the concentration of market which tends to monopoly is evaluated as high (Boďa,
2014).
672 | ICUEH2017
Market
structures
Perfect
competition
Low concentration
concentration
High
There are a number of market concentration indicators based on
the calculation of market shares. Among other things, two standard
and popular ways to measure concentration level are Concentration
Ratio (CR) and Helfindhal-Hirschman Index (HHI). The other wellknown indicators of concentration ratio are the Coefficient of
variation, the Hall-Tideman Index (HTI), and the Comprehensive
industrial concentration index. Table 2 gives a brief overview of these
concentration measures except for CR and HHI.
However, because of general consensus, data validation and
straightforwardness, this paper use CRk and HHI to measure the
concentration in Vietnamese banking market. Technically, both
CRk and HHI do not require to rank and sort in descending order
all banks based on their market shares.
The k bank concentration ratio
The k Bank Concentration ratio is the simplest and required
limited data measure of concentration. Nevertheless, this
measure only emphasises on kth leading banks while neglecting
the small banks. Moreover, there is no rule for determination of
the value of k, so k can be chosen on an ad hoc basis (often, k =
3, 4, 5, 8).
The Concentration ratio of k banks is calculated as:
#
CR# =
where: S& is the market share of i
th
bank.
S&
&'(
Le Nguyen Quynh Huong & Nguyen Huu
Binh| 673
k represents the number of banks on the market.
The value of this indicator varies from 0 (perfect competition) to
1. The market is considered as oligopoly, if k > 1 or monopoly, if k
= 1.
This study adopts the Concentration Ratio - CR4, which means the
market share of the four largest firms. In the case of Vietnam, we
conventionally define four largest banks or “big-four” Vietnamese
banks as BIDV, Vietcombank, Vietinbank, and Agribank. Here, we use
the percentage share of the total assets held by the four largest
banks for CR4.
Helfindhal-Hirschman Index (HHI)
HHI is calculated by the sum of the squares of market shares of
all banks on the market. This index is defined as:
HHI =
where: S&, is the square of market share of ith bank.
S&,
&'(
n represents the number of banks on the market.
HHI spreads widely as U.S. Department of Justice has used it
since the 1980s to measure potential mergers issues or antitrust
concerns. However, there is no convention to classify a market
into high, moderate and low concentrated catalogue. This
problem can be addressed by using the consensus from U.S.
Department of Justice (DOJ) & Federal Commission Trade (FCT)
and The European Commission.
According to U.S. Department of Justice (DOJ) & Federal
Commission Trade (FCT), Horizontal Merger Guidelines § 5.2
(2010), and The European Commission, the interpretation of HHI
is as follows:
Concentration degree
High
Moderate
Low
Source: European Commission and DOJ + FTC
674 | ICUEH2017
HHI sometimes is called full-information index as it captures
features of the whole banking system. For this reason, this paper
chooses HHI to measure the concentration ratio of Vietnamese
banking market.
Table 2 summarises the key features of other concentration
measures which are mentioned at the beginning of this section
(Bikker & Haaf, 2002b; Boďa, 2014):
Table 2
A brief overview of HTI, CIC, CV
Concentration
measure
HTI
=
Hall-Tideman
index
Definition
2
i s& − 1
CIC
= s(
+
Comprehensiv
e
industrial
concentration
index
Emphasis on the absolute number
of banks.
(0,1] Enriching HHI by the number
of banks which cause entry
and exit barriers.
+
CV
1
=n
− 1),
Coefficient of
variation
4.2.
Range Typical features
1
&'(
(0,1]
Suitable for cartel markets
(monopoly). It
combines both relative dispersion
and
absolute magnitude.
Stressing on the dominance
of the largest bank.
Not including the number of
banks. Simple to understand
(this is a standard
[0,∞) relative measure of variation of
nominal
variables).
No
consensus at which value may
be considered as high or low.
Bank efficiency
Defining output, input variables in banking sector
The determination of the input - output variables in banking
field is a controversy issue. Berger and Humphrey (1992)
determined inputs and outputs in many different perspectives
(National Bureau of Economic Research - NBER study "Output
Measurement in the Service Sectors”, Chapter 7 - Measurement
and efficiency issues in commercial banking). Briefly, these
viewpoints include three main approaches:
Intermediation Approach: banks are financial institutions,
intermediation between borrowers and lenders. Therefore, outputs
are probably defined as loans and other assets, while inputs will
be deposits and other liabilities. This method was developed by
Sealey and Lindley (1977).
Le Nguyen Quynh Huong & Nguyen Huu
Binh| 675
User cost Approach: This method determines the inputs or
outputs based on the ability to contribute to revenue for the bank.
If the financial returns on an asset exceed the opportunity cost of
funds or if the financial costs of liability are less than the
opportunity cost, then the instrument is considered to be a
financial output (Berger & Humphrey, 1992).
Value-added Approach: This approach considers all asset and
liability categories to have output characteristic rather than
distinguish inputs from outputs in a mutually exclusive way. The
categories having substantial value added, as judged using an
external source of operating cost allocations, are employed as the
important outputs. Others are treated as representing mainly either
unimportant outputs, intermediate products, or inputs, depending on
the specifics of the category (Berger & Humphrey, 1992).
Measuring bank efficiency
Charnes, Cooper, and Rhodes (1978) is the first team using
Data Envelopment Analysis model (DEA) to measure the efficiency
of decision-making units (DMUs). DEA model is a non-parametric
estimation which is widely used in myriad fields since 1957. The
global private banking sector, particularly, has been applied DEA
model in research (Nathan & Neave, 1992) (Miller & Noulas,
1996), (Iršová & Havránek, 2010), (Luo, Yao, Chen, & Wang,
2011).
Data envelopment analysis (DEA) is a linear programming
formulation for measuring the relative performance of organisational
units where the presence of multiple inputs and outputs makes
comparisons difficult. Efficiency scores are then calculated from the
frontiers generated by a sequence of linear programs (convex
combinations of DMUs).
Assuming there are n banks, each bank can create s output by
using m different inputs. The relative efficiency score of a DMU p
could be assessed by solving a fractional program, which is
defined by extremal optimization (maximization) of the ratio of
weighted sum of outputs to weighted multiple inputs (aka virtual
output to virtual input ratio), then subject to the constraints of
non-decreasing weights and efficiency measure (the earlier
mentioned ratio) less than or equal to one. To sum up, this
involves finding the optimal weights so that efficiency measure is
maximised (banks choose their input and output weights that
maximise their efficiency scores).
676 | ICUEH2017
?
max
v#y#>
#'(
B
A'(
u x
A
A>
s. t.
where: k = 1, …, s; j = 1, …, m; i = 1, …, n
yki: output k produced by bank i,
xji: input j used by bank i,
vk and uj are weights given to output k and input j.
However, this research will not go too deep into the complex
theoretical part of the DEA estimations but focus primarily on the
empirical side of the methods that concern measuring efficiency.
Another common method of measuring efficiency, developed by Aigner, Lovell,
and Schmidt (1977) and Meeusen and van Den Broeck (1977), is the Stochastic
Frontier Approach (SFA). SFA method divides residuals into 2 groups: inefficiencies
and noise, and using some assumptions about the inefficiencies’ distribution. One
part of residuals is called normal statistical noise (V it) and the rest is noise
inefficiency (Uit). Vit is assumed to be independent of the explanatory variables and
,
have the same distribution iid ~ N (0, s L) and represents the statistical noise,
measurement error, and other random events (e.g., economic conditions,
earthquakes, weather, strikes, luck) beyond the company's control. Inefficiency U it
(aka inefficiency error term - non-negative) represents inefficiency factors and
,
assumptions is truncated at 0 and idd ~N (µ, s L). At the same time, U it is assumed
to be independent of Vit. The canonical formulation that serves as the foundation
for other variations is the model:
Y = b’X + v – u,
where Y is the observed outcome, b’X + v is the optimal, or
frontier goal (i.e. maximal production output or minimum cost)
pursued by the individual. The amount by which the observed
individual fails to reach the optimum (the frontier) is u.
Alternatively, there is a commonly used – the Translog function:
Yit = exp [Xit b + (Vit - Uit)] i = 1, …, K, t = 1, …, T
Le Nguyen Quynh Huong & Nguyen Huu
Binh| 677
where: Yit: output, the output of the ith enterprise, at time t
Xit: Vector KX1 input of ith now, at time t
b: Vector Kx1 of unknown factors
Vit: “noise” error term - symmetric (i.e. normal distribution)
Uit: “inefficiency error term” - non-negative (i.e. half-normal
distribution)
SFA has become the method commonly used because of many
prominent advantages (Coelli & Perelman, 2000; Cuesta & Orea,
2002; Färe, Grosskopf, Lovell, & Yaisawarng, 1993; Grosskopf,
Margaritis, & Valdmanis, 1995). Whereas SFA is more appropriate
for emerging markets where measurement errors and
uncertainties of the economic environment are more likely to
prevail (Zhang et al., 2013), we use both DEA and SFA for Vietnam
case.
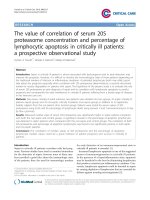
Figure 2. DEA and SFA Frontier
Here, we adopt DEA input-oriented and follow the
intermediation approach. The intermediation approach, originally
proposed by Sealey and Lindley (1977), is appropriate when
banks operate as independent entities (Bos & Kool, 2006) and
take into account interest expenses. It seems appropriate to
evaluate commercial banks in Vietnam because interest expenses
present at least more than half of total costs in general (Berger &
Humphrey, 1997). In particular, this study uses interest expenses
and other operating expenses presenting for the banks’ inputs,
and net interest revenue, other operating income for the banks’
outputs.
678 | ICUEH2017
To control multiple inputs and to allow a nonlinear relationship
between the bank's total income and inputs, this paper uses
Fiorentino's proposed translog function (Fiorentino, Karmann, &
Koetter, 2006; Fontani & Vitali, 2014). Sharing the DEA data set,
the translog function has two inputs, namely interest expense and
other interest expense, as follows:
ln(Yit) = b0 + b1 ln(Xit1) + b2 ln(Xit2) + b3 ln(Xit1) ln(Xit2) + b4
ln(Xit1)2 + b5 ln(Xit2)2 + (Vit - Uit)
Where:
Yit: outputs (total revenue)
Xit1, Xit2: inputs (interest expense and other interest
expense)
b: Vector Kx1 of unknown factors
Vit and Uit are assumed to have standard and semistandard distributions,
respectively.
4.3. Granger causality model
Granger causality is a statistical concept of causality that is
based on the prediction. Granger causality (or "G-causality") was
developed in 1969 by Professor Clive Granger and has been
widely used in economics since the 1960s. Following Casu and
Girardone (2009), we use autoregressive-distributed linear
specification
to
disentangle
the
relationship
between
concentration and efficiency. The lags (K, J) are determined by
Augmented Dickey-Fuller. Its mathematical formulation takes the
following form:
Q
y =∂ +
#'(
M
O
y
α + x
MP#
#
MPA
S
β +ϑ
A
M
A'(
where yM and xM are represented alternatively by mentioned above measures of concentration and efficiency, and ϑ&M is disturbance
term. We first run OLS and then employ endogeneity test. Next, we test ES and SCP, and null hypothesis is β(= … = βA = 0. If ES is
hold, the coefficients for efficiency is positive and significant. If SCP is hold, there are positive and significant coefficients of
concentration.
Data
Our data are collected from financial statements of 21
commercial banks in Vietnam from 2007 to 2014. We cannot
cover financial data from the whole Vietnamese banking
Le Nguyen Quynh Huong & Nguyen Huu
Binh| 679
system due to the limit in collecting data. Nineteen of 21 banks
are joint stock commercial banks, one is foreign bank and the
remaining is State-owned bank.
To compute concentration ratio in the first stage, we use the
percentage share of total assets of four largest banks. In the
second stage, we measure the efficiency scores by adopting DEA
and SFA method with inputs as interest expenses and other
interest expenses. In the third stage, we test the Granger
causality between concentration ratio (measured on the first
stage) and efficiency scores (measured on the second stage, then
multiply each bank score by their market shares). Appendix 1
presents description and statistics of variables used in measuring
efficiency scores in the second stage. It can be seen that “big-4”
always are State-owned commercial banks and dominate the
whole banking system between 2007 and 2014.
5. Empirical results
5.1. Concentration index of Vietnamese commercial
banks
Appendix 2 reports HHI and CR4 of Vietnamese banking system
between 2007 and 2014. In 2008, both concentration ratios
reached their peaks (1440 for HHI, 0.77 for CR4), suggesting
Vietnamese banks faced challenge of strong competition. In 2008,
two new banks (Tiên Phong Bank and Liên Việt Bank) were
granted the license of establishment by SBV after a decade no
new bank set up. Moreover, SBV officially issued the first 100%
foreign subsidiary bank licenses to HSBC, ANZ and Standard
Chartered, opening a new period for the operation of foreign
banks in Vietnam. Therefore, there was a potential threat which
was posed by not only local competitors but also foreign banks,
leading to high concentration in 2008.
Over the following four years, both concentration ratios fell
gradually and reached their lowest points in 2012. Thereafter,
they increased steadily during 2013-2014 due to the booming
M&A activities (for example, Western Bank and Petro Vietnam
Financial Company, Construction Bank and Vietinbank, Mekong
Housing Bank and BIDV). This is the effect of the M&A process
that has formed a number of large-scale banks in terms of total
assets. However, the concentration ratio of Vietnamese banking
system is considered relatively low (HHI < 1500), suggesting that
high competition in the banking market. High completion, in turn,
could enhance the performance and efficiency of banking system
(Bính, 2015).
680 | ICUEH2017
5.2. Efficiency scores of Vietnamese commercial banks
In measuring efficiency, we adopt both SFA and DEA approach.
Taking the available data, the SFA specifies two empirical models –
the SFA True random effects and fixed effects. Next, Hausman-test
allows us to confirm whether to use Random or Fixed effects.
Hausman-test result is shown in Table 3 (Prob>chi2 = 0.0000),
suggesting that using SFA True random effects are more robust
and consistent.
Table 3
Hausman test for SFA True random effects and fixed effects
Ln Interest Expense
Ln Other Interest Expense
Ln (Interest Expense.Other IE)
2
Ln (Interest Expense)
2
Ln (Other Interest Expense)
b = consistent under Ho and Ha; obtained from sfpanel
chi2(5) = (b-B)'[(V_b-V_B)^(-1)](b-B)
= 170.15
Prob>chi2 =
0.0000
Le Nguyen Quynh Huong & Nguyen Huu
Binh| 681
Table 4
Efficiency scores estimated by SFA and
DEA
Efficiency scores
jlms (SFA approach)
ACB
SCALE (DEA approa
SHB
VID
ABB
AGR
EXM
VID
BIDV
1
CTG
VCB
MEK
M
NCB
A
OCB
O
SHB
SAC
SEA
VPB
VIB
EXM
ABB
MHB
Table 4 shows the average efficiency scores of commercial banks
in Vietnam in the period of 2007-2014 by DEA VRS input-oriented
and SFA True random effects. It is obvious that there are differences
between SFA and DEA results. Reported figures in Table 4 imply that
according to SFA approach banks scored low efficiency are Stateowned commercial banks (Vietcombank, Vietinbank, BIDV and
Agribank are ranked low). Noted that jlms is named for SFA Scores
and DEA Scale is chosen to represent for DEA Scores.
5.3. Granger causality
Firstly, we test the stationarity of the series, using augmented Dickey-Fuller test.
Lags are included and the null hypothesis is non-stationary existing. The decision of
682 | ICUEH2017
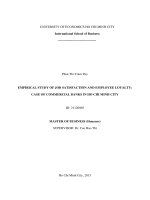
choosing whether random walk with drift or without drift is based on the shapes of
the trend line graph in Figure 3. Both variables Scale and jlms of each banks are
adjusted by multiplying by their market shares in percentage, then name them as
Scale-adjusted and jlms-adjusted.
.845 .85
.84
scalea
.855
.86
Figure 3. Trend line of Scale-adjusted, jlms-adjusted, HHI, CR4
1000 1100 1200 1300 1400
hhi
2006
2006
Table 5
ADF test
Scale-a
MacKinnon approximate p=value for Z(t)
lag (0)
lag (1)
Table 5 illustrates that only jlms-adjusted (jlms-a) is station
while Scale-adjusted (Scale-a), CR4 and HHI are station with 1
time lag. Thus, we decide on lags for scale-a, jlms-a, cr4, hhi
(1,0,1,1, respectively).
Le Nguyen Quynh Huong & Nguyen Huu
Binh| 683
Then we test endogeneity of all models to whether or not to apply GMM
to robust the results. We discover that all explanatory variables are
exogenous variables, means Cov (X jt, ϑjt) = 0, with j is j-th model.
Whenever OLS estimators are as well as GMM estimators, no need to use
GMM.
The results obtained from testing the hypotheses put forward to
explain the SCP and ES relationship are presented in Table 6, ES
hypothesis test, it is also clear that the bank efficiency of the
previous year (first lags) has a negative and statistically significant
influence on bank concentration, while the influence of the same
year is not statistically significant. Increasing in bank efficiency
Granger-causes a fall in both HHI and CR4 index, meaning scale
efficiency positively Granger-causes competition. This results are
consistent with findings of Ferreira (2013); T. N. Nguyen and Stewart
(2013); Casu and Girardone (2009) and reject the ES hypothesis in
Vietnam. Based on the signs of regression coefficients, noticeably,
this study makes an unambiguous conclusion that ES Hypothesis
should be rejected in transition economy like Vietnam. One possible
explanation is that Vietnamese banking system is considered highly
regulated and “over-protected”. In a highly regulated and “overprotected” market, efficient banks compared to State owned banks
(inefficient banks) hardly continue high profits because efficient
banks cannot have advantages and create barriers to market entry.
The policy makers should notice that each policy intervention or
interventionism could adversely affect the development of the
banking system and distort the structure of the system. Another
explanation could be that the business strategies of large
Vietnamese banks during this period were focused on raising capital,
loans, assets, deposits, branch networks and reducing NPLs. Thus,
revenue, interest income and profit before tax were not the most
propriety missions of banks (T. N. Nguyen & Stewart, 2013). Panels
(b) and (d) in Table 6 show that the first lags of competition are
significantly (different from zero), indicating that competition at time
t is influenced by previous year's competition.
With regard to the causality running from bank concentration
(measured by CR4 and HHI) to DEA scale efficiency and SFA jlms,
the results presented in the later Table 6 are inconsistent and
contradictory.
DEA-efficiency
is
affected
positively
by
concentration and previous year’s efficiency, while there is a
negative influence from concentration to SFA jlms. However, this
result is not significant, implying that concentration does not
Granger cause to the efficiency of Vietnam’s banks. Overall, the