Drought risk assessment during the dry season in Tien river estuary (HNUE Journal Of Science)
Bạn đang xem bản rút gọn của tài liệu. Xem và tải ngay bản đầy đủ của tài liệu tại đây (1.5 MB, 10 trang )
HNUE JOURNAL OF SCIENCE
DOI: 10.18173/2354-1059.2020-0040
Natural Sciences 2020, Volume 65, Issue 6, pp. 191-200
This paper is available online at
DROUGHT RISK ASSESSMENT DURING THE DRY SEASON
IN TIEN RIVER ESTUARY
Dao Ngoc Hung and Nguyen Thanh Luan
Faculty of Geography, Hanoi National University of Education
Abstract. Drought simply is a period of moisture deficiency. It depends on temperature,
evaporation capacity, vegetation cover, topography, etc., in addition, it often happens on a
large scale making it difficult to use traditional research methods. With the development
and widespread application of remote sensing technology and geographic information
systems (GIS), the use of satellite images as well as GIS software is becoming more and
more effective in monitoring, monitoring and assessing drought. In this study, the author
assessed the risk of drought at Tien river estuary through two indices: Normalize Difference
Vegetation Index (NDVI) and Standardized Precipitation Index (SPI) during the dry season
months of 1991, 2001, 2010 and 2018. SPI values are interpolated to construct spatial
modeling of meteorological drought levels. Through the LANDSAT satellite image, NDVI
is calculated and built on a map of drought levels. Weighted overlay SPI and NDVI map
layers for a drought risk map. Research results have shown that the Tien river estuary area
is divided into 2 zones: light drought and moderate drought occurs in the dry season.
Drought occurred with strong intensity in the eastern coastal area of Ben Tre and Tra Vinh
provinces, the deeper the inland the level of drought decreased.
Keywords: drought index, NDVI, SPI, risk assessment, Tien river estuary.
1. Introduction
Drought together with climate change is one of the prominent global issues so many
authors in the world have studied drought research. But this is inherently severe natural
phenomena with high complexity, so far there is no general method to study the problems
of drought. However, it is now common in the world for researchers to use drought
indicators in their research. Among the meteorological indicators, since 1996 the group
of authors Michael J. Hayes, Mark. D. Svoboda et al. [1] studied drought through the
Standardized Precipitation Index (SPI). And then a series of other authors such as the
study of drought climate in Europe by author Benjamin Lloyd-Hughes And Mark A.
Saunders [2] (2002) also assessed drought based the SPI and the Palmer drought severity
index (PDSI); or research by A. Loukas and L. Vasiliades [3] (2004) assessing the
probability of Greek drought through SPI.
Received May 16, 2020. Revised June 20, 2020. Accepted June 27, 2020.
Contact Dao Ngoc Hung, e-mail address:
191
Dao Ngoc Hung and Nguyen Thanh Luan
Through research, up to now, developed countries in the world have been aiming at
managing drought. Therefore, the application of remote sensing technology in research,
evaluation, and drought management has been concerned by many researchers around the
world. In 2006, Parul Chopra [4] researched of drought risk assessment by remote sensing
technology and GIS through NDVI, SPI, and fluctuations in agricultural output chain
applied to the specific case is the Gujarat area, India. Or the research of assessing the risk
of drought using remote sensing and GIS technology: The case of the southern region of
Tigray, Ethiopia by Birhanu Gedif et al [5] (2014) also used remote sensing technology
Predicting image, calculating NDVI and Vegetation Condition Index (VCI) to establish
and zoning drought risk map.
In Vietnam, in recent years, there have also been many authors applying remote
sensing technology and GIS in drought research. In 2013, the author Le Thi Thu Hien [6]
implemented the project "Application of plant index (NDVI) of Landsat image to assess
the desertification of Binh Thuan province". Or as the study "Application of Remote
Sensing to Assess Han Drought Risk in Bac Binh District, Binh Thuan Province" by Trinh
Le Hung and Dao Khanh Hoai [7] presented the results of assessing the risk of drought
in the area. Bac Binh district (Binh Thuan province) from LANDSAT multispectral
satellite image data using plant temperature drought index (TVDI).
For the Mekong Delta region in general and the Tien River in particular, there have
been many studies on drought in recent years. Example there is the research "Building
meteorological forecasting technology in the Mekong Delta" by Nguyen Dang Tinh et al. [8];
or "Developing drought map of the Mekong Delta in the context of climate change" by
author Tran Van Ty et al.; the research "Drought fluctuations in the dry season in Tien
Giang province period 1980 - 2015" by Dao Ngoc Hung et al. [9]. However, these
researches are mainly evaluated based on meteorological drought indicators, but there is
no comprehensive evaluation of criteria belonging to different drought groups.
From the scientific researches on drought both at national and abroad, it can be seen
that there are still some problems:
- There is not any index that stands out from the others. Therefore, the decision to
select a drought indicator set will depend on the specific characteristics and conditions of
each region as well as the available monitoring data.
- Studies on assessing drought risk combining two criteria in the group: using remote
sensing image interpretation technology (NDVI) and meteorological term (SPI) for Tien
river estuary are not available.
Therefore, the research project on drought risk in Tien river estuary using a
combination of SPI and NDVI drought indicators is a practical and meaningful research.
2. Content
2.1. Materials and methods
2.1.1. Study area
The Tien estuary area is in the latitude range from 9°31’46”N to 10 o35’26”N,
longitude from 105o49’07”W to 106o48’06”W, including administrative territories of
three provinces: Tien Giang, Ben Tre, and Tra Vinh. Administratively, the area of the
192
Drought risk assessment during the dry season in Tien river estuary
Tien River belongs to the Mekong Delta region; naturally, this area is a part of the lower
Mekong River. Tien river area is adjacent to 5 provinces/cities: Ho Chi Minh City, Long
An, Dong Thap, Vinh Long, Soc Trang, has a total area of about 7263.3 km 2.
Although the Tien estuary area in the lower Mekong region has abundant river water,
it varied to the area's additional humidity. But due to being located in the famous monsoon
region in Southeast Asia, the weather here has two distinct seasons each year: the rainy
season almost coincides with the summer, lasting from May to November (coming soon
and ending later than the North). It is noteworthy that the activity and abnormality of the
marine gas masses together with the activity of monsoon and the equator-tropical
disturbances which govern and determine the temporal change weather conditions in this
area, which have resulted in unusual natural varying, including drought.
2.1.2. Data
* Meteorological Data
Data on rainfall at meteorological stations in provinces of Tien river estuary (My
Tho, Ba Tri, Cang Long) and nearby stations: Vung Tau, Moc Hoa, Cao Lanh, Tay Ninh,
Can Tho, Soc Trang, period 1990 - 2018 provided by Vietnam Institute of Meteorology
Hydrology and Climate change. Through this data series, calculate 1-month SPI, then
select the months of generals corresponding to NDVI to develop a meteorological drought
map of the Tien river estuary area.
* Remote Sensing Data
For the analysis of drought severity, the LANDSAT images (path 125 row 53) were
obtained from the USGS website, with a spatial resolution of 30m for Apr 12, 1991; Feb
18, 2001; Feb 27, 2010, and Mar 19, 2018, respectively (Table 1).
Table 1. Information on satellite image data used in research
Sensor
Band for
calculating
NDVI
Spatial
resolution
Date of
acquisition
LANDSAT 5
TM
3, 4
30 m
Apr 12, 1991
4
LANDSAT 7
ETM+
3, 4
30 m
Feb 18, 2001
5
LANDSAT 5
TM
3, 4
30 m
Feb 27, 2010
8
LANDSAT 8
OLI
4, 5
30 m
Mar 19, 2018
No. of
image
Satellite
1
Meteorological data were used to calculate SPI. Remote sensing data were used to
calculate NDVI. The interpolation method was used to visualize the spatial variability of
SPI and NDVI in the study area. From there identify the drought severity areas. Drought
risk maps are a weighted linear combination for all input factors in April 1991, February
2001, February 2010, March 2018. Interpolation method was used to visualize the
droughts for April 1991, February 2001, February 2010, March 2018 separately. The final
drought risk map was generated to visualize the spatial and temporal variation from the
period 1991 - 2018 during the dry season in the study area.
193
Dao Ngoc Hung and Nguyen Thanh Luan
2.1.3. Method
* Assessing drought through NDVI
Normalized Difference Vegetation Index (NDVI) quantifies vegetation by measuring
the difference between near-infrared (which vegetation strongly reflects) and red light
(which vegetation absorbs). NDVI always ranges from -1 to +1. But there isn’t a distinct
boundary for each type of land cover. For example, when you have negative values, it’s
highly likely that it’s water. On the other hand, if you have a NDVI value close to +1,
there’s a high possibility that it’s dense green leaves. NDVI uses the NIR and red channels
in its formula [10]:
NDVI =
(1)
where NIR - reflection in the near-infrared spectrum; RED - reflection in the red range of
the spectrum
In this study, the author used the satellite image LANDSAT to calculate NDVI for
the times of April 1991, February 2001, February 2010, March 2018. NDVI values are
categorized into five different (Table 1) classes based on the classification of NDVI
results [10]. The classification of NDVI values are performed for the indication of
vegetated and non-vegetated areas and is further used to assess dry and wet areas.
Table 2. Classification of NDVI
NDVI ranges
Drought
≥ 0.3
0.2 – 0.3
0.1 – 0.2
0 – 0.1
<0
No drought
Light drought
Moderate drought
Severe drought
Very severe drought
* Meteorological drought assessment through SPI
Meteorological drought is defined as a period with an abnormal precipitation deficit,
concerning the long-term average conditions for a region. The SPI indicator shows the
anomalies (deviations from the mean) of the observed total precipitation, for any given
location and accumulation period of interest. Since SPI can be calculated over different
precipitation accumulation periods (typically ranging from 1 to 48 months), the resulting
different SPI indicators allow for estimating different potential impacts of a
meteorological drought:
- SPI-1 to SPI-3: When SPI is computed for shorter accumulation periods (e.g., 1 to 3
months), it can be used as an indicator for immediate impacts such as reduced soil
moisture, and flow in smaller creeks.
- SPI-3 to SPI-12 When SPI is computed for medium accumulation periods (e.g., 3 to 12
months), it can be used as an indicator for reduced streamflow and reservoir storage.
- SPI-12 to SPI-48: When SPI is computed for longer accumulation periods (e.g., 12 to 48
months), it can be used as an indicator for reduced reservoir and groundwater recharge.
Therefore, a month SPI was calculated for 9 rainfall stations using monthly rainfall
data for the period of 1986-2018 by Drin C software. But only assess the months
194
Drought risk assessment during the dry season in Tien river estuary
corresponding to the NDVI. The category column in the drought severity classification
table (Table 3) has been modified to suit the reclassification of the SPI maps.
Table 3. Classification of SPI
SPI ranges
Drought
>0
No drought
0 – -1.0
Light drought
-1.0 – -1.5
Moderate drought
-1.5 – -2.0
Severe drought
≤ -2.0
Very severe drought
Source: (U.S. National Drought Mitigation Centre)
* Method of mapping maps and geographic information systems (GIS)
In order to present a visualization of the data, the results of the study, the author has
applied informatics software (excel and Drin C) to build visual charts.
In the process of creating drought maps based on NDVI and SPI, the topic also used
Arcgis 10.5 software to interpret images, calculate NDVI, interpolate SPI, weighted
overlay.
The map of drought risk the Tien river estuary area was calculated by the method of
weighted overlay linear maps for 1991, 2001, 2010 and 2018. Points are assigned to
values 1 - 5 respectively with the level from very severe to no drought, for this research,
the author chose an average rating so the weight for the SPI and NDVI classes is 0.5 - 0.5.
The aggregate score from the linear weighting map model is reclassified into 5 levels of
drought respectively as no drought, light drought, moderate drought, severe drought, and
very severe drought.
2.2. Results and discussion
* NDVI and drought
NDVI for the years 1991, 2001, 2010, and 2018 was calculated using ArcMap 10.5.
On the basis of this NDVI, drought classes were derived and the trend in their shift was
also identified.
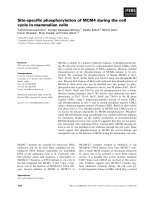
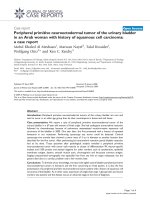
Analysis of the maps in Figure 1 shows that during the dry season, the drought in
Tien river estuary area tends to decrease. However, until 2018 in the study area, still there
were enough to 5 drought levels: from no drought to very severe drought. Through this,
it is also possible to see that the area frequently affected by drought is the coastal area in
the east and southeast. These areas in the dry season often occur saline intrusion, making
the impact of drought even more severe.
195
Dao Ngoc Hung and Nguyen Thanh Luan
a) Apr 12, 1991
b) Feb 18, 2001
c) Feb 27, 2010
d) Mar 19, 2018
Figure 1. Drought map of Tien river estuary area based on NDVI
196
Drought risk assessment during the dry season in Tien river estuary
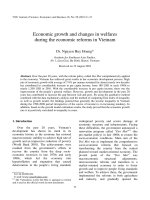
Figure 2. The diagram shows the area structure of the drought class
in the Tien river estuary over the years
Based on Figure 2, the drought trend of the Tien estuary area is even more apparent.
Although in 2001, the total area of drought levels decreased compared to 1991 but since
then the total area of drought levels has tended to increase. By 2018, the percentage of
the area without drought will be reduced to 36.37%; severe and very severe drought levels
have decreased but the total ratio of light and moderate drought areas has increased to
44.5% of the total area of the region.
* SPI and drought
Drought risk was identified using SPI values over 28 years. SPI during selected
months of April 1991, February 2001, February 2010, March 2018 has been presented to
show the pattern of SPI during these years as other relevant data was only for these years.
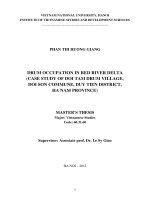
Calculated a month SPI values for the months of April 1991, February 2001,
February 2010, March 2018 at the mathematical stations show the level of fictional
drought in the study area. Except for 2001, SPI values of stations are very low, ranging
from 0.63 to -1, which shows that the risk of drought in the Tien river estuary area is very
high. My Tho station always has a low SPI value below 0.5. Ba Tri station in 2010 and
2018 was also below 0.5. Cang Long station in 2018 increased slightly compared to 2010
but still has not surpassed the level 1. Thus, it can be seen that the general trend of the
Tien river estuary area is worth 1 month - SPI is declining, the risk of meteorological drought
is very high.
Figure 3. The diagram shows of SPI values
at meteorological stations in the Tien River estuary area
197
Dao Ngoc Hung and Nguyen Thanh Luan
* Drought risk
a) April 1991
b) February 2001
d) March 2018
c) February 2010
Figure 4. Map of drought risk of Tien river estuary area
Drought risk was assessed using NDVI and SPI values by linear combination
weighted system. Both NDVI and SPI for all four years were separately reclassified and
weights were assigned to the classes. The weights were assigned to each class in the range
of 1-5. To the lowest value of the SPI and NDVI weight of 1 was assigned. Then, drought
severity was assessed for the months of April 1991, February 2001, February 2010, March
198
Drought risk assessment during the dry season in Tien river estuary
2018. And the result of the evaluation is that the Tien river estuary area only 3 zones exist
including ‘No drought', ‘slight drought’ and ‘moderate drought’. Figures 4 (a, b, c, d)
show the distribution of these classes for the months April 1991, February 2001, February
2010, March 2018. These images clearly give a scenario of drought prevalence and its
trend in the area. From 1991 - 2018, during the dry season, the area of moderate drought
areas decreased. But in 2010, the entire region experienced drought from light to moderate
drought. The drought characteristics of Tien river mouth are mainly in coastal areas, the
deeper inland the drought severity decreases, especially in coastal areas of Tra Vinh and
Ben Tre provinces.
3. Conclusions
Under the impact of climate change, weather patterns are varied changing, the
drought situation in the Tien river estuary area is increasingly complicated due to lack of
rainfall and increasingly scarce water resources. From this study, it can be concluded as follows:
- The combination of the SPI index and NDVI to assess drought risk in the Tien river
estuary area shows the synthesis and increase the accuracy, close to the reality of the
research results.
- In the area of Tien river estuary, drought is more serious in coastal areas, the deeper
inland, the more severe the level of drought is reduced.
- Up to 2018, during the dry season of Tien river estuary area, there is only slight and
moderate drought.
- Of the 3 provinces in the Tien estuary area, drought is strong in the coastal areas of
Ben Tre and Tra Vinh provinces.
Acknowledgment. This research receives support from the Ministerial-Level project
entitled “Developing meteorological drought scenarios for sustainable socio-economic
development in Tien River estuary area (Mekong Delta) in the context of climate change”.
The project code B2019-SPH-03.
REFERENCES
[1] Hayes, M. J., Svoboda, M. D., Wilhite, D. A., Vanyarkho, O. V, 1999. Monitoring
the 1996 Drought Using the Standardized Precipitation Index. Bulletin of the
American Meteorological Society.
[2] Lloyd-Hughes, B., Saunders, M. A., 2002. A drought climatology for Europe, Int. J.
Climatol., vol. 22, pp. 1571-1592, doi: 10.1002/joc.846.
[3] Loukas, A., Vasiliades, L., 2004. Probabilistic analysis of drought spatiotemporal
characteristics in Thessaly region, Greece, Nat. Hazards Earth Syst. Sci., Vol. 4,
pp. 719-731, doi: 10.5194/nhess-4-719-2004.
[4] Chopra, P., 2006. Drought Risk Assessment Using Remote Sensing and GIS: A Case
Study of Gujarat, International Institute for Geo-information Science and Earth
Observation, Enschede, The Netherlands.
[5] Birhanu Gedif Bahir, A., Addisu Bahir, S., Venkata Suryabhagavan, K., 2014.
Drought Risk Assessment using Remote Sensing and GIS: The Case of Southern
199
Dao Ngoc Hung and Nguyen Thanh Luan
Zone, Tigray Region, Ethiopia African Civet Habitat Mapping and Modeling Using
Remote Sensing and GIS Technologies in Illubabora, Ethiopia View project, no.
January, [Online]. Available: />[6] Le Thi Thu Hien, 2013. Applying the vegetation index (NDVI) of Landsat image to
assess the desertification of Binh Thuan province, Journal of Earth Sciences, Vol.
35, pp. 357-363.
[7] Trinh Le Hung, Dao Khanh Hoai, 2015. Application of Remote Sensing Assessing
Han Drought Risk in Bac Binh District, Binh Thuan Province, vol. 5, pp. 128-139.
[8] Nguyen Dang Tinh, 2011. Determining the ability and assessing the level of
meteorological drought in the Mekong Delta, pp. 14-21.
[9] Dao Ngoc Hung, Tran Van Thuong, Nguyen Trong Hieu, 2017. The spatial
distribution of drought index in the dry season in Tien Giang province under
representative concentration pathways scenarios 4.5 and 8.5, Disaster Adv., Vol. 10,
No. 9, pp. 27-33, doi: 10.1017/CBO9781107415324.004.
[10] Aziz, A. et al., 2018. Assessment of drought conditions using HJ-1A/1B data: A case
study of Potohar region, Pakistan, Geomatics, Nat. Hazards Risk, Vol. 9, No. 1,
pp. 1019-1036, doi: 10.1080/19475705.2018.1499558.
200