Racial differences in six major subtypes of melanoma: Descriptive epidemiology
Bạn đang xem bản rút gọn của tài liệu. Xem và tải ngay bản đầy đủ của tài liệu tại đây (1.02 MB, 19 trang )
Wang et al. BMC Cancer (2016) 16:691
DOI 10.1186/s12885-016-2747-6
RESEARCH ARTICLE
Open Access
Racial differences in six major subtypes of
melanoma: descriptive epidemiology
Yu Wang1, Yinjun Zhao2 and Shuangge Ma1,2,3*
Abstract
Background: Melanoma accounts for the majority of skin cancer deaths. It has over thirty different subtypes.
Different races have been observed to differ in multiple aspects of melanoma.
Methods: SEER (Surveillance, Epidemiology, and End Results) data on six major subtypes, namely melanoma in situ
(MIS), superficial spreading melanoma (SSM), nodular melanoma (NM), lentigo maligna melanoma (LMM), acral
lentiginous melanoma malignant (ALM), and malignant melanoma NOS (NOS), were analyzed. The racial groups
studied included NHW (non-Hispanic white), HW (Hispanic white), Black, and Asian/PI (Pacific Islanders). Univariate
and multivariate analysis was conducted to quantify racial differences in patients’ characteristics, incidence,
treatment, and survival.
Results: Significant racial differences are observed in patients’ characteristics. For all subtypes except for ALM,
NHWs have the highest incidence rates, followed by HWs, while Blacks have the lowest. For ALM, HWs have the
highest rate, followed by NHWs. In stratified analysis, interaction between gender and race is observed. For the first
five subtypes and localized and regional NOS, the dominating majority of patients had surgery, while for distant
NOS, the distribution of treatment is more scattered. Significant racial differences are observed for distant ALM and
NOS. For MIS, SSM, NM, LMM, and ALM, there is no significant racial difference in survival. For NOS, significant racial
differences in survival are observed for the localized and regional stages, with NHWs having the best and Blacks
having the worst five-year survival rates.
Conclusions: Racial differences exist for the six major melanoma subtypes in the U.S. More data collection and
analysis are needed to fully describe and interpret the differences across racial groups and across subtypes.
Keywords: Melanoma, Racial difference, Subtype, SEER
Abbreviations: ALM, Acral lentiginous melanoma malignant; Asian/PI, Asian and Pacific Islanders; HW, Hispanic
white; LMM, Lentigo maligna melanoma; MIS, Melanoma in situ; NHW, Non-Hispanic white; NM, Nodular melanoma;
NOS, Malignant melanoma NOS; SSM, Superficial spreading melanoma
Background
Melanoma is the most dangerous type of skin cancer. In
2015, it is estimated that there were 73,870 new cases,
and an estimated 9,940 people died of this disease [1]. It
represents 4.5 % of all new cancer cases. The incidence
of melanoma has been steadily rising since 1975 in the
U.S. [2]. Melanoma has over thirty different subtypes
with significantly different behaviors. In this article, the
* Correspondence:
1
School of Statistics and The center for Applied Statistics, Renmin University
of China, 59 Zhongguancun Ave., Beijing 100872, China
2
School of Public Health, Yale University, 60 College ST, LEPH 206, New
Haven, CT 06520, USA
Full list of author information is available at the end of the article
focus is on the following six most major subtypes.
Melanoma in site (MIS) is an early form of melanoma
with atypical melanocytes confined to the epidermis.
Superficial spreading melanoma (SSM) is more common
for the 30–50 years old, often on the trunk, and in
women often on the legs. Nodular melanoma (NM) is
more common for the 40–60 years old and twice as common in men. It has no horizontal growth phase and rapid
vertical growth. Lentigo maligna melanoma (LMM) is
more common for the 50–80 years old, especially with
sun-damaged skin. It develops on the face in 90 % of
cases. Acral lentiginous melanoma (ALM) presents up to
75 % of melanomas in non-Caucasian patients and occurs
© 2016 The Author(s). Open Access This article is distributed under the terms of the Creative Commons Attribution 4.0
International License ( which permits unrestricted use, distribution, and
reproduction in any medium, provided you give appropriate credit to the original author(s) and the source, provide a link to
the Creative Commons license, and indicate if changes were made. The Creative Commons Public Domain Dedication waiver
( applies to the data made available in this article, unless otherwise stated.
Wang et al. BMC Cancer (2016) 16:691
on acral surfaces. The last major subtype studied is malignant melanoma, NOS.
It has been suggested that there exist racial differences
in multiple aspects of melanoma. Overall, Whites have a
higher risk and poorer prognosis. Melanoma occurs
more commonly in unusual anatomic sites (e.g., palms
and soles) in minority populations than in Whites [3].
With rare occurrence and unusual presentation, the
diagnosis of melanoma is often delayed in minorities,
leading to more advanced stages. A few studies have
been conducted, examining racial difference in melanoma. Examples include that by Du and others [4], which
linked the NLMS (National Longitudinal Mortality Studies) and SEER (Surveillance, Epidemiology, and End Results) databases and examined the effects of individuallevel socioeconomic factors on racial disparities in receiving treatment and survival. Another study examined
racial differences in overall and melanoma-specific survival, stratified by receipt of surgical treatment and by
specific types of surgical treatment [5]. Cormier and
others [6] analyzed SEER data and quantified racial differences in clinicopathologic factors and survival for cutaneous melanoma patients. Results in the literature
have not always been consistent. For example, Reintgen
and others [7] reported differences in stage-specific
melanoma outcomes between Blacks and Whites, however, Hemmings and others [8] reported no differences
in outcomes in non-Whites versus Whites who were
stratified by stage at initial diagnosis.
Despite the aforementioned efforts, to date, racial
differences in melanoma still have not received sufficient attention. The goal of this study is to fill this
knowledge gap and systematically describe racial
differences for the six most major subtypes of melanoma using SEER data. Studying racial difference can
assist better diagnosis, tailored treatment, and elimination of racial disparity. Analyzing and directly comparing multiple subtypes can provide valuable insights
beyond single-subtype analysis [9]. This study differs
from and complements the existing literature in multiple aspects. First, it analyzes the six major subtypes
separately and can better accommodate cancer heterogeneity than studies that analyze melanoma overall
[10]. Second, it analyzes patient characteristics, incidence, treatment, as well as survival for four major racial groups, and can be more comprehensive than
those that focus on one specific aspect and fewer
racial groups [5]. Third, different subtypes are analyzed on the same ground using the same techniques.
Some of the existing studies have also conducted subtype analysis [9]. However, as they analyzed different
study populations and adopted different statistical
techniques, the results so generated may not be fully
comparable.
Page 2 of 19
Methods
Source population
The population-based sample was obtained from SEER
(Surveillance, Epidemiology, and End Results) [11], which
is the most comprehensive population-based cancer database in the U.S., containing data from eighteen regional
and state registries. SEER has multiple registry groupings
for analysis, which cover different numbers of regions and
different time period. SEER 9, 13, and 18, which are analyzed in this study, cover approximately 9.5, 14, and 28 %
of the U.S. population, respectively [12].
For each case, the first matching record was identified
for analysis. Incident cases of melanoma of the skin – defined using ICD-O-3 site codes C440-449 and histology
codes 8720-8790 – were selected. The histology codes
were grouped for analysis as follows: MIS (ICD-O-3 code
8720/2), NM (ICD-O-3 code 8721/3), LMM (ICD-O-3
code 8742/3), SSM (ICD-O-3 code 8743/3), ALM (ICDO-3 code 8744/3), and NOS (ICD-O-3 code 8720/3).
Different registry groupings were used for different
analysis to maximize sample size. Specifically, for the
analysis of patients’ clinicopathologic features, SEER 9
contains data on cancers diagnosed between 1973 and
2011. Information is available on gender, marital status,
age at diagnosis, age group, anatomic site, thickness of
tumor, presence of satellite nodules, ulceration, lymph
node extension, stage, treatment, and type of surgery.
More details are available in Table 1. The variable “anatomic sites” is defined using ICD-O-3 [13]. Anatomic
body sites include skin of the face, head, and neck
(C44.0–44.4), trunk (C44.5, including back, abdomen,
and chest), upper extremity (C44.6), lower extremity
(C44.7), and all “other or unknown” body sites which are
combined into a single category. Four variables, including “satellite tumors” (1973–1982), “4-Digit Extent of
Disease (EOD 4)-extension” (1983–1987), “10-Digit Extent of Disease (EOD 10)-extension” (1988–2003) and
“clinical stage (CS) lymph nodes” (2004), are recoded to
form the three-category satellite nodule variable. Three
variables, including “type of melanoma” (1973–1982),
“extension” (1988–2003), and “CS site specific factor 2
ulceration” (2004), are recoded to form the threecategory skin ulceration variable. Skin ulceration status
was not coded between 1983 and 1987, therefore, all
1983–1987 cases are coded as having “unknown” for ulceration. Five variables, including “regional lymph node
involvement” (1973–1982), “distant lymph nodes”
(1973–1982), “EOD 4 lymph nodes” (1983–1997), “EOD
10 lymph nodes” (1988–2003), “CS lymph nodes” (2004),
are recoded to categorize the extent of lymph node involvement. Treatment is analyzed both as a patient’s
characteristic and as a cancer response variable. For melanoma, removal by surgery is the most common treatment. Other options include immunotherapy, biologic
Melanoma in situ
Superficial spreading melanoma
NHW
(n = 87852)
HW
(n = 1890)
Black
(n = 222)
Asian/PI
(n = 180)
Male
54.7
36.0
45.0
44.6
Female
45.3
64.0
55.0
55.4
Gender
P
Nodular melanoma
NHW
(n = 84790)
HW
(n = 1993)
Black
(n = 218)
Asian/PI
(n = 364)
53.3
35.6
42.2
49.2
46.7
64.4
57.8
50.8
<0.001
Marital Status
P
NHW
(n = 19260)
HW
(n = 689)
Black
(n = 106)
Asian/PI
(n = 160)
61.6
51.8
44.3
56.3
38.4
48.2
55.7
43.8
<0.001
<0.001
<0.001
<0.001
<0.001
Single
12.6
15.4
22.1
18.8
15.4
18.8
26.3
23.9
14.9
21.3
37.0
17.6
Married
73.9
70.8
54.7
67.7
71.2
67.7
48.1
62.7
63.5
58.5
34.8
62.0
Separated/
divorced/
widowed
13.5
13.8
23.3
13.5
13.4
13.5
25.6
13.4
21.6
20.2
28.3
20.4
60.5 ± 15.9
55.6 ± 16.9
59.2 ± 16.2
55.0 ± 17.9
54.7 ± 16.7
49.2 ± 16.5
56.0 ± 17.7
52.7 ± 17.3
62.1 ± 17.7
55.9 ± 19.1
62.7 ± 18.1
60.3 ± 20.1
Face/head/
neck
25.7
28.6
18.0
22.3
13.7
14.4
9.6
11.0
22.9
22.5
15.1
16.9
Trunk
30.9
24.1
12.6
26.0
39.0
33.9
29.8
36.0
32.1
28.3
18.9
26.3
Upper
Extremity
25.9
23.9
24.8
22.8
25.7
22.9
17.0
18.7
27.1
20.8
12.3
13.8
Lower
Extremity
17.0
23.0
44.1
29.0
21.0
28.4
42.2
33.5
17.4
28.0
51.9
43.1
Other
0.6
0.5
0.5
0
0.5
0.4
1.4
0.8
0.6
0.4
1.9
0
0.80 ± 1.83
0.78 ± 1.85
1.02 ± 1.31
0.68 ± 0.88
0.92 ± 1.09
1.01 ± 1.20
1.51 ± 2.11
1.36 ± 1.96
3.27 ± 2.51
3.93 ± 3.02
4.22 ± 3.18
4.23 ± 3.04
No
-
-
-
-
97.0
97.2
95.9
95.3
93.5
93.9
88.7
95.6
Yes
-
-
-
-
0.6
1.1
0.9
0.8
3.6
3.5
4.7
3.1
Unknown
-
-
-
-
2.4
1.7
3.2
3.8
3.0
2.6
6.6
1.3
59.8
56.0
50.9
56.3
Age at
diagnosis
Anatomic Site
Thickness of
tumor (mm)
<0.001
<0.001
0.980
<0.001
Satellite nodules
<0.001
0.242
92.2
91.7
94.1
91.1
87.6
83.5
87.4
0.001
Yes
0.5
0.4
0.9
0
4.9
6.0
8.3
6.6
31.4
38.3
37.7
35.6
Unknown
7.3
7.9
5.0
8.9
8.4
6.4
8.3
6.0
8.8
5.7
11.3
8.1
Lymph node
extension
0.866
<0.001
0.280
0.001
86.7
<0.001
<0.001
0.012
Ulceration
No
<0.001
P
Wang et al. BMC Cancer (2016) 16:691
Table 1 Patients’ characteristics and clinicopathologic features
<0.001
<0.001
99.9
99.8
99.5
100.0
72.7
78.8
67.0
76.9
63.3
60.4
52.8
58.1
Regional
0
0
0
0
3.2
4.7
5.0
6.6
16.6
25.3
18.9
25.0
Distant
0
0
0
0
0.1
0.2
0
0
0.9
2.0
5.7
1.9
Unknown
0.1
0.2
0.5
0
24.0
16.3
28.0
16.5
19.2
12.3
22.6
15.0
Page 3 of 19
None
Stage
In situ
0.996
<0.001
<0.001
100.0
100.0
100.0
100.0
-
-
-
-
-
-
-
-
Localized
-
-
-
-
92.7
90.8
86.7
87.9
62.1
51.1
43.4
52.5
Regional
-
-
-
-
5.4
7.4
9.6
9.6
32.0
40.1
38.7
41.3
Distant
-
-
-
-
0.4
0.8
0.9
0.8
4.1
7.1
14.2
5.6
Unstaged
0.0
-
-
-
1.5
1.1
2.8
1.6
1.9
1.7
3.8
0.6
Treatment
0.152
0.005
0.033
No treatment
4.1
5.8
5.0
4.2
1.6
2.0
1.4
2.2
1.5
1.6
1.9
1.3
Surgery
95.1
93.7
94.6
95.3
97.1
97.1
95.4
95.6
94.7
94.8
90.6
93.8
Radiation
0.1
0.1
0
0.2
0.1
0
0.5
0
0.2
0
0
1.3
Radiation &
Surgery
0.4
0.3
0
0
0.9
0.8
1.4
1.9
3.3
3.2
5.7
3.1
Unknown
0.2
0.2
0.5
0.2
0.4
0.1
1.4
0.3
0.4
0.4
1.9
0.6
No surgery
4.2
5.9
5.1
4.5
1.7
2.1
1.6
2.3
1.8
1.7
2.0
2.1
Biopsy
65.8
63.9
51.6
55.8
43.0
43.6
37.0
42.9
32.5
35.1
34.3
32.9
Wide excision
29.8
29.9
40.0
39.3
55.0
53.5
59.3
54.2
64.3
57.3
57.6
60.3
Amputation
0.1
0.2
2.8
0.5
0.1
0.4
2.1
0.3
0.5
3.5
3.0
4.1
Surgery NOS
0.1
0.1
0.5
0
0.3
0.5
0
0.3
0.9
2.4
3.0
0.7
300.7 ± 3.0
355.9 ± 13.1
287.8 ± 15.3
325.6 ± 19.6
<0.001
298.7 ± 1.2
305.8 ± 6.3
277.1 ± 17.5
300.2 ± 13.6
0.001
168.5 ± 1.8
160.3 ± 9.6
106.9 ± 14.3
145.8 ± 16.6
0.033
P
P
P
Type of surgery
Survival
time (month)
<0.001
Lentigo maligna melanoma
<0.001
Acral lentiginous melanoma, malignant
NHW
(n = 17226)
HW
(n = 250)
Black
(n = 46)
Asian/PI
(n = 69)
Male
67.2
54.4
54.3
56.5
Female
32.8
45.6
45.7
43.5
Gender
<0.001
Malignant melanoma, NOS
NHW
(n = 1822)
HW
(n = 300)
Black
(n = 215)
Asian/PI
(n = 168)
46.5
46.3
40.9
53.0
53.5
53.7
59.1
47.0
<0.001
Marital Status
NHW
(n = 127924)
HW
(n = 3807)
Black
(n = 788)
Asian/PI
(n = 861)
57.5
42.6
48.4
48.5
42.5
57.4
51.6
51.5
0.138
0.283
<0.001
<0.001
<0.001
Single
8.3
11.6
6.3
7.4
12.9
15.2
17.3
10.2
14.8
20.5
28.0
16.2
Married
71.4
71.1
59.4
74.1
65.7
59.8
42.6
67.5
68.8
63.1
42.3
66.8
Separated/
divorced/
widowed
20.3
17.4
34.4
18.5
21.5
25.0
40.1
22.3
16.4
16.3
29.7
17.0
69.7 ± 12.6
68.0 ± 14.5
65.3 ± 13.2
66.3 ± 16.8
63.6 ± 16.3
61.4 ± 16.8
65.5 ± 16.4
64.1 ± 16.1
58.9 ± 17.2
53.5 ± 18.2
60.3 ± 18.5
57.0 ± 19.3
Age at diagnosis
0.001
<0.001
0.034
0.010
<0.001
<0.001
Face/head/
neck
60.3
70.4
37.0
46.4
1.8
1.3
0.5
0
18.6
17.5
9.9
10.6
Trunk
15.3
11.6
8.7
15.9
2.2
1.0
0
0
32.2
24.4
15.4
20.0
Page 4 of 19
Anatomic Site
Wang et al. BMC Cancer (2016) 16:691
Table 1 Patients’ characteristics and clinicopathologic features (Continued)
Upper
Extremity
19.3
11.6
6.5
14.5
20.2
16.3
15.3
19.0
23.7
19.7
11.3
17.5
Lower
Extremity
4.4
6.0
45.7
23.2
75.6
81.0
83.7
79.8
17.5
26.6
43.8
33.6
Other
0.6
0.4
2.2
0
0.70 ± 1.00
0.73 ± 0.85
1.98 ± 2.59
0.96 ± 1.31
Thickness of
tumor (mm)
Satellite
nodules
<0.001
0.2
0.3
0.5
1.2
2.12 ± 2.08
2.38 ± 2.27
2.53 ± 2.39
2.99 ± 2.47
<0.001
<0.001
8.0
11.7
19.7
18.4
1.10 ± 1.47
1.53 ± 1.95
2.42 ± 2.63
1.75 ± 2.08
0.016
<0.001
No
96.1
97.2
89.1
89.9
94.5
92.7
93.5
86.9
89.3
85.5
79.1
80.8
Yes
0.5
0
8.7
2.9
2.8
3.7
3.7
6.5
0.8
1.1
2.7
1.5
Unknown
3.4
2.8
2.2
7.2
2.7
3.7
2.8
6.5
9.9
13.4
18.3
17.7
No
88.8
85.6
67.4
82.6
70.5
65.3
62.3
60.7
78.0
72.2
60.0
65.5
Yes
2.9
2.8
8.7
4.3
24.6
29.0
33.0
33.3
6.6
9.7
15.1
10.0
Unknown
8.3
11.6
23.9
13.0
4.8
5.7
4.7
6.0
15.3
18.2
24.9
24.5
Ulceration
<0.001
Lymph node
extension
None
0.025
<0.001
75.8
75.6
63.0
69.6
<0.001
0.001
68.0
70.3
69.3
60.7
<0.001
71.6
66.6
49.4
54.1
Regional
0.7
1.2
6.5
4.3
14.9
20.0
11.6
23.2
4.8
8.6
14.1
9.3
Distant
0.1
0
2.2
1.4
0.9
41.3
1.4
0
0.8
1.2
2.7
2.3
Unknown
23.4
23.2
28.3
24.6
16.2
8.3
17.7
16.1
22.8
23.6
33.9
34.3
Stage
<0.001
0.005
<0.001
In situ
-
-
-
-
-
-
-
-
-
-
-
-
Localized
93.5
93.2
73.9
85.5
67.7
60.7
66.5
53.0
77.3
66.3
44.7
57.7
Regional
3.2
3.2
17.4
8.7
27.2
31.3
26.5
39.9
8.8
14.6
21.1
15.3
Distant
0.3
0.4
4.3
1.4
3.3
4.3
4.7
5.4
6.3
10.3
20.6
16.4
Unstaged
2.9
3.2
4.3
4.3
1.8
3.7
2.3
1.8
7.7
8.8
13.7
10.6
Treatment
0.016
0.028
<0.001
2.1
4.0
4.3
1.4
1.8
2.7
3.3
0.6
6.1
11.2
15.4
12.1
Surgery
96.2
94.8
93.5
92.8
96.8
94.3
94.4
94.6
88.7
82.5
73.0
78.0
Radiation
0.1
0
0
1.4
0.2
0.3
0
0.6
1.7
2.0
4.8
3.9
Radiation &
Surgery
0.9
0.4
0
2.9
1.3
2.3
2.3
3.6
2.5
3.6
4.1
4.4
Unknown
0.6
0.8
2.2
1.4
181.9 ± 2.0
188.7 ± 14.2
153.0 ± 21.9
237.3 ± 25.1
0.138
0
0.3
0
0.6
158.4 ± 4.0
154.4 ± 10.4
133.4 ± 9.9
130.1 ± 12.1
0.023
Cancers diagnosed 1973-2011 in the SEER 18 database. For a continuous variable, mean ± standard deviation; For a categorical variable, percentage
1.1
0.7
2.8
1.5
243.0 ± 0.9
237.9 ± 5.8
144.6 ± 8.9
215.3 ± 10.1
<0.001
Page 5 of 19
No treatment
Survival
time (month)
<0.001
Wang et al. BMC Cancer (2016) 16:691
Table 1 Patients’ characteristics and clinicopathologic features (Continued)
Wang et al. BMC Cancer (2016) 16:691
therapy, radiation, chemotherapy, and others. SEER contains information on surgery and radiation but no other
treatments. As a result, patients in the “no surgery or
radiation” category might receive other types of treatment, but this information is not available. For the analysis of incidence, SEER 13 contains detailed race and
incidence information for cancers diagnosed between
1992 and 2011. For the analysis of survival, SEER 18
contains information for cancers diagnosed between
1973 and 2006 and followed up to 12/31/2011.
Statistical analysis
Data on the six subtypes were analyzed separately. In the
analysis of patients’ characteristics, Chi-squared tests and
ANOVA were used to compare across racial groups for
categorical and continuous variables respectively. Ageadjusted incidence rates were computed using SEER*Stat
and the U.S. Census 2000 data for age-standardization.
Five-year survival rates were calculated using SEER*Stat
and an actuarial method. Treatment was analyzed using
multivariate logistic regression, adjusted for age at diagnosis, gender, marital status, anatomic site, thickness of
tumor, and ulceration. Survival was analyzed using
multivariate Cox regression, adjusted for age at diagnosis, gender, marital status, anatomic site, thickness of
tumor, ulceration, and treatment. Analysis not achievable using SEER software was conducted using SAS 9.3.
Results
Patients’ clinicopathologic characteristics
Results are shown in Table 1. Data on 376,797 patients
are analyzed. For all variables of interest, significant racial differences are observed for multiple or all subtypes,
and the patterns vary across subtypes. Specifically, for
MIS, there are more male patients for NHW but more
females for other races (p-value < 0.001). For NS, there
are more male patients for NHW and HW but not the
other two races. For LMM, there are more male patients
across all races, although the percentages differ (p-value
< 0.001). Significant racial differences in marital status
are observed for all subtypes expect for LMM. Blacks
have consistently lower rates of being married. Age at
diagnosis significantly differs across races for all subtypes. For MIS and LMM, Asians/PIs and Blacks have
the lowest age at diagnosis. For the other four subtypes,
HWs have the lowest. For all subtypes, there are significant racial differences in anatomic site, and the patterns
differ across subtypes. For example for MIS, the most
prevalent are trunk (NHW, 30.9 %), face/head/neck
(HW, 28.6 %), lower extremity (Black, 44.1 %), and lower
extremity (Asian/PI, 29.0 %), respectively. For ALM,
lower extremity is the dominating category for all races,
although the percentages differ. For MIS, there is no racial difference in thickness of tumor. For NM and ALM,
Page 6 of 19
Asians/PIs have the thickest tumors, whereas for the
other three subtypes, Blacks have the thickest. For the
five subtypes with satellite nodule definition, the dominating majority of patients have no satellite nodule.
The percentages differ significantly across races except
for NOS. The distribution of skin ulceration differs significantly across races for all subtypes except for MIS,
but the patterns differ across subtypes. For example,
for SMM, the percentages of “No Ulceration” are 86.7,
87.6, 83.5, and 87.4 % for the four races, whereas for
NOS, the corresponding percentages are 78.0, 72.2,
60.0, and 65.5 %, respectively. For MIS, almost all patients have no lymph node extension, and thus there is
no racial difference. For the other five subtypes, there
are significant racial differences in lymph node extension. For SMM, there are more HWs without lymph
node extension, whereas there are more NHWs for
NM. Except for MIS, significant racial differences are
observed in stage, with more NHWs having localized
tumors. The dominating majority of patients were
treated with surgery, with significant racial differences
except for MIS. For all subtypes except for LMM, there
are significant racial differences in survival time. The
racial groups that have the longest survival are HW for
MIS and SSM and NHW for NM, ALM, and NOS.
Incidence
Results are shown in Table 2. The sample sizes are
49,313 (MIS), 46,860 (SSM), 9,639 (NM), 9,912 (LMM),
1,506 (ALM), and 62,622 (NOS), respectively. For the six
subtypes, the overall incidence rates per 100,000 personyears are 6.60, 6.18, 1.30, 1.37, 0.20, and 8.36, respectively. For all subtypes except for ALM, NHWs have the
highest age-adjusted incidence rates, followed by HWs,
while Blacks have the lowest. In the stratified analysis by
age and gender, the same pattern holds. In addition, it is
observed that incidence increases with age. For most
cases, males have higher incidence, with exceptions including HWs with MIS and SSM. For ALM overall,
HWs have the highest incidence rate (0.24), followed by
NHWs (0.21), while Asians/PIs have the lowest rate
(0.17). In the stratified analysis by age, NHWs have the
highest rate for the <40 years age group, while HWs
have the highest rates for the 40–64 and 65+ years
groups. When stratified by gender, HWs have the highest rates for both groups. The incidence of ALM also increases with age. The incidence rates are similar for
male and female.
Treatment
The analysis is conducted on 90,183 (MIS), 85,813 (SSM),
19,779 (NM), 16,987 (LMM), 2,454 (ALM), and 122,314
(NOS) samples, and summary results are shown in Table 3.
Detailed logistic regression analysis results are available
Wang et al. BMC Cancer (2016) 16:691
Page 7 of 19
Table 2 Age-adjusted incidence rates per 100,000 person-years, stratified by age and gender
NHW
HW
Black
Asian/PI
Total
All ages
9.19 (9.11–9.28)
1.26 (1.18–1.35)
0.16 (0.13–0.20)
0.34 (0.30–0.38)
6.60 (6.54–6.66)
<40 years
2.18 (2.12–2.24)
0.21 (0.18–0.24)
0.03 (0.02–0.05)
0.10 (0.08–0.13)
1.31 (1.27–1.34)
40–64 years
13.97 (13.78–14.16)
1.61 (1.47–1.76)
0.19 (0.14–0.26)
0.48 (0.40–0.57)
9.82 (9.69–9.94)
65+ years
29.35 (28.93–29.77)
5.14 (4.63–5.70)
0.67 (0.49–0.90)
1.07 (0.87–1.31)
22.72 (22.41–23.04)
Male
10.71 (10.58–10.85)
1.22 (1.09–1.35)
0.19 (0.14–0.26)
0.35 (0.29–0.42)
7.95 (7.85–8.05)
Female
8.33 (8.22–8.45)
1.37 (1.26–1.48)
0.15 (0.11–0.19)
0.34 (0.29–0.39)
5.77 (5.70–5.85)
Melanoma in situ
Superficial spreading melanoma
All ages
9.05 (8.96–9.13)
1.12 (1.05–1.19)
0.15 (0.12–0.18)
0.31 (0.27–0.35)
6.18 (6.13–6.24)
<40 years
3.35 (3.27–3.42)
0.35 (0.32–0.39)
0.04 (0.02–0.06)
0.11 (0.08–0.14)
1.96 (1.92–2.00)
40–64 years
14.73 (14.54–14.93)
1.81 (1.66–1.97)
0.20 (0.15–0.27)
0.47 (0.39–0.56)
10.04 (9.91–10.17)
65+ years
21.09 (20.74–21.45)
2.91 (2.53–3.33)
0.51 (0.35–0.71)
0.81 (0.64–1.02
15.93 (15.67–16.20)
Male
10.23 (10.10–10.37)
0.98 (0.88–1.09)
0.18 (0.13–0.24)
0.34 (0.28–0.41)
7.20 (7.11–7.29)
Female
8.27 (8.16–8.39)
1.29 (1.19–1.39)
0.13 (0.09–0.17)
0.29 (0.24–0.34)
5.49 (5.42–5.57)
All ages
1.80 (1.76–1.84)
0.49 (0.44–0.54)
0.06 (0.04–0.08)
0.14 (0.12–0.17)
1.30 (1.28–1.33)
<40 years
0.38 (0.35–0.40)
0.08 (0.06–0.10)
0.01 (0.00–0.02)
0.04 (0.02–0.06)
0.23 (0.21–0.24)
40–64 years
2.31 (2.24–2.39)
0.51 (0.43–0.60)
0.06 (0.03–0.10)
0.14 (0.10–0.19)
1.60 (1.55–1.65)
65+ years
6.98 (6.78–7.19)
2.26 (1.92–2.65)
0.31 (0.19–0.48)
0.63 (0.47–0.82)
5.46 (5.30–5.61)
Male
2.51 (2.45–2.58)
0.60 (0.51–0.70)
0.07 (0.04–0.12)
0.19 (0.14–0.24)
1.84 (1.80–1.89)
Female
1.26 (1.22–1.30)
0.42 (0.36–0.48)
0.05 (0.03–0.08)
0.11 (0.08–0.15)
0.91 (0.88–0.93)
Nodular melanoma
Lentigo maligna melanoma
All ages
1.87 (1.83–1.90)
0.23 (0.19–0.27)
0.02 (0.01–0.04)
0.06 (0.05–0.08)
1.37 (1.35–1.40)
<40 years
0.05 (0.04–0.06)
0.01 (0.00–0.01)
0.00
0.01 (0.00–0.02)
0.03 (0.03–0.04)
40–64 years
1.83 (1.77–1.90)
0.17 (0.13–0.23)
0.01 (0.00–0.04)
0.05 (0.03–0.09)
1.26 (1.22–1.31)
65+ years
10.11 (9.87–10.36)
1.38 (1.11–1.69)
0.16 (0.08–0.29)
0.33 (0.22–0.47)
7.69 (7.51–7.87)
Male
2.97 (2.90–3.04)
0.33 (0.26–0.41)
0.04 (0.02–0.08)
0.09 (0.06–0.13)
2.21 (2.16–2.26)
Female
1.05 (1.02–1.09)
0.17 (0.13–0.21)
0.01 (0.00–0.03)
0.04 (0.02–0.06)
0.77 (0.74–0.80)
0.19 (0.16–0.23)
0.17 (0.14–0.20)
0.20 (0.19–0.22)
Acral lentiginous melanoma, malignant
All ages
0.21 (0.20–0.22)
0.24 (0.21–0.28)
<40 years
0.04 (0.03–0.05)
0.02 (0.01–0.02)
0.02 (0.01–0.03)
0.02 (0.01–0.03)
0.03 (0.03–0.04)
40–64 years
0.25 (0.23–0.28)
0.26 (0.20–0.32)
0.21 (0.16–0.28)
0.17 (0.13–0.23)
0.24 (0.22–0.26)
65+ years
0.87 (0.80–0.95)
1.24 (0.99–1.54)
0.93 (0.71–1.20)
0.85 (0.67–1.07)
0.90 (0.84–0.96)
Male
0.22 (0.20–0.24)
0.25 (0.19–0.31)
0.22 (0.16–0.30)
0.20 (0.16–0.26)
0.22 (0.20–0.23)
Female
0.21 (0.19–0.23)
0.24 (0.20–0.30)
0.18 (0.14–0.22)
0.14 (0.11–0.18)
0.20 (0.18–0.21)
Malignant melanoma, NOS
All ages
11.73 (11.64–11.83)
2.25 (2.14–2.36)
0.51 (0.45–0.57)
0.66 (0.60–0.72)
8.36 (8.29–8.42)
<40 years
3.37 (3.30–3.44)
0.48 (0.44–0.53)
0.10 (0.07–0.13)
0.17 (0.14–0.21)
2.02 (1.98–2.07)
40–64 years
17.35 (17.14–17.56)
2.98 (2.78–3.18)
0.57 (0.48–0.67)
0.83 (0.72–0.94)
12.10 (11.96–12.24)
65+ years
35.91 (35.45–36.38)
8.46 (7.79–9.18)
2.22 (1.87–2.62)
2.42 (2.11–2.77)
27.92 (27.58–28.28)
Male
14.63 (14.47–14.79)
2.31 (2.13–2.49)
0.63 (0.53–0.75)
0.69 (0.61–0.79)
10.68 (10.57–10.80)
Female
9.70 (9.58–9.82)
2.30 (2.16–2.44)
0.43 (0.36–0.50)
0.64 (0.57–0.72)
6.74 (6.66–6.82)
Diagnosed in the period of 1992–2011 in the SEER 13 database. In each cell, estimate (95 % CI). Rates are age-standardized using the U.S. 2000 Census population
Wang et al. BMC Cancer (2016) 16:691
Page 8 of 19
Table 3 Treatment strategy, stratified by stage-at-diagnosis
NHW
HW
Black
Asian/PI
P-value
No treatment
3641 (4.2)
109 (5.8)
11 (5.0)
17 (4.2)
0.142
Surgery
83560 (95.3)
1770 (93.8)
210 (95.0)
385 (95.5)
Radiation
117 (0.1)
2 (0.1)
0
1 (0.2)
Radiation & Surgery
354 (0.4)
6 (0.3)
0
0
Melanoma in situ
In situ
Superficial spreading melanoma
Localized
Regional
Distant
No treatment
1106 (1.4)
38 (2.1)
3 (1.6)
8 (2.5)
Surgery
76782 (98.0)
1764 (97.5)
183 (97.9)
306 (95.6)
Radiation
16 (0.0)
0
0
0
Radiation & Surgery
440 (0.6)
7 (0.4)
1 (0.5)
6 (1.9)
No treatment
19 (0.4)
0
0
0
Surgery
4366 (95.4)
142 (96.6)
20 (95.2)
34 (97.1)
Radiation
4 (0.1)
0
0
0
Radiation & Surgery
188 (4.1)
5 (3.4)
1 (4.8)
1 (2.9)
No treatment
15 (4.2)
0
0
0
Surgery
259 (73.4)
12 (80.0)
1 (50.0)
3 (100.0)
Radiation
9 (2.5)
0
0
0
Radiation & Surgery
70 (19.8)
3 (20.0)
1 (50.0)
0
No treatment
149 (1.3)
5 (1.4)
2 (4.5)
1 (1.2)
Surgery
11613 (97.5)
344 (98.0)
42 (95.5)
81 (97.6)
Radiation
12 (0.1)
0
0
1 (1.2)
Radiation & Surgery
137 (1.2)
2 (0.6)
0
0
No treatment
41 (0.7)
2 (0.7)
0
0
Surgery
5792 (94.2)
259 (93.8)
39 (95.1)
63 (95.5)
Radiation
2 (0.0)
0
0
1 (1.5)
0.877
0.999
0.650
Nodular melanoma
Localized
Regional
Distant
Radiation & Surgery
312 (5.1)
15 (5.4)
2 (4.9)
2 (3.0)
No treatment
42 (5.3)
4 (8.2)
0
0
Surgery
553 (70.3)
40 (81.6)
11 (73.3)
6 (66.7)
Radiation
9 (1.1)
0
0
0
Radiation & Surgery
183 (23.3)
5 (10.2)
4 (26.7)
3 (33.3)
0.585
0.571
0.346
Lentigo maligna melanoma
Localized
Regional
Distant
No treatment
301 (1.9)
7 (3.0)
1 (2.9)
0
Surgery
15617 (97.4)
224 (96.6)
33 (97.1)
56 (96.6)
Radiation
5 (0.0)
0
0
1 (1.7)
Radiation & Surgery
104 (0.6)
1 (0.4)
0
1 (1.7)
No treatment
4 (0.7)
0
1 (12.5)
0
Surgery
513 (92.9)
8 (100.0)
7 (87.5)
5 (83.3)
Radiation
-
-
-
-
Radiation & Surgery
35 (6.3)
0
0
1 (16.7)
No treatment
2 (3.4)
0
0
0
Surgery
40 (69.0)
1 (100.0)
2 (100.0)
1 (100.0)
Radiation
2 (3.4)
0
0
0
0.986
0.759
0.992
Wang et al. BMC Cancer (2016) 16:691
Page 9 of 19
Table 3 Treatment strategy, stratified by stage-at-diagnosis (Continued)
Radiation & Surgery
14 (24.1)
0
0
0
No treatment
23 (1.9)
3 (1.6)
5 (3.5)
1 (1.1)
Surgery
1201 (97.3)
178 (97.8)
138 (96.5)
87 (97.8)
Radiation
2 (0.2)
0
0
0
Acral lentiginous melanoma, malignant
Localized
Regional
Distant
Radiation & Surgery
8 (0.6)
1 (0.5)
1 (0.5)
1 (1.1)
No treatment
3 (0.6)
0
1 (1.8)
0
Surgery
481 (97.2)
89 (94.7)
54 (94.7)
65 (97.0)
Radiation
-
-
-
-
Radiation & Surgery
11 (2.2)
5 (5.3)
2 (3.5)
2 (3.0)
No treatment
1 (1.6)
1 (7.7)
0
0
Surgery
54 (88.5)
11 (84.6)
7 (70.0)
5 (55.6)
Radiation
1 (1.6)
1 (7.7)
0
1 (11.1)
Radiation & Surgery
5 (8.2)
0
3 (33.3)
3 (30.0)
No treatment
1950 (2.0)
84 (3.3)
14 (4.0)
18 (3.6)
Surgery
95929 (97.4)
2425 (96.2)
330 (94.6)
475 (95.6)
Radiation
70 (0.1)
0
2 (0.6)
0
Radiation & Surgery
591 (0.6)
13 (0.5)
3 (0.9)
4 (0.8)
0.841
0.301
0.022
Malignant melanoma, NOS
Localized
Regional
Distant
No treatment
882 (7.9)
52 (9.4)
2 (1.2)
7 (5.3)
Surgery
9397 (84.3)
451 (81.7)
153 (92.2)
116 (87.9)
Radiation
69 (0.6)
7 (1.3)
1 (0.6)
1 (0.8)
Radiation & Surgery
801 (7.2)
42 (7.6)
10 (6.0)
8 (6.1)
No treatment
2901 (37.5)
175 (44.9)
71 (46.1)
50 (37.6)
Surgery
2136 (27.6)
97 (24.9)
51 (33.1)
40 (30.1)
Radiation
1192 (15.4)
48 (12.3)
17 (11.0)
25 (18.8)
Radiation & Surgery
1501 (19.4)
70 (17.9)
15 (9.7)
18 (13.5)
<0.001
0.010
<0.001
Cancers diagnosed in the period of 1973–2011 in the SEER 18 database. In each cell, count (percentage). P-values were obtained from multivariate
logistic regression
from the authors. For the first five subtypes and localized and regional NOS, the dominating majority of
patients had surgery. For distant NOS, the distribution of treatment is: 38.0 % no surgery or radiation,
27.6 % surgery, 15.2 % radiation, and 19.1 % both radiation and surgery. In the multivariate logistic regression, there are no significant racial differences for
the first four subtypes and localized and regional
ALM. For the distant stage of ALM, the multivariate
logistic regression generates a significant p-value
(0.022). It is noted that this significance should be
interpreted with cautions because of the small counts.
For localized and regional NOS, significant differences
are observed across races. For localized, NHWs had
the highest rate of surgery (97.4 %), while Blacks had
the lowest (94.6 %). For regional, Blacks had the highest rate of surgery (92.2 %), while HWs had the lowest (81.7 %). For distant, there are many more
patients in the “no surgery or radiation treatment”
category, and there is significant difference across
races (p-value < 0.001).
Survival
The analysis is based on 70,898 (MIS), 74,490 (SSM),
16,286 (NM), 12,507 (LMM), 2,047 (ALM), and
100,865 (NOS) samples. The summary results are
shown in Table 4. Detailed multivariate Cox regression
analysis results are shown in Table 5 in Appendix. The
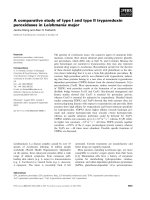
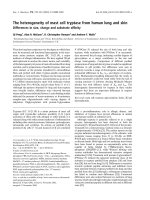
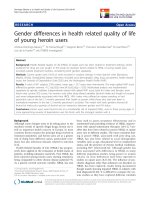
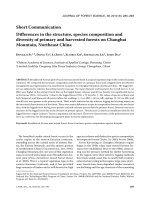
survival curves for up to five years are shown in Fig. 1
(all stages combined) and Fig. 2 (stratified by stage at
diagnosis). Note that for MIS, the five-year survival
rates are 100 % and thus not plotted. For SSM, the racial groups with the best five-year survival are Black
(localized, 100 %), HW (regional, 74.1 %), and HW
(distant, 46.8 %). For NS, the racial groups with the
best survival are NHW (localized, 80.6 %), Asian/PI
Wang et al. BMC Cancer (2016) 16:691
Page 10 of 19
Table 4 Five-year relative survival rates, stratified by stage-at-diagnosis
Total
NHW
HW
Black
Asian/PI
P-value
100.0
100.0
100.0
100.0
100.0
0.380
Melanoma in situ
In situ
Superficial spreading melanoma
Localized
99.2 (98.9–99.4)
99.0 (98.7–99.2)
98.2 (96.1–99.2)
100.0
94.0 (87.7–97.1)
0.844
Regional
71.5 (69.7–73.2)
71.4 (69.6–73.2)
74.1 (62.9–82.4)
67.5 (33.5–86.8)
60.7 (40.0–76.3)
0.623
Distant
33.8 (27.7–40.0)
33.0 (26.7–39.5)
46.8 (18.1–71.4)
0.0
33.7 (0.9–77.9)
0.987
Localized
80.6 (79.5–81.7)
80.6 (79.4–81.7)
79.7 (72.4–85.4)
63.9 (39.0–80.8)
72.9 (56.8–83.8)
0.403
Regional
55.1 (53.4–56.7)
55.3 (53.6–57.0)
47.6 (39.5–55.1)
46.5 (24.7–65.7)
62.9 (46.9–75.3)
0.119
Distant
17.1 (13.9–20.6)
16.2 (12.9–19.7)
34.4 (17.6–51.9)
27.1 (4.9–56.8)
13.3 (0.7–44.3)
0.101
Nodular melanoma
Lentigo maligna melanoma
Localized
100.0
100.0
97.3 (61.0–99.8)
100.0
96.1 (53.3–99.8)
0.697
Regional
73.2 (65.6–79.4)
75.6 (67.7–81.8)
58.1 (3.7–91.5)
19.1 (0.8–56.9)
31.7 (0.7–76.9)
0.151
Distant
26.1 (11.3–43.8)
24.2 (9.5–42.4)
0.0
69.4 (0.0–99.2)
0.0
0.508
Acral lentiginous melanoma, malignant
Localized
96.0 (92.6–97.8)
97.5 (92.4–99.2)
95.0 (75.3–99.1)
91.9 (74.9–97.6)
87.4 (70.7–94.9)
0.266
Regional
58.4 (52.9–63.5)
60.3 (53.5–66.5)
50.6 (37.0–62.7)
49.8 (29.3–67.3)
62.1 (44.5–75.5)
0.447
Distant
15.8 (7.7–26.5)
13.8 (4.8–27.5)
12.0 (0.7–40.7)
28.7 (4.9–59.7)
20.3 (0.8–58.8)
0.651
Malignant melanoma, NOS
Localized
97.3 (97.1–97.6)
97.2 (96.9–97.5)
95.6 (93.7–96.9)
86.0 (78.2–91.1)
93.1 (88.6–95.9)
0.013
Regional
61.1 (59.8–62.2)
61.4 (60.2–62.7)
57.0 (51.4–62.2)
48.1 (37.7–57.7)
53.8 (42.8–63.6)
0.007
Distant
14.3 (13.4–15.3)
14.1 (13.1–15.1)
17.0 (12.5–22.1)
16.4 (9.7–24.6)
9.6 (4.6–16.7)
0.501
Cancers diagnosed in the period of 1973–2006 and followed up to 12/31/2011 in the SEER 18 database. In each cell, estimated rate (95 % CI). P-values were
obtained from multivariate Cox regression
(regional, 62.9 %), and HW (distant, 34.4 %). For
LMM, the groups with the best survival are Black and
NHW (localized, 100 %), NHW (regional, 75.6 %), and
Black (distant, 69.4 %). For ALM, the groups with the
best survival are NHW (localized, 97.5 %), Asian/PI
(regional, 62.1 %), and Black (distant, 28.7 %). For
NOS, NHWs have the best survival with localized
(97.2 %) and regional (61.4 %) tumors, and HWs have
the best survival with distant tumors (17.0 %). For the
first five subtypes, racial differences are not significant
in the Cox regression after accounting for confounders.
For NOS, significant racial differences are observed for
the localized and regional stages. Figures 1 and 2 provide more detailed information on the survival rates between time zero and year five. Figure 2 shows that the
localized stage has the best relative survival rates for all
five subtypes. In contrast, the distant stage has the
worst survival rates. The separation of survival curves
is the most distinct for SMM with the localized stage,
LMM with the localized and distant stages, and NOS
with the distant stage, while there are some crossovers
for the other subtypes.
Discussion
Main findings
The epidemiology of melanoma overall and its subtypes
has been studied in a large number of publications. It
has been noted that race causes differences in multiple
aspects. However, most of the existing studies only include race as a confounding variable and have not paid
sufficient attention. This study advances from the existing ones by comprehensively analyzing the six most
major subtypes on the same ground for four largest racial groups. For the U.S. and other countries that have a
significant race mixture, observations made in this study
can provide valuable insights for public health and clinical investigators.
Melanoma is a rare disease in minorities. For all subtypes, there are dominatingly more NHW patients. The
counts for the other races are relatively small for some
subtypes. This can be especially problematic in the
stratified analysis, and thus some results should be interpreted cautiously. For all of the patients’ characteristic
variables examined in Table 1, significant racial differences are observed for at least some, if not all, subtypes,
Wang et al. BMC Cancer (2016) 16:691
Page 11 of 19
Table 5 Multivariate Cox regression analysis of survival, stratified by stage at diagnosis
In situ
HR
Localized
95 % CI
Regional
Distant
HR
95 % CI
P
HR
95 % CI
P
HR
95 % CI
P
-
-
-
-
-
-
-
-
-
-
-
-
-
-
-
-
-
-
0.502 0.398–0.634 0.000 -
-
-
-
-
-
-
-
-
1.098 1.087–1.110 0.000 -
-
-
-
-
-
-
-
-
P
Melanoma in situ
Gender
Male
Female
Age at diagnosis
1
Marital Status
-
-
-
-
-
-
-
-
-
Single
1
-
-
-
-
-
-
-
-
-
Married
0.770 0.539–1.099 0.150 -
-
-
-
-
-
-
-
-
Separated/divorced/widowed 1.225 0.831–1.806 0.305 -
-
-
-
-
-
-
-
-
-
Ethnic group
-
-
-
-
-
-
-
-
NHW
1
-
-
-
-
-
-
-
-
-
HW
1.886 0.888–4.006 0.099 -
-
-
-
-
-
-
-
-
Black
0.709 0.098–5.115 0.733 -
-
-
-
-
-
-
-
-
Asian/PI
0.624 0.087–4.495 0.640 -
-
-
-
-
-
-
-
-
-
-
-
-
-
-
-
-
-
Anatomic Site
Face/head/neck
1
-
-
-
-
-
-
-
-
-
Trunk
0.993 0.783–1.259 0.952 -
-
-
-
-
-
-
-
-
Upper Extremity
0.876 0.668–1.149 0.338 -
-
-
-
-
-
-
-
-
Lower Extremity
0.753 0.500–1.133 0.174 -
-
-
-
-
-
-
-
-
Other
1.081 0.399–2.929 0.878 -
-
-
-
-
-
-
-
-
-
-
-
-
-
-
-
-
-
Treatment
No surgery or radiation
1
-
-
-
-
-
-
-
-
-
Surgery
1.125 0.531–2.387 0.758 -
-
-
-
-
-
-
-
-
Radiation
0.185 –
0.989 -
-
-
-
-
-
-
-
-
Radiation & Surgery
1.041 0.214–5.063 0.961 -
-
-
-
-
-
-
-
-
Thickness of tumor (mm)
1.043 0.993–1.095 0.091 -
-
-
-
-
-
-
-
-
-
-
-
-
-
-
-
-
-
Ulceration
No
1
-
-
-
-
-
-
-
-
-
Yes
1.722 0.847–3.503 0.133 -
-
-
-
-
-
-
-
-
Superficial spreading melanoma
Gender
Male
-
-
-
1
Female
-
-
-
0.709 0.677–0.742 0.000 0.718 0.644–0.801
0.000 0.657
0.452–0.955
0.028
-
-
-
1.074 1.072–1.075 0.000 1.033 1.029–1.036
0.000 1.018
1.007–1.029
0.001
Single
-
-
-
1
Married
-
-
-
0.741 0.693–0.792 0.000 0.724 0.631–0.832
0.000 0.505
0.337–0.757
0.001
Separated/divorced/widowed -
-
-
1.034 0.957–1.117 0.400 0.897 0.759–1.059
0.199 0.791
0.480–1.301
0.355
Age at diagnosis
1
1
Marital Status
1
1
Ethnic group
NHW
-
-
-
1
HW
-
-
-
1.065 0.915–1.241 0.416 1.213 0.909–1.620
1
0.190 0.931
1
0.468–1.850
0.837
Black
-
-
-
0.920 0.605–1.398 0.696 0.954 0.549–1.657
0.867 1.171
0.156–8.812
0.878
Asian/PI
-
-
-
1.008 0.726–1.398 0.964 1.028 0.606–1.745
0.918 0.821
0.196–3.447
0.788
Wang et al. BMC Cancer (2016) 16:691
Page 12 of 19
Table 5 Multivariate Cox regression analysis of survival, stratified by stage at diagnosis (Continued)
Anatomic Site
Face/head/neck
-
-
-
1
Trunk
-
-
-
0.849 0.804–0.896 0.000 0.896 0.788–1.020
1
0.098 1.570
1
1.062–2.319
0.024
Upper Extremity
-
-
-
0.750 0.707–0.795 0.000 0.800 0.692–0.925
0.003 1.606
1.034–2.493
0.035
Lower Extremity
-
-
-
0.655 0.611–0.701 0.000 0.820 0.707–0.951
0.009 1.384
0.825–2.323
0.218
Other
-
-
-
1.031 0.731–1.455 0.860 1.359 0.507–3.646
0.542 0.000
–
0.954
No surgery or radiation
-
-
-
1
Surgery
-
-
-
0.584 0.468–0.729 0.000 2.030 0.652–6.316
0.222 0.274
0.116–0.645
0.003
Radiation
-
-
-
1.738 0.427–7.077 0.440 5.760 0.597–55.57
0.130 1.454
0.397–5.328
0.572
Radiation & Surgery
-
-
-
1.175 0.841–1.640 0.345 4.154 1.316–13.11
0.015 0.750
0.306–1.836
0.529
Thickness of tumor (mm)
-
-
-
1.223 1.207–1.239 0.000 1.152 1.128–1.176
0.000 1.107
1.043–1.175
0.001
0.703–1.453
0.954
Treatment
1
1
Ulceration
No
-
-
-
1
Yes
-
-
-
1.355 1.226–1.498 0.000 1.082 0.984–1.190
1
1
Male
-
-
-
1
Female
-
-
-
0.753 0.698–0.812 0.000 0.790 0.728–0.858
0.000 1.069
0.879–1.299
0.504
-
-
-
1.048 1.045–1.050 0.000 1.028 1.026–1.031
0.000 1.010
1.004–1.015
0.001
Single
-
-
-
1
Married
-
-
-
0.707 0.636–0.785 0.000 0.799 0.722–0.885
0.000 0.763
0.600–0.970
0.027
Separated/divorced/widowed -
-
-
0.944 0.838–1.063 0.341 1.001 0.887–1.129
0.987 0.880
0.663–1.167
0.374
0.102 1.011
Nodular melanoma
Gender
Age at diagnosis
1
1
Marital Status
1
1
Ethnic group
NHW
-
-
-
1
HW
-
-
-
0.924 0.739–1.155 0.486 1.150 0.958–1.380
1
0.134 0.625
1
0.416–0.940
0.024
Black
-
-
-
1.533 0.887–2.647 0.126 1.335 0.876–2.035
0.179 0.597
0.243–1.467
0.261
Asian/PI
-
-
-
0.938 0.597–1.475 0.783 0.781 0.540–1.128
0.187 0.959
0.469–1.961
0.910
Face/head/neck
-
-
-
1
Trunk
-
-
-
1.046 0.957–1.143 0.320 1.125 1.023–1.238
0.016 1.284
1.027–1.605
0.029
Upper Extremity
-
-
-
0.846 0.773–0.926 0.000 0.901 0.813–0.998
0.046 0.960
0.745–1.237
0.750
Lower Extremity
-
-
-
0.832 0.743–0.931 0.001 0.984 0.879–1.101
0.775 0.936
0.711–1.232
0.636
Other
-
-
-
0.974 0.572–1.660 0.923 0.940 0.518–1.705
0.838 3.880
0.942–15.986 0.061
No surgery or radiation
-
-
-
1
Surgery
-
-
-
0.498 0.358–0.692 0.000 0.416 0.276–0.628
0.000 0.459
0.282–0.748
0.002
Radiation
-
-
-
1.813 0.644–5.102 0.260 0.418 0.056–3.102
0.394 0.626
0.210–1.866
0.400
Radiation & Surgery
-
-
-
1.012 0.667–1.536 1.012 0.648 0.419–1.003
0.051 0.678
0.409–1.124
0.132
Thickness of tumor (mm)
-
-
-
1.120 1.104–1.136 0.000 1.074 1.060–1.088
0.000 1.017
0.989–1.044
0.235
No
-
-
-
1
Yes
-
-
-
1.215 1.116–1.323 0.000 1.074 1.000–1.155
0.699–0.997
0.046
Anatomic Site
1
1
Treatment
1
1
Ulceration
Lentigo maligna melanoma
1
1
0.051 0.834
Wang et al. BMC Cancer (2016) 16:691
Page 13 of 19
Table 5 Multivariate Cox regression analysis of survival, stratified by stage at diagnosis (Continued)
Gender
Male
-
-
-
1
Female
-
-
-
0.641 0.589–0.698 0.000 0.641 0.471–0.872
0.005 1.968
0.468–8.271
0.355
-
-
-
1.093 1.088–1.097 0.000 1.050 1.036–1.065
0.000 1.016
0.965–1.070
0.550
Single
-
-
-
1
Married
-
-
-
0.758 0.660–0.870 0.000 0.858 0.508–1.449
0.566 1.701
0.345–8.396
0.514
Separated/divorced/widowed -
-
-
0.939 0.808–1.091 0.409 1.137 0.657–1.969
0.646 0.744
0.082–6.771
0.793
-
-
Age at diagnosis
1
1
Marital Status
1
1
Ethnic group
NHW
-
-
-
1
HW
-
-
-
0.981 0.723–1.330 0.900 0.619 0.196–1.954
1
1
Black
-
-
-
1.029 0.486–2.180 0.940 9.996 1.239–80.642 0.031 0.308
0.009–10.073 0.508
Asian
-
-
-
0.587 0.244–1.412 0.234 1.120 0.331–3.793
-
Face/head/neck
-
-
-
1
Trunk
-
-
-
0.909 0.812–1.018 0.099 1.068 0.666–1.713
0.785 5.787
1.173-28.562 0.031
Upper Extremity
-
-
-
0.888 0.806–0.978 0.016 0.988 0.656–1.488
0.954 1.564
0.145–16.844 0.712
Lower Extremity
-
-
-
0.802 0.655–0.981 0.032 0.670 0.363–1.234
0.198 -
-
-
Other
-
-
-
1.218 0.792–1.873 0.369 -
-
-
-
-
No surgery or radiation
-
-
-
1
-
-
-
Surgery
-
-
-
0.734 0.530–1.015 0.062 1.768 0.245–12.759 0.572 1
Radiation
-
-
-
0.017 –
Radiation & Surgery
-
-
-
1.202 0.703–2.056 0.501 3.478 0.445–27.195 0.235 7.513
1.689–33.427 0.008
Thickness of tumor (mm)
-
-
-
1.130 1.098–1.162 0.000 1.094 1.030–1.161
0.893–1.460
No
-
-
-
1
Yes
-
-
-
1.243 0.971–1.592 0.085 1.242 0.949–1.626
-
-
1
0.414 -
0.855 -
-
Anatomic Site
1
1
-
Treatment
1
0.902 -
-
-
135.011 –
0.003 1.142
0.000
0.289
Ulceration
1
1
0.114 2.834
0.458–17.545 0.263
Acral lentiginous melanoma, malignant
Gender
Male
-
1
1
Female
-
-
-
0.810 0.649–1.011 0.062 0.595 0.471–0.752
0.000 0.828
0.449–1.529
0.546
Age at diagnosis
-
-
-
1.069 1.059–1.079 0.000 1.025 1.017–1.034
0.000 1.040
1.013–1.067
0.003
Single
-
-
-
1
Married
-
-
-
0.922 0.638–1.332 0.665 0.790 0.550–1.136
0.204 0.340
0.120–0.967
0.043
Separated/divorced/widowed -
-
-
1.063 0.719–1.572 0.761 1.093 0.744–1.606
0.652 0.337
0.099–1.147
0.082
Marital Status
1
1
Ethnic group
Non-Hispanic white
-
-
-
1
1
1
Hispanic white
-
-
-
0.771 0.530–1.123 0.176 1.219 0.884–1.682
0.228 0.987
0.409–2.381
0.977
Black
-
-
-
1.112 0.803–1.540 0.523 1.080 0.751–1.553
0.678 0.601
0.254–1.420
0.246
Asian
-
-
-
1.307 0.826–2.068 0.254 0.843 0.568–1.250
0.396 0.630
0.183–2.176
0.465
-
-
Anatomic Site
Face/head/neck
-
-
-
1
Trunk
-
-
-
0.845 0.280–2.552 0.765 0.770 0.123–4.845
1
0.781 1
Wang et al. BMC Cancer (2016) 16:691
Page 14 of 19
Table 5 Multivariate Cox regression analysis of survival, stratified by stage at diagnosis (Continued)
Upper Extremity
-
-
-
0.978 0.447–2.140 0.956 0.933 0.275–3.162
0.912 0.253
0.045–1.403
0.116
Lower Extremity
-
-
-
1.004 0.472–2.139 0.991 1.277 0.383–4.250
0.691 0.302
0.060–1.509
0.145
Other
-
-
-
0.913 0.111–7.533 0.933 0.011 –
0.962 -
-
-
No surgery or radiation
-
-
-
1
Surgery
-
-
-
0.372 0.162–0.855 0.020 0.065 0.020–0.213
0.000 0.150
0.031–0.718
0.018
Radiation
-
-
-
0.431 0.049–3.766 0.446 -
-
0.946
0.112–7.994
0.959
Radiation & Surgery
-
-
-
0.151 0.018–1.271 0.082 0.179 0.047–0.687
0.012 0.528
0.091–3.061
0.476
Thickness of tumor (mm)
-
-
-
1.137 1.072–1.206 0.000 1.115 1.069–1.163
0.000 1.094
0.988–1.211
0.083
No
-
-
-
1
Yes
-
-
-
1.544 1.112–2.143 0.009 1.103 0.888–1.368
1.216–4.280
0.010
Male
-
-
-
1
Female
-
-
-
0.705 0.676–0.735 0.000 0.800 0.742–0.862
0.000 0.881
0.752–1.032
0.117
-
-
-
1.069 1.068–1.071 0.000 1.033 1.031–1.035
0.000 1.014
1.010–1.019
0.000
Single
-
-
-
1
Married
-
-
-
0.731 0.690–0.776 0.000 0.777 0.704–0.857
0.000 0.630
0.521–0.762
0.000
Separated/divorced/widowed -
-
-
0.985 0.921–1.054 0.660 0.993 0.886–1.114
0.910 0.848
0.673–1.069
0.163
Treatment
1
1
-
Ulceration
1
1
0.376 2.281
Malignant melanoma, NOS
Gender
Age at diagnosis
1
1
Marital Status
1
1
Ethnic group
NHW
-
-
-
1
1
1
HW
-
-
-
1.134 1.002–1.284 0.046 1.240 1.056–1.455
0.009 0.970
0.704–1.336
0.852
Black
-
-
-
1.389 1.086–1.777 0.009 1.372 1.056–1.782
0.018 0.859
0.516–1.431
0.561
Asian/PI
-
-
-
1.004 0.782–1.290 0.973 1.052 0.772–1.434
0.748 1.478
0.850–2.571
0.167
Anatomic Site
Face/head/neck
-
-
-
1
Trunk
-
-
-
0.918 0.876–0.962 0.000 1.087 0.994–1.189
1
0.068 1.098
1
0.913–1.320
0.320
Upper Extremity
-
-
-
0.811 0.772–0.852 0.000 0.859 0.779–0.948
0.003 0.970
0.782–1.203
0.778
Lower Extremity
-
-
-
0.732 0.687–0.779 0.000 0.910 0.823–1.006
0.065 0.835
0.672–1.037
0.103
Other
-
-
-
0.911 0.690–1.201 0.506 1.416 0.908–2.208
0.125 1.011
0.631–1.619
0.964
No surgery or radiation
-
-
-
1
Surgery
-
-
-
0.656 0.572–0.752 0.000 0.392 0.291–0.530
0.000 0.472
0.357–0.626
0.000
Radiation
-
-
-
2.551 1.424–4.570 0.002 1.886 0.886–4.016
0.100 1.647
1.033–2.625
0.036
Radiation & Surgery
-
-
-
1.312 1.069–1.610 0.009 0.732 0.531–1.011
0.058 0.747
0.549–1.016
0.063
Thickness of tumor (mm)
-
-
-
1.196 1.183–1.208 0.000 1.086 1.073–1.099
0.000 1.045
1.021–1.069
0.000
0.858–1.172
0.975
Treatment
1
1
Ulceration
No
-
-
-
1
Yes
-
-
-
1.448 1.351–1.553 0.000 1.172 1.097–1.252
Cancers diagnosed 1973–2006 and followed up to 12/31/2011
HR hazard ratio
1
1
0.000 1.002
Wang et al. BMC Cancer (2016) 16:691
Page 15 of 19
Fig. 1 Relative survival rates up to five years, for all stages combined. Cancers diagnosed in the period of 1973–2006 and followed up to 12/31/2011
Wang et al. BMC Cancer (2016) 16:691
Page 16 of 19
Fig. 2 Relative survival rates up to five years, stratified by stage. Cancers diagnosed in the period of 1973–2006 and followed up to 12/31/2011
Wang et al. BMC Cancer (2016) 16:691
and the patterns vary across subtypes. The development
of melanoma is extremely complicated. The heterogeneity in etiology and presentation among subtypes have
been previously noted [14]. The observed differences
across races and across subtypes reflect the complex interactions of occupational exposures (especially to UV
light,) environment (closer to the equator or at a higher
elevation), genetic makeup (which, for example, causes
difference in skin and hair color), family history, deficiency in the immune system, and socioeconomic status.
Some of the observed across-subtype differences, for
example in gender and marital status, can be confounded with other factors such as socioeconomic status. In the literature [6, 15, 16], it has been suggested
that minorities, especially Blacks and Hispanics, are
more likely to be diagnosed at later stages and have advanced presentations. In our analysis, Blacks have stages
later than the other races for all subtypes except for
ALM. It has been suggested that this can be a consequence of economic, social, and cultural barriers such as
low income, lack of insurance, lower levels of education,
lower levels of melanoma awareness and knowledge, and
lower rates of participation in melanoma screening [15,
17]. However in the literature, subtype-specific analysis
of socioeconomic status is still lacking.
The incidence of melanoma is extremely complex. The
most prominent risk factor is exposure to UV light. A
large number of potential risk factors have been suggested, including presence of fair skin, freckling and light
hair, family history, personal history of melanoma and
other skin cancers, older age, male gender, and xeroderma pigmentosum (XP) [18]. In addition, a large number of genetic risk factors have been suggested, including
germline mutations such as CDKN2A (which leads to
destabilization of p53), CDK4, BAP1, MC1R, and MITF,
and somatic mutations for example in the RAS-RAFMEK-MAPK and PI3K-PTEN-AKT pathways [19]. For
five out of six subtypes, the overall incidence rate patterns are relatively consistent across races. It has been
long noted that NHWs have a higher incidence rate.
This can be attributable to certain physical characteristics (for example light skin and hair color), lifestyle factors (for example more exposure to UV light), genetic
risk factors, as well as others [20]. The analysis also suggests that there exists interaction between gender and
race – it is observed that females have higher incidence
among HWs for MIS and SSM, but for other cases, the
trend is reversed. Previous studies have noted the interaction between gender and age for incidence [21]. However the interaction observed in this study has been less
acknowledged. Some of the genetic risk factors may also
interact with race. For example, all red-haired people
have a mutated copy of MC1R. Overall, research on the
distribution of genetic risk factors across races has been
Page 17 of 19
rare. The observation for ALM is different from the
other subtypes. ALM is the most common type of melanoma in the Asian, Hispanic, and African populations.
The fundamental difference of this subtype has been examined in the literature [22] and is not reiterated here.
The primary treatment for melanoma is surgical excision. Systemic adjuvant therapies (levamisole, interferon,
vaccines, and chemotherapy) and radiotherapy may be
considered for patients with high risk melanomas, including those with lymph node involvement and distant
metastases. For most of the subtypes/stages, racial differences, although observed, are not statistically significant
after adjusting for confounders. The difference observed
for the distant stage of ALM should be taken with cautions because of the small sample size. For the localized
stage of NOS, as most patients (at least 94.6 %) had surgery, the observed racial difference may not be clinically
meaningful. For regional and distant tumors, the racial
differences are more prominent. For regional tumors,
Blacks had the highest rate of surgery (92.2 %), while
HWs had the lowest (81.7 %). For distant tumors, all
racial groups had more “scattered” treatment distributions. For a variety of solid tumors, racial differences in
treatment have been well documented [23–25]. In particular, Blacks have been shown to be given less than optimal care [26, 27]. However, our analysis suggests that
there is no such racial difference for melanoma treatment. A similar observation has been made for Blacks
and Whites [28]. Treatment selection is a complex
process involving multiple factors. The differences in
patients’ characteristics, as previously observed, contribute to at least some of the differences. In addition, it has
been suggested in the literature that socioeconomic status, insurance status, disparity (that is independent of
socioeconomic status), cultural and behavioral differences all contribute to treatment selection [29]. It is
noted that such information is not available from SEER.
Analysis suggests certain racial differences in the
five-year survival rate. For example for localized NM,
NHWs and Blacks have survival rates 80.6 and 63.9 %,
respectively. However, after adjusting for confounders,
racial differences are significant only for regional and
distant NOS, with Blacks having the lowest survival
rates. Multiple factors contribute to melanoma prognosis. Published studies have suggested potential prognostic roles of lesion thickness, ulceration, lymph node
involvement, age, gender, anatomic site, satellite lesion,
serum lactic dehydrogenase (LDH), and others. The
differences in patients’ characteristics, as previously
described, can contribute to survival difference. In
addition, the aforementioned prognostic factors may
also interact with race (for example the distribution of
LDH varies across races [30]). Racial differences in
survival have been examined in the literature. For
Wang et al. BMC Cancer (2016) 16:691
example, Collins and others found that both overall
and melanoma-specific survival was lower in Blacks
undergoing surgical treatment compared to Whites and
other races [5]. However, reasons for these differences
remain poorly understood. Several possible explanations have been raised. For example, compared to
Whites, Blacks were more likely to be diagnosed at
more advanced stages [16, 31]. They were also more
likely to have tumor ulceration, satellite nodules, and
regional and distant metastases [3, 32–35]. Studies have
also suggested that factors not measured in SEER, such
as socioeconomic status, skin cancer awareness, and
cultural and social values, may be related to racial differences in survival. Multiple genetic risk factors have
also been suggested as having independent contributions to survival [36]. However, their interactions with
race have not been examined.
Limitations
The SEER database is analyzed as it is the most comprehensive cancer registry in the U.S. However, it has
limitations. The most significant limitation is a lack of
certain important measurements, such as UV exposure,
socioeconomic status, lifestyle, and genetic risk factors.
In addition, the treatment information is also not
complete: there is no information on chemotherapy,
biologic therapy, and others. Connecting to other databases or more data collection are needed. This study
may also have been hindered by the multiple coexisting
classification schemes. Patients diagnosed before 2001
may have diagnosis codes from earlier ICD-O versions
that need to be converted to ICD-O-3, which may have
resulted in unclassified cases. SEER has multiple sites,
and errors may arise in tumor classification and staging.
However, we do not expect systematic errors correlated
with race. The SEER population have a higher proportion of foreign-born patients than the general U.S.
population. Combined with the fact that SEER is limited to the U.S. only, there may be concerns on the
generalizability of findings.
Conclusions
This epidemiologic study has provided comprehensive
descriptive statistics on racial differences in multiple
aspects of major melanoma subtypes. Similar to many
published studies of the same kind, it cannot reveal the
underlying mechanisms that cause racial differences.
However, it has been shown repeatedly in the literature
that this kind of studies has extensive values. A major
advancement of this study is its comprehensiveness: six
subtypes are analyzed on the same ground, their patterns are compared, and multiple aspects of the disease
are studied.
Page 18 of 19
The analysis of SEER data suggests that racial differences exist among the six major subtypes of melanoma
in the U.S. in terms of patients’ clinicopathologic characteristics, incidence, treatment, and survival. The
observed differences vary across subtypes. Some plausible causes of such differences are provided. SEER data
may be limited by lacking certain important information. More comprehensive data collection is needed to
fully decipher the racial differences. Despite certain limitations, the findings of this study can be important for early
detection, risk stratification, proper treatment selection,
and elimination of racial disparities in melanoma.
Acknowledgements
We thank the editor and reviewers for careful review and insightful
comments, which have led to a significant improvement of the manuscript.
Funding
This study was supported by a pilot grant from the Edith P. Rausch Fund of
the Community Foundation of Greater New Haven, awards CA016359 and
CA121974 from NIH, and the VA Cooperative Studies Program of the
Department of Veterans Affairs, Office of Research and Development.
Availability of data and materials
All analyzed data are publicly available at the SEER website.
Authors’ contributions
Design of study: YW, SM; Data analysis: YW, YZ; Manuscript preparation: YW,
YZ, SM. All authors read and approve the final manuscript.
Competing interests
The authors declare that they have no competing interest.
Consent for publication
Not applicable.
Ethics approval and consent to participate
Not applicable. Only deidentified publicly available data are analyzed.
Author details
1
School of Statistics and The center for Applied Statistics, Renmin University
of China, 59 Zhongguancun Ave., Beijing 100872, China. 2School of Public
Health, Yale University, 60 College ST, LEPH 206, New Haven, CT 06520, USA.
3
VA Cooperative Studies Program Coordinating Center, West Haven, CT, USA.
Received: 18 January 2016 Accepted: 24 August 2016
References
1. Rebecca LS, Kimberly DM, Ahmedin J. Cancer Statistics, 2015. CA Cancer J
Clin. 2015;65:5–29.
2. Ries LA, Wingo PA, Miller DS, Howe HL, Weir HK, Rosenberg HM, Vemon
SW, Cronin K, Edwards BK. The annual report to the nation on the status of
cancer, 1973–1997, with a special section on colorectal cancer. Cancer.
2000;88(10):2398–424.
3. Cress RD, Holly EA. Incidence of cutaneous melanoma among non-Hispanic
whites, Hispanics, Asians, and blacks: an analysis of California cancer registry
data, 1988-93. Cancer Causes Control. 1997;8(2):246–52.
4. Du XL, Lin CC, Johnson NJ, Altekruse S. Effects of Individual-Level
Socioeconomic Factors on Racial Disparities in Cancer Treatment and
Survival: Findings from the National Longitudinal Mortality Study,
1979–2003. Cancer. 2011;117(14):3242–51.
5. Collins KK, Fields RC, Baptiste D, Liu Y, Moley J, Jeffe DB. Racial Differences
in Survival after Surgical Treatment for Melanoma. Ann Surg Oncol. 2011;
18(10):2925–36.
6. Cormier JN, Xing Y, Ding M, Lee JE, Mansfield PF, Gershenwald JE, Ross MI,
Du XL. Ethnic differences among patients with cutaneous melanoma. Arch
Intern Med. 2006;166(17):1907–14.
Wang et al. BMC Cancer (2016) 16:691
7.
8.
9.
10.
11.
12.
13.
14.
15.
16.
17.
18.
19.
20.
21.
22.
23.
24.
25.
26.
27.
28.
29.
30.
31.
32.
Reintgen DS, Mccarty KMJ, Cox E, Seigler HF. Malignant melanoma in black
American and white American populations. JAMA. 1982;248(15):1856–9.
Hemmings DE, Scott JD, Tominaga GT, Wong JH. Cutaneous melanoma in a
multiethnic population: is this a different disease? Arch Surg. 2004;139(9):
968–72.
Newell GR, Sider JG, Bergfelt L, Kripke ML. Incidence of cutaneous
melanoma in the United States by histology with special reference to the
face. Cancer Res. 1988;48(17):5036–41.
McGovern VJ, Shaw HM, Milton GW, Farago GA. Is malignant melanoma
arising in a Hutchinson’s melanotic freckle a separate disease entity?
Histopathology. 1980;4(3):235–42.
SEER database. National Cancer Institute. Last
accessed 5 Jan 2016.
SEER registry grouping for analyses. />html. Last accessed 5 Jan 2016.
Fritz A, Percy C, Jack A, Shanmugaratnam K, Sobin L, Parkin DM, Whelan S.
International Classification of Diseases for Oncology. 3rd ed. Geneva,
Switzerland: World Health Organization; 2000.
Ali Z, Yousaf N, Larkin J. Melanoma epidemiology, biology and prognosis.
Eur J Cancer Suppl. 2013;11(2):81–91.
Harvey VM, Patel H, Sandhu S, Wallington SF, Hinds G. Social Determinants
of Racial and Ethnic Disparities in Cutaneous Melanoma Outcomes. Cancer
Control. 2014;21(4):343–9.
Williams DR, Neighbors HW, Jackson JS. Racial/ethnic discrimination and
health: Findings from community studies. Am J Public Health. 2003;
93(2):200–8.
Rastrelli M, Tropea S, Rossi CR, Alaibac M. Melanoma: Epidemiology, Risk
Factors, Pathogenesis, Diagnosis and Classification. In Vivo. 2014;28(6):
1005–11.
Titus-Emstoff L, Perry AE, Spencer SK, Gibson JJ, Cole BF, Emstoff MS.
Pigmentary characteristics and moles in relation to melanoma risk. Int J
Cancer. 2005;116(1):144–9.
Tsao H, Niendorf K. Genetic testing in hereditary melanoma. J Am Acad
Dermatol. 2004;51(5):803–8.
Rigel DS. Epidemiology of melanoma. Semin Cutan Med Surg. 2010;
29(4):204–9.
Nikolaus D, Hans S, Harald K, Golnaz D, Astrid F, Anja P, Thomas W.
Melanoma epidemiology of Austria reveals gender-related differences. Eur J
Dermatol. 2013;23(6):872–8.
Markovic SN, Erickson LA, Rao RD, Weenig RH, Pockaj BA, Bardia A, Vachon
CM, Schild SE, McWilliams RR, Hand JL, Laman SD, Kottschade LA, Maples
WJ, Pittelkow MR, Pulido JS, Cameron JD, Creagan ET, Melanoma Study
Group of the Mayo Clinic Cancer Center. Malignant melanoma in the 21st
century, part 1: epidemiology, risk factors, screening, prevention, and
diagnosis. Mayo Clin Proc. 2007;82(3):364–80.
Wang Y, Zhang Y, Ma S. Racial differences in nasopharyngeal carcinoma in
the United States. Cancer Epidemiol. 2013;37(6):793–802.
Optenberg SA, Thompson IM, Friedrichs P, Wojcik B, Stein CR, Kramer B.
Race, treatment, and long-term survival from prostate cancer in an equalaccess medical care delivery system. JAMA. 1995;274(20):1599–605.
Li CI, Malone KE, Daling JR. Differences in breast cancer stage, treatment,
and survival by race and ethnicity. Arch Intern Med. 2003;163(1):49–56.
Shavers VL, Brown ML. Racial and ethnic disparities in the receipt of cancer
treatment. J Natl Cancer Inst. 2002;94(5):334–57.
Bach PB, Guadagnoli E, Schrag D, Schussler N, Warren JL. Patient
demographic and socioeconomic characteristics in the SEER-Medicare
database: Applications and limitations. Med Care. 2002;40(8 Suppl):IV19–25.
Cormier JN, Xing Y, Ding M, Lee JE, Mansfield PF, Gershenwald JE, Ross MI,
Du XL. Population based assessment of surgical treatment trends for
patients with melanoma in the era of sentinel lymph node biopsy. J Clin
Oncol. 2005;23(25):6054–62.
Zell JA, Cinar P, Mobasher M, Ziogas A, Meyskens Jr FL, Anton-Culver H.
Survival for patients with invasive cutaneous melanoma among ethnic
groups: The effects of socioeconomic status and treatment. J Clin Oncol.
2008;26(1):66–75.
Lie-Injo LE, Lopez CG, Ganesan J. Lactic Dehydrogenase variants in different
racial groups in Malaysia. Hum Hered. 1973;23(5):487–91.
Morton R. Racial differences in adenocarcinoma of the prostate in North
American men. Urology. 1994;44(5):637–45.
Rahman Z, Taylor SC. Malignant melanoma in African Americans. Cutis.
2001;67(5):203–406.
Page 19 of 19
33. Byrd KM, Wilson DC, Hoyler SS, Peck GL. Advanced presentation of
melanoma in African Americans. J Am Acad Dermatol. 2004;50(1):21–4.
34. Hu S, Soza-Vento RM, Parker DF, Kirsner RS. Comparison of stage at
diagnosis of melanoma among hispanic, black, and white patients in
Miami-Dade County. Florida Arch Dermatol. 2006;142(6):704–8.
35. Hutchenson AC, McGowen 4th JW, Maize Jr JC, Cook J. Multiple primary
acral melanomas in African-Americans: A case series and review of the
literature. Dermatol Surg. 2007;33(1):1–10.
36. Bellows CF, Bellafsy P, Fortang IS, Beech DJ. Melanoma in African Americans:
Trends in biological behavior and clinical characteristics over two decades.
J Surg Oncol. 2001;78(1):10–6.
Submit your next manuscript to BioMed Central
and we will help you at every step:
• We accept pre-submission inquiries
• Our selector tool helps you to find the most relevant journal
• We provide round the clock customer support
• Convenient online submission
• Thorough peer review
• Inclusion in PubMed and all major indexing services
• Maximum visibility for your research
Submit your manuscript at
www.biomedcentral.com/submit