2020 CFA® Program Curriculum Level 2
Bạn đang xem bản rút gọn của tài liệu. Xem và tải ngay bản đầy đủ của tài liệu tại đây (3.11 MB, 468 trang )
© CFA Institute. For candidate use only. Not for distribution.
FIXED
INCOME AND
DERIVATIVES
CFA® Program Curriculum
2020 • LEVEL II • VOLUME 5
© CFA Institute. For candidate use only. Not for distribution.
© 2019, 2018, 2017, 2016, 2015, 2014, 2013, 2012, 2011, 2010, 2009, 2008, 2007, 2006
by CFA Institute. All rights reserved.
This copyright covers material written expressly for this volume by the editor/s as well
as the compilation itself. It does not cover the individual selections herein that first
appeared elsewhere. Permission to reprint these has been obtained by CFA Institute
for this edition only. Further reproductions by any means, electronic or mechanical,
including photocopying and recording, or by any information storage or retrieval
systems, must be arranged with the individual copyright holders noted.
CFA®, Chartered Financial Analyst®, AIMR-PPS®, and GIPS® are just a few of the trademarks owned by CFA Institute. To view a list of CFA Institute trademarks and the
Guide for Use of CFA Institute Marks, please visit our website at www.cfainstitute.org.
This publication is designed to provide accurate and authoritative information in regard
to the subject matter covered. It is sold with the understanding that the publisher
is not engaged in rendering legal, accounting, or other professional service. If legal
advice or other expert assistance is required, the services of a competent professional
should be sought.
All trademarks, service marks, registered trademarks, and registered service marks
are the property of their respective owners and are used herein for identification
purposes only.
ISBN 978-1-946442-86-4 (paper)
ISBN 978-1-950157-10-5 (ebk)
10 9 8 7 6 5 4 3 2 1
© CFA Institute. For candidate use only. Not for distribution.
CONTENTS
How to Use the CFA Program Curriculum
Background on the CBOK
Organization of the Curriculum
Features of the Curriculum
Designing Your Personal Study Program
Feedback
v
v
vi
vi
viii
ix
Fixed Income
Study Session 12
Fixed Income (1)
3
Reading 32
The Term Structure and Interest Rate Dynamics
Introduction
Spot Rates and Forward Rates
The Forward Rate Model
Yield to Maturity in Relation to Spot Rates and Expected and
Realized Returns on Bonds
Yield Curve Movement and the Forward Curve
Active Bond Portfolio Management
The Swap Rate Curve
The Swap Rate Curve
Why Do Market Participants Use Swap Rates When Valuing Bonds?
How Do Market Participants Use the Swap Curve in Valuation?
The Swap Spread
Spreads as a Price Quotation Convention
Traditional Theories of the Term Structure of Interest Rates
Local Expectations Theory
Liquidity Preference Theory
Segmented Markets Theory
Preferred Habitat Theory
Modern Term Structure Models
Equilibrium Term Structure Models
Arbitrage-Free Models: The Ho–Lee Model
Yield Curve Factor Models
A Bond’s Exposure to Yield Curve Movement
Factors Affecting the Shape of the Yield Curve
The Maturity Structure of Yield Curve Volatilities
Managing Yield Curve Risks
Summary
Practice Problems
Solutions
5
6
6
8
indicates an optional segment
16
19
20
24
24
25
26
29
31
33
33
34
35
35
38
38
42
45
45
47
50
51
54
56
67
© CFA Institute. For candidate use only. Not for distribution.
ii
Contents
Reading 33
The Arbitrage-Free Valuation Framework
Introduction
The Meaning of Arbitrage-Free Valuation
The Law of One Price
Arbitrage Opportunity
Implications of Arbitrage-Free Valuation for Fixed-Income Securities
Interest Rate Trees and Arbitrage-Free Valuation
The Binomial Interest Rate Tree
What Is Volatility and How Is It Estimated?
Determining the Value of a Bond at a Node
Constructing the Binomial Interest Rate Tree
Valuing an Option-Free Bond with the Tree
Pathwise Valuation
Monte Carlo Method
Summary
Practice Problems
Solutions
75
75
76
77
77
79
79
81
85
85
87
94
96
100
102
104
112
Study Session 13
Fixed Income (2)
119
Reading 34
Valuation and Analysis of Bonds with Embedded Options
Introduction
Overview of Embedded Options
Simple Embedded Options
Complex Embedded Options
Valuation and Analysis of Callable and Putable Bonds
Relationships between the Values of a Callable or Putable Bond,
Straight Bond, and Embedded Option
Valuation of Default-Free and Option-Free Bonds: A Refresher
Valuation of Default-Free Callable and Putable Bonds in the
Absence of Interest Rate Volatility
Effect of Interest Rate Volatility on the Value of Callable and Putable
Bonds
Valuation of Default-Free Callable and Putable Bonds in the
Presence of Interest Rate Volatility
Valuation of Risky Callable and Putable Bonds
Interest Rate Risk of Bonds with Embedded Options
Duration
Effective Convexity
Valuation and Analysis of Capped and Floored Floating-Rate Bonds
Valuation of a Capped Floater
Valuation of a Floored Floater
Valuation and Analysis of Convertible Bonds
Defining Features of a Convertible Bond
Analysis of a Convertible Bond
Valuation of a Convertible Bond
Comparison of the Risk–Return Characteristics of a Convertible
Bond, the Straight Bond, and the Underlying Common Stock
Bond Analytics
121
122
123
123
124
127
indicates an optional segment
127
128
129
132
137
145
150
151
158
161
161
163
166
167
169
172
173
178
© CFA Institute. For candidate use only. Not for distribution.
Contents
iii
Summary
Practice Problems
Solutions
179
182
193
Reading 35
Credit Analysis Models
Introduction
Modeling Credit Risk and the Credit Valuation Adjustment
Credit Scores and Credit Ratings
Structural and Reduced-Form Credit Models
Valuing Risky Bonds in an Arbitrage-Free Framework
Interpreting Changes in Credit Spreads
The Term Structure of Credit Spreads
Credit Analysis for Securitized Debt
Summary
Practice Problems
Solutions
201
201
202
210
216
219
234
240
247
251
253
263
Reading 36
Credit Default Swaps
Introduction
Basic Definitions and Concepts
Types of CDS
Important Features of CDS Markets and Instruments
Credit and Succession Events
Settlement Protocols
CDS Index Products
Market Characteristics
Basics of Valuation and Pricing
Basic Pricing Concepts
The Credit Curve
CDS Pricing Conventions
Valuation Changes in CDS during Their Lives
Monetizing Gains and Losses
Applications of CDS
Managing Credit Exposures
Valuation Differences and Basis Trading
Summary
Practice Problems
Solutions
277
277
278
279
280
282
283
284
286
287
288
291
292
294
295
296
297
301
303
305
310
Study Session 14
Derivatives
315
Reading 37
Pricing and Valuation of Forward Commitments
Introduction
Principles of Arbitrage-Free Pricing and Valuation of Forward Commitments
Pricing and Valuing Forward and Futures Contracts
Our Notation
No-Arbitrage Forward Contracts
317
317
318
319
319
321
Derivatives
indicates an optional segment
© CFA Institute. For candidate use only. Not for distribution.
iv
Reading 38
Contents
Equity Forward and Futures Contracts
Interest Rate Forward and Futures Contracts
Fixed-Income Forward and Futures Contracts
Currency Forward and Futures Contracts
Comparing Forward and Futures Contracts
Pricing and Valuing Swap Contracts
Interest Rate Swap Contracts
Currency Swap Contracts
Equity Swap Contracts
Summary
Practice Problems
Solutions
332
334
343
348
352
353
355
359
368
372
374
380
Valuation of Contingent Claims
Introduction
Principles of a No-Arbitrage Approach to Valuation
Binomial Option Valuation Model
One-Period Binomial Model
Two-Period Binomial Model
Interest Rate Options
Multiperiod Model
Black–Scholes–Merton Option Valuation Model
Introductory Material
Assumptions of the BSM Model
BSM Model
Black Option Valuation Model
European Options on Futures
Interest Rate Options
Swaptions
Option Greeks and Implied Volatility
Delta
Gamma
Theta
Vega
Rho
Implied Volatility
Summary
Practice Problems
Solutions
385
386
386
388
389
396
409
411
411
412
412
414
422
422
424
427
430
430
433
436
437
438
439
443
446
453
Glossary
G-1
indicates an optional segment
© CFA Institute. For candidate use only. Not for distribution.
v
How to Use the CFA
Program Curriculum
Congratulations on reaching Level II of the Chartered Financial Analyst® (CFA®)
Program. This exciting and rewarding program of study reflects your desire to become
a serious investment professional. You have embarked on a program noted for its high
ethical standards and the breadth of knowledge, skills, and abilities (competencies)
it develops. Your commitment to the CFA Program should be educationally and
professionally rewarding.
The credential you seek is respected around the world as a mark of accomplishment and dedication. Each level of the program represents a distinct achievement in
professional development. Successful completion of the program is rewarded with
membership in a prestigious global community of investment professionals. CFA
charterholders are dedicated to life-long learning and maintaining currency with the
ever-changing dynamics of a challenging profession. The CFA Program represents the
first step toward a career-long commitment to professional education.
The CFA examination measures your mastery of the core knowledge, skills, and
abilities required to succeed as an investment professional. These core competencies
are the basis for the Candidate Body of Knowledge (CBOK™). The CBOK consists of
four components:
■
A broad outline that lists the major topic areas covered in the CFA Program
( />
■
Topic area weights that indicate the relative exam weightings of the top-level
topic areas ( />
■
Learning outcome statements (LOS) that advise candidates about the specific
knowledge, skills, and abilities they should acquire from readings covering a
topic area (LOS are provided in candidate study sessions and at the beginning
of each reading); and
■
The CFA Program curriculum that candidates receive upon examination
registration.
Therefore, the key to your success on the CFA examinations is studying and understanding the CBOK. The following sections provide background on the CBOK, the
organization of the curriculum, features of the curriculum, and tips for designing an
effective personal study program.
BACKGROUND ON THE CBOK
The CFA Program is grounded in the practice of the investment profession. Beginning
with the Global Body of Investment Knowledge (GBIK), CFA Institute performs a
continuous practice analysis with investment professionals around the world to determine the competencies that are relevant to the profession. Regional expert panels and
targeted surveys are conducted annually to verify and reinforce the continuous feedback about the GBIK. The practice analysis process ultimately defines the CBOK. The
© 2019 CFA Institute. All rights reserved.
vi
© CFA Institute. For candidate use only. Not for distribution.
How to Use the CFA Program Curriculum
CBOK reflects the competencies that are generally accepted and applied by investment
professionals. These competencies are used in practice in a generalist context and are
expected to be demonstrated by a recently qualified CFA charterholder.
The CFA Institute staff, in conjunction with the Education Advisory Committee
and Curriculum Level Advisors that consist of practicing CFA charterholders, designs
the CFA Program curriculum in order to deliver the CBOK to candidates. The examinations, also written by CFA charterholders, are designed to allow you to demonstrate your mastery of the CBOK as set forth in the CFA Program curriculum. As
you structure your personal study program, you should emphasize mastery of the
CBOK and the practical application of that knowledge. For more information on the
practice analysis, CBOK, and development of the CFA Program curriculum, please
visit www.cfainstitute.org.
ORGANIZATION OF THE CURRICULUM
The Level II CFA Program curriculum is organized into 10 topic areas. Each topic area
begins with a brief statement of the material and the depth of knowledge expected. It
is then divided into one or more study sessions. These study sessions—17 sessions in
the Level II curriculum—should form the basic structure of your reading and preparation. Each study session includes a statement of its structure and objective and is
further divided into assigned readings. An outline illustrating the organization of
these 17 study sessions can be found at the front of each volume of the curriculum.
The readings are commissioned by CFA Institute and written by content experts,
including investment professionals and university professors. Each reading includes
LOS and the core material to be studied, often a combination of text, exhibits, and
in-text examples and questions. A reading typically ends with practice problems followed by solutions to these problems to help you understand and master the material.
The LOS indicate what you should be able to accomplish after studying the material.
The LOS, the core material, and the practice problems are dependent on each other,
with the core material and the practice problems providing context for understanding
the scope of the LOS and enabling you to apply a principle or concept in a variety
of scenarios.
The entire readings, including the practice problems at the end of the readings, are
the basis for all examination questions and are selected or developed specifically to
teach the knowledge, skills, and abilities reflected in the CBOK.
You should use the LOS to guide and focus your study because each examination
question is based on one or more LOS and the core material and practice problems
associated with the LOS. As a candidate, you are responsible for the entirety of the
required material in a study session.
We encourage you to review the information about the LOS on our website (www.
cfainstitute.org/programs/cfa/curriculum/study-sessions), including the descriptions
of LOS “command words” on the candidate resources page at www.cfainstitute.org.
FEATURES OF THE CURRICULUM
OPTIONAL
SEGMENT
Required vs. Optional Segments You should read all of an assigned reading. In some
cases, though, we have reprinted an entire publication and marked certain parts of the
reading as “optional.” The CFA examination is based only on the required segments,
and the optional segments are included only when it is determined that they might
© CFA Institute. For candidate use only. Not for distribution.
How to Use the CFA Program Curriculum
help you to better understand the required segments (by seeing the required material
in its full context). When an optional segment begins, you will see an icon and a dashed
vertical bar in the outside margin that will continue until the optional segment ends,
accompanied by another icon. Unless the material is specifically marked as optional,
you should assume it is required. You should rely on the required segments and the
reading-specific LOS in preparing for the examination.
Practice Problems/Solutions All practice problems at the end of the readings as well as
their solutions are part of the curriculum and are required material for the examination.
In addition to the in-text examples and questions, these practice problems should help
demonstrate practical applications and reinforce your understanding of the concepts
presented. Some of these practice problems are adapted from past CFA examinations
and/or may serve as a basis for examination questions.
Glossary For your convenience, each volume includes a comprehensive glossary.
Throughout the curriculum, a bolded word in a reading denotes a term defined in
the glossary.
Note that the digital curriculum that is included in your examination registration
fee is searchable for key words, including glossary terms.
LOS Self-Check We have inserted checkboxes next to each LOS that you can use to
track your progress in mastering the concepts in each reading.
Source Material The CFA Institute curriculum cites textbooks, journal articles, and
other publications that provide additional context and information about topics covered
in the readings. As a candidate, you are not responsible for familiarity with the original
source materials cited in the curriculum.
Note that some readings may contain a web address or URL. The referenced sites
were live at the time the reading was written or updated but may have been deactivated since then.
Some readings in the curriculum cite articles published in the Financial Analysts Journal®,
which is the flagship publication of CFA Institute. Since its launch in 1945, the Financial
Analysts Journal has established itself as the leading practitioner- oriented journal in the
investment management community. Over the years, it has advanced the knowledge and
understanding of the practice of investment management through the publication of
peer-reviewed practitioner-relevant research from leading academics and practitioners.
It has also featured thought-provoking opinion pieces that advance the common level of
discourse within the investment management profession. Some of the most influential
research in the area of investment management has appeared in the pages of the Financial
Analysts Journal, and several Nobel laureates have contributed articles.
Candidates are not responsible for familiarity with Financial Analysts Journal articles
that are cited in the curriculum. But, as your time and studies allow, we strongly encourage you to begin supplementing your understanding of key investment management
issues by reading this practice- oriented publication. Candidates have full online access
to the Financial Analysts Journal and associated resources. All you need is to log in on
www.cfapubs.org using your candidate credentials.
Errata The curriculum development process is rigorous and includes multiple rounds
of reviews by content experts. Despite our efforts to produce a curriculum that is free
of errors, there are times when we must make corrections. Curriculum errata are periodically updated and posted on the candidate resources page at www.cfainstitute.org.
vii
END OPTIONAL
SEGMENT
viii
© CFA Institute. For candidate use only. Not for distribution.
How to Use the CFA Program Curriculum
DESIGNING YOUR PERSONAL STUDY PROGRAM
Create a Schedule An orderly, systematic approach to examination preparation is
critical. You should dedicate a consistent block of time every week to reading and
studying. Complete all assigned readings and the associated problems and solutions
in each study session. Review the LOS both before and after you study each reading
to ensure that you have mastered the applicable content and can demonstrate the
knowledge, skills, and abilities described by the LOS and the assigned reading. Use the
LOS self-check to track your progress and highlight areas of weakness for later review.
Successful candidates report an average of more than 300 hours preparing for
each examination. Your preparation time will vary based on your prior education and
experience, and you will probably spend more time on some study sessions than on
others. As the Level II curriculum includes 17 study sessions, a good plan is to devote
15−20 hours per week for 17 weeks to studying the material and use the final four to
six weeks before the examination to review what you have learned and practice with
practice questions and mock examinations. This recommendation, however, may
underestimate the hours needed for appropriate examination preparation depending
on your individual circumstances, relevant experience, and academic background.
You will undoubtedly adjust your study time to conform to your own strengths and
weaknesses and to your educational and professional background.
You should allow ample time for both in-depth study of all topic areas and additional concentration on those topic areas for which you feel the least prepared.
As part of the supplemental study tools that are included in your examination
registration fee, you have access to a study planner to help you plan your study time.
The study planner calculates your study progress and pace based on the time remaining
until examination. For more information on the study planner and other supplemental
study tools, please visit www.cfainstitute.org.
As you prepare for your examination, we will e-mail you important examination
updates, testing policies, and study tips. Be sure to read these carefully.
CFA Institute Practice Questions Your examination registration fee includes digital
access to hundreds of practice questions that are additional to the practice problems
at the end of the readings. These practice questions are intended to help you assess
your mastery of individual topic areas as you progress through your studies. After each
practice question, you will be able to receive immediate feedback noting the correct
responses and indicating the relevant assigned reading so you can identify areas of
weakness for further study. For more information on the practice questions, please
visit www.cfainstitute.org.
CFA Institute Mock Examinations Your examination registration fee also includes
digital access to three-hour mock examinations that simulate the morning and afternoon sessions of the actual CFA examination. These mock examinations are intended
to be taken after you complete your study of the full curriculum and take practice
questions so you can test your understanding of the curriculum and your readiness
for the examination. You will receive feedback at the end of the mock examination,
noting the correct responses and indicating the relevant assigned readings so you can
assess areas of weakness for further study during your review period. We recommend
that you take mock examinations during the final stages of your preparation for the
actual CFA examination. For more information on the mock examinations, please visit
www.cfainstitute.org.
© CFA Institute. For candidate use only. Not for distribution.
How to Use the CFA Program Curriculum
Preparatory Providers After you enroll in the CFA Program, you may receive numerous solicitations for preparatory courses and review materials. When considering a
preparatory course, make sure the provider belongs to the CFA Institute Approved Prep
Provider Program. Approved Prep Providers have committed to follow CFA Institute
guidelines and high standards in their offerings and communications with candidates.
For more information on the Approved Prep Providers, please visit www.cfainstitute.
org/programs/cfa/exam/prep-providers.
Remember, however, that there are no shortcuts to success on the CFA examinations; reading and studying the CFA curriculum is the key to success on the examination. The CFA examinations reference only the CFA Institute assigned curriculum—no
preparatory course or review course materials are consulted or referenced.
SUMMARY
Every question on the CFA examination is based on the content contained in the required
readings and on one or more LOS. Frequently, an examination question is based on a
specific example highlighted within a reading or on a specific practice problem and its
solution. To make effective use of the CFA Program curriculum, please remember these
key points:
1
All pages of the curriculum are required reading for the examination except for
occasional sections marked as optional. You may read optional pages as background, but you will not be tested on them.
2
All questions, problems, and their solutions—found at the end of readings—are
part of the curriculum and are required study material for the examination.
3
You should make appropriate use of the practice questions and mock examinations as well as other supplemental study tools and candidate resources available
at www.cfainstitute.org.
4
Create a schedule and commit sufficient study time to cover the 17 study sessions
using the study planner. You should also plan to review the materials and take
topic tests and mock examinations.
5
Some of the concepts in the study sessions may be superseded by updated
rulings and/or pronouncements issued after a reading was published. Candidates
are expected to be familiar with the overall analytical framework contained in the
assigned readings. Candidates are not responsible for changes that occur after the
material was written.
FEEDBACK
At CFA Institute, we are committed to delivering a comprehensive and rigorous curriculum for the development of competent, ethically grounded investment professionals.
We rely on candidate and investment professional comments and feedback as we
work to improve the curriculum, supplemental study tools, and candidate resources.
Please send any comments or feedback to You can be
assured that we will review your suggestions carefully. Ongoing improvements in the
curriculum will help you prepare for success on the upcoming examinations and for
a lifetime of learning as a serious investment professional.
ix
© CFA Institute. For candidate use only. Not for distribution.
© CFA Institute. For candidate use only. Not for distribution.
Fixed Income
STUDY SESSIONS
Study Session 12
Fixed Income (1)
Study Session 13
Fixed Income (2)
TOPIC LEVEL LEARNING OUTCOME
The candidate should be able to estimate the risks and expected returns for fixedincome instruments, analyze the term structure of interest rates and yield spreads,
and evaluate fixed-income instruments with embedded options and unique features.
Understanding interest rate dynamics including changes in the yield curve is critical for investment activities such as economic and capital market forecasting, asset
allocation, and active fixed-income management. Active fixed-income managers,
for instance, must identify and exploit perceived investment opportunities, manage
interest rate and yield curve exposure, and report on benchmark relative performance.
Many fixed-income securities contain embedded options. Issuers use bonds with
call provisions to manage interest rate exposure and interest payments. Investors
may prefer bonds granting early redemption or equity conversion rights. Given their
widespread use and inherent complexity, investors and issuers should understand
when option exercise might occur and how to value these bonds.
Evaluating bonds for credit risk is very important. As demonstrated by the 2008
global financial crisis, systemic mispricing of risk can have wide ranging and severe
consequences that extend far beyond any individual position or portfolio.
© 2019 CFA Institute. All rights reserved.
© CFA Institute. For candidate use only. Not for distribution.
© CFA Institute. For candidate use only. Not for distribution.
FIXED INCOME
STUDY SESSION
12
Fixed Income (1)
This study session introduces the yield curve and key relationships underlying its
composition. Traditional and modern theories and models explaining the shape of
the yield curve are presented. An arbitrage-free framework using observed market
prices is introduced for valuing option-free bonds. This approach also holds for more
complex valuation of bonds with embedded options and other bond types.
READING ASSIGNMENTS
Reading 32
The Term Structure and Interest Rate Dynamics
by Thomas S.Y. Ho, PhD, Sang Bin Lee, PhD, and Stephen E.
Wilcox, PhD, CFA
Reading 33
The Arbitrage-Free Valuation Framework
by Steven V. Mann, PhD
© 2019 CFA Institute. All rights reserved.
© CFA Institute. For candidate use only. Not for distribution.
© CFA Institute. For candidate use only. Not for distribution.
READING
32
The Term Structure and
Interest Rate Dynamics
by Thomas S.Y. Ho, PhD, Sang Bin Lee, PhD, and
Stephen E. Wilcox, PhD, CFA
Thomas S.Y. Ho, PhD, is at Thomas Ho Company Ltd (USA). Sang Bin Lee, PhD, is at
Hanyang University (South Korea). Stephen E. Wilcox, PhD, CFA, is at Minnesota State
University, Mankato (USA).
LEARNING OUTCOMES
Mastery
The candidate should be able to:
a. describe relationships among spot rates, forward rates, yield to
maturity, expected and realized returns on bonds, and the shape
of the yield curve;
b. describe the forward pricing and forward rate models and
calculate forward and spot prices and rates using those models;
c. describe how zero-coupon rates (spot rates) may be obtained
from the par curve by bootstrapping;
d. describe the assumptions concerning the evolution of spot rates
in relation to forward rates implicit in active bond portfolio
management;
e. describe the strategy of riding the yield curve;
f. explain the swap rate curve and why and how market participants
use it in valuation;
g. calculate and interpret the swap spread for a given maturity;
h. describe the Z-spread;
i. describe the TED and Libor–OIS spreads;
j. explain traditional theories of the term structure of interest rates
and describe the implications of each theory for forward rates and
the shape of the yield curve;
(continued)
© 2014 CFA Institute. All rights reserved.
© CFA Institute. For candidate use only. Not for distribution.
Reading 32 ■ The Term Structure and Interest Rate Dynamics
6
LEARNING OUTCOMES
Mastery
The candidate should be able to:
k. describe modern term structure models and how they are used;
l. explain how a bond’s exposure to each of the factors driving the
yield curve can be measured and how these exposures can be
used to manage yield curve risks;
m. explain the maturity structure of yield volatilities and their effect
on price volatility.
1
INTRODUCTION
Interest rates are both a barometer of the economy and an instrument for its control.
The term structure of interest rates—market interest rates at various maturities—is
a vital input into the valuation of many financial products. The goal of this reading
is to explain the term structure and interest rate dynamics—that is, the process by
which the yields and prices of bonds evolve over time.
A spot interest rate (in this reading, “spot rate”) is a rate of interest on a security
that makes a single payment at a future point in time. The forward rate is the rate of
interest set today for a single-payment security to be issued at a future date. Section
2 explains the relationship between these two types of interest rates and why forward
rates matter to active bond portfolio managers. Section 2 also briefly covers other
important return concepts.
The swap rate curve is the name given to the swap market’s equivalent of the yield
curve. Section 3 describes in more detail the swap rate curve and a related concept,
the swap spread, and describes their use in valuation.
Sections 4 and 5 describe traditional and modern theories of the term structure
of interest rates, respectively. Traditional theories present various largely qualitative
perspectives on economic forces that may affect the shape of the term structure.
Modern theories model the term structure with greater rigor.
Section 6 describes yield curve factor models. The focus is a popular three-factor
term structure model in which the yield curve changes are described in terms of
three independent movements: level, steepness, and curvature. These factors can be
extracted from the variance−covariance matrix of historical interest rate movements.
A summary of key points concludes the reading.
2
SPOT RATES AND FORWARD RATES
In this section, we will first explain the relationships among spot rates, forward rates,
yield to maturity, expected and realized returns on bonds, and the shape of the yield
curve. We will then discuss the assumptions made about forward rates in active bond
portfolio management.
© CFA Institute. For candidate use only. Not for distribution.
Spot Rates and Forward Rates
At any point in time, the price of a risk-free single-unit payment (e.g., $1, €1, or
£1) at time T is called the discount factor with maturity T, denoted by P(T). The yield
to maturity of the payment is called a spot rate, denoted by r(T). That is,
P (T ) =
1
⎡⎣1 + r (T )⎤⎦
T
(1)
The discount factor, P(T), and the spot rate, r(T), for a range of maturities in years T
> 0 are called the discount function and the spot yield curve (or, more simply, spot
curve), respectively. The spot curve represents the term structure of interest rates
at any point in time. Note that the discount function completely identifies the spot
curve and vice versa. The discount function and the spot curve contain the same set
of information about the time value of money.
The spot curve shows, for various maturities, the annualized return on an optionfree and default-risk-free zero-coupon bond (zero for short) with a single payment
of principal at maturity. The spot rate as a yield concept avoids the complications
associated with the need for a reinvestment rate assumption for coupon-paying
securities. Because the spot curve depends on the market pricing of these option-free
zero-coupon bonds at any point in time, the shape and level of the spot yield curve
are dynamic—that is, continually changing over time.
As Equation 1 suggests, the default-risk-free spot curve is a benchmark for the
time value of money received at any future point in time as determined by the market supply and demand for funds. It is viewed as the most basic term structure of
interest rates because there is no reinvestment risk involved; the stated yield equals
the actual realized return if the zero is held to maturity. Thus, the yield on a zerocoupon bond maturing in year T is regarded as the most accurate representation of
the T-year interest rate.
A forward rate is an interest rate that is determined today for a loan that will be
initiated in a future time period. The term structure of forward rates for a loan made
on a specific initiation date is called the forward curve. Forward rates and forward
curves can be mathematically derived from the current spot curve.
Denote the forward rate of a loan initiated T* years from today with tenor (further
maturity) of T years by f(T*,T). Consider a forward contract in which one party to
the contract, the buyer, commits to pay the other party to the contract, the seller, a
forward contract price, denoted by F(T*,T), at time T* years from today for a zerocoupon bond with maturity T years and unit principal. This is only an agreement to
do something in the future at the time the contract is entered into; thus, no money
is exchanged between the two parties at contract initiation. At T*, the buyer will pay
the seller the contracted forward price value and will receive from the seller at time
T* + T the principal payment of the bond, defined here as a single currency unit.
The forward pricing model describes the valuation of forward contracts. The
no-arbitrage argument that is used to derive the model is frequently used in modern
financial theory; the model can be adopted to value interest rate futures contracts
and related instruments, such as options on interest rate futures.
The no-arbitrage principle is quite simple. It says that tradable securities with
identical cash flow payments must have the same price. Otherwise, traders would be
able to generate risk-free arbitrage profits. Applying this argument to value a forward
contract, we consider the discount factors—in particular, the values P(T*) and P(T*
+ T) needed to price a forward contract, F(T*,T). This forward contract price has to
follow Equation 2, which is known as the forward pricing model.
P(T* + T) = P(T*)F(T*,T)
(2)
To understand the reasoning behind Equation 2, consider two alternative investments:
(1) buying a zero-coupon bond that matures in T* + T years at a cost of P(T*+ T), and
(2) entering into a forward contract valued at F(T*,T) to buy at T* a zero-coupon bond
7
8
© CFA Institute. For candidate use only. Not for distribution.
Reading 32 ■ The Term Structure and Interest Rate Dynamics
with maturity T at a cost today of P(T*)F(T*,T). The payoffs for the two investments
at time T* + T are the same. For this reason, the initial costs of the investments have
to be the same, and therefore, Equation 2 must hold. Otherwise, any trader could sell
the overvalued investment and buy the undervalued investment with the proceeds to
generate risk-free profits with zero net investment.
Working the problems in Example 1 should help confirm your understanding of
discount factors and forward prices. Please note that the solutions in the examples
that follow may be rounded to two or four decimal places.
EXAMPLE 1
Spot and Forward Prices and Rates (1)
Consider a two-year loan (T = 2) beginning in one year (T* = 1). The one-year
spot rate is r(T*) = r(1) = 7% = 0.07. The three-year spot rate is r(T* + T) = r(1 +
2) = r(3) = 9% = 0.09.
1
Calculate the one-year discount factor: P(T*) = P(1).
2
Calculate the three-year discount factor: P(T* + T) = P(1 + 2) = P(3).
3
Calculate the forward price of a two-year bond to be issued in one year:
F(T*,T) = F(1,2).
4
Interpret your answer to Problem 3.
Solution to 1:
Using Equation 1,
P (1) =
1
(1 + 0.07)1
= 0.9346
Solution to 2:
P (3) =
1
(1 + 0.09)
3
= 0.7722
Solution to 3:
Using Equation 2,
0.7722 = 0.9346 × F(1,2).
F(1,2) = 0.7722 ÷ 0.9346 = 0.8262.
Solution to 4:
The forward contract price of F(1,2) = 0.8262 is the price, agreed on today, that
would be paid one year from today for a bond with a two-year maturity and a
risk-free unit-principal payment (e.g., $1, €1, or £1) at maturity. As shown in
the solution to 3, it is calculated as the three-year discount factor, P(3) = 0.7722,
divided by the one-year discount factor, P(1) = 0.9346.
2.1 The Forward Rate Model
This section uses the forward rate model to establish that when the spot curve is
upward sloping, the forward curve will lie above the spot curve, and that when the
spot curve is downward sloping, the forward curve will lie below the spot curve.
© CFA Institute. For candidate use only. Not for distribution.
Spot Rates and Forward Rates
The forward rate f(T*,T) is the discount rate for a risk-free unit-principal payment
T* + T years from today, valued at time T*, such that the present value equals the
forward contract price, F(T*,T). Then, by definition,
F (T *,T ) =
1
⎡⎣1 + f (T *,T )⎤⎦
(3)
T
By substituting Equations 1 and 3 into Equation 2, the forward pricing model can be
expressed in terms of rates as noted by Equation 4, which is the forward rate model:
⎡⎣1 + r (T * + T )⎤⎦
(T *+ T )
= ⎡⎣1 + r (T *)⎤⎦
T*
⎡⎣1 + f (T *,T )⎤⎦
T
(4)
Thus, the spot rate for T* + T, which is r(T* + T), and the spot rate for T*, which is
r(T*), imply a value for the T-year forward rate at T*, f(T*,T). Equation 4 is important
because it shows how forward rates can be extrapolated from spot rates; that is, they
are implicit in the spot rates at any given point in time.1
Equation 4 suggests two interpretations or ways to look at forward rates. For
example, suppose f(7,1), the rate agreed on today for a one-year loan to be made seven
years from today, is 3%. Then 3% is the
■
reinvestment rate that would make an investor indifferent between buying an
eight-year zero-coupon bond or investing in a seven-year zero-coupon bond
and at maturity reinvesting the proceeds for one year. In this sense, the forward
rate can be viewed as a type of breakeven interest rate.
■
one-year rate that can be locked in today by buying an eight-year zero-coupon
bond rather than investing in a seven-year zero-coupon bond and, when it
matures, reinvesting the proceeds in a zero-coupon instrument that matures
in one year. In this sense, the forward rate can be viewed as a rate that can be
locked in by extending maturity by one year.
Example 2 addresses forward rates and the relationship between spot and forward rates.
EXAMPLE 2
Spot and Forward Prices and Rates (2)
The spot rates for three hypothetical zero-coupon bonds (zeros) with maturities
of one, two, and three years are given in the following table.
Maturity (T)
Spot rates
1
2
3
r(1) = 9%
r(2) = 10%
r(3) = 11%
1
Calculate the forward rate for a one-year zero issued one year from today,
f(1,1).
2
Calculate the forward rate for a one-year zero issued two years from
today, f(2,1).
3
Calculate the forward rate for a two-year zero issued one year from today,
f(1,2).
4
Based on your answers to 1 and 2, describe the relationship between the
spot rates and the implied one-year forward rates.
1 An approximation formula that is based on taking logs of both sides of Equation 4 and using the approximation ln(1 + x) ≈ x for small x is f(T*,T) ≈ [(T* + T)r(T* + T) – T*r(T*)]/T. For example, f(1,2) in Example 2
could be approximated as (3 × 11% – 1 × 9%)/2 = 12%, which is very close to 12.01%.
9
10
© CFA Institute. For candidate use only. Not for distribution.
Reading 32 ■ The Term Structure and Interest Rate Dynamics
Solution to 1:
f(1,1) is calculated as follows (using Equation 4):
2
1
1
, )⎤⎦
⎡⎣1 + r (2)⎤⎦ = ⎡⎣1 + r (1)⎤⎦ ⎡⎣1 + f (11
(1 + 0.10)2
1
= (1 + 0.09) ⎡⎣1 + f (1,1)⎤⎦
1
,)=
f (11
(1.10)2
− 1 = 11.01%
1.09
Solution to 2:
f(2,1) is calculated as follows:
3
2
1
⎡⎣1 + r (3)⎤⎦ = ⎡⎣1 + r (2)⎤⎦ ⎡⎣1 + f (2,1)⎤⎦
(1 + 0.11)3
1
= (1 + 0.10) ⎡⎣1 + f (2,1)⎤⎦
2
f (2,1) =
(1.11)3
(1.10)2
− 1 = 13.03%
Solution to 3:
f(1,2) is calculated as follows:
⎡⎣1 + r (3)⎤⎦ = ⎡⎣1 + r (1)⎤⎦ ⎡⎣1 + f (1, 2)⎤⎦
3
1
2
(1 + 0.11)3
2
= (1 + 0.09) ⎡⎣1 + f (1, 2)⎤⎦
f (1, 2) =
1
2
(1.11)3
1.09
− 1 = 12.01%
Solution to 4:
The upward-sloping zero-coupon yield curve is associated with an upward-sloping
forward curve (a series of increasing one-year forward rates because 13.03% is
greater than 11.01%). This point is explained further in the following paragraphs.
The analysis of the relationship between spot rates and one-period forward rates
can be established by using the forward rate model and successive substitution,
resulting in Equations 5a and 5b:
⎡⎣1 + r (T )⎤⎦
T
, )⎤⎦ ⎡⎣1 + f (2,1)⎤⎦ ⎡⎣1 + f (3,1)⎤⎦!
= ⎡⎣1 + r (1)⎤⎦ ⎡⎣1 + f (11
, )⎤⎦
⎡⎣1 + f (T − 11
(5a)
r (T ) =
{⎡⎣1 + r (1)⎤⎦ ⎡⎣1 + f (11, )⎤⎦ ⎡⎣1 + f (2,1)⎤⎦ ⎡⎣1 + f (3,1)⎤⎦!⎡⎣1 + f (T − 1,1)⎤⎦}(
1 T)
−1
(5b)
Equation 5b shows that the spot rate for a security with a maturity of T > 1 can be
expressed as a geometric mean of the spot rate for a security with a maturity of T =
1 and a series of T ‒ 1 forward rates.
Whether the relationship in Equation 5b holds in practice is an important consideration for active portfolio management. If an active trader can identify a series
of short-term bonds whose actual returns will exceed today’s quoted forward rates,
then the total return over his or her investment horizon would exceed the return on
a maturity-matching, buy-and-hold strategy. Later, we will use this same concept to
discuss dynamic hedging strategies and the local expectations theory.
© CFA Institute. For candidate use only. Not for distribution.
Spot Rates and Forward Rates
Examples 3 and 4 explore the relationship between spot and forward rates.
EXAMPLE 3
Spot and Forward Prices and Rates (3)
Given the data and conclusions for r(1), f(1,1), and f(2,1) from Example 2:
r(1) = 9%
f(1,1) = 11.01%
f(2,1) = 13.03%
Show that the two-year spot rate of r(2) = 10% and the three-year spot rate of r(3)
= 11% are geometric averages of the one-year spot rate and the forward rates.
Solution:
Using Equation 5a,
2
, )⎤⎦
⎣⎡1 + r (2)⎤⎦ = ⎡⎣1 + r (1)⎤⎦ ⎡⎣1 + f (11
r (2) =
2
(1 + 0.09)(1 + 0.1101) − 1 ≈ 10%
3
, )⎤⎦ ⎡⎣1 + f (2,1)⎤⎦
⎣⎡1 + r (3)⎤⎦ = ⎡⎣1 + r (1)⎤⎦ ⎡⎣1 + f (11
r (3) =
3
(1 + 0.09)(1 + 0.1101)(1 + 0.1303) − 1 ≈ 11%
We can now consolidate our knowledge of spot and forward rates to explain
important relationships between the spot and forward rate curves. The forward rate
model (Equation 4) can also be expressed as Equation 6.
T*
⎪⎧⎡⎣1 + r (T * + T )⎤⎦ ⎪⎫ T
⎨
⎬ ⎡⎣1 + r (T * + T )⎤⎦ = ⎡⎣1 + f (T *,T )⎤⎦
⎩⎪ ⎡⎣1 + r (T *)⎤⎦ ⎭⎪
(6)
To illustrate, suppose T* = 1, T = 4, r(1) = 2%, and r(5) = 3%; the left-hand side of
Equation 6 is
1
⎛1.03 ⎞ 4
⎜
⎟ (1.03) = (1.0024)(1.03) = 1.0325
⎝1.02 ⎠
so f(1,4) = 3.25%. Given that the yield curve is upward sloping—so, r(T* + T) > r(T*)—
Equation 6 implies that the forward rate from T* to T is greater than the long-term
(T* + T) spot rate: f(T*,T) > r(T* + T). In the example given, 3.25% > 3%. Conversely,
when the yield curve is downward sloping, then r(T* + T) < r(T*) and the forward rate
from T* to T is lower than the long-term spot rate: f(T*,T) < r(T* + T). Equation 6 also
shows that if the spot curve is flat, all one-period forward rates are equal to the spot
rate. For an upward-sloping yield curve—r(T* + T) > r(T*)—the forward rate rises as
T* increases. For a downward-sloping yield curve—r(T* + T) < r(T*)—the forward
rate declines as T* increases.
11
12
© CFA Institute. For candidate use only. Not for distribution.
Reading 32 ■ The Term Structure and Interest Rate Dynamics
EXAMPLE 4
Spot and Forward Prices and Rates (4)
Given the spot rates r(1) = 9%, r(2) = 10%, and r(3) = 11%, as in Examples 2 and 3:
1
Determine whether the forward rate f(1,2) is greater than or less than the
long-term rate, r(3).
2
Determine whether forward rates rise or fall as the initiation date, T*, for
the forward rate is increased.
Solution to 1:
The spot rates imply an upward-sloping yield curve, r(3) > r(2) > r(1), or in
general, r(T* + T) > r(T*). Thus, the forward rate will be greater than the longterm rate, or f(T*,T) > r(T* + T). Note from Example 2 that f(1,2) = 12.01% >
r(1 + 2) = r(3) = 11%.
Solution to 2:
The spot rates imply an upward-sloping yield curve, r(3) > r(2) > r(1). Thus,
the forward rates will rise with increasing T*. This relationship was shown in
Example 2, in which f(1,1) = 11.01% and f(2,1) = 13.03%.
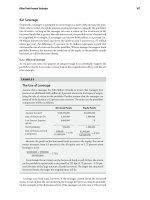
These relationships are illustrated in Exhibit 1, using actual data. The spot rates
for US Treasuries as of 31 July 2013 are represented by the lowest curve in the exhibit,
which was constructed using interpolation between the data points, shown in the table
following the exhibit. Note that the spot curve is upward sloping. The spot curve and
the forward curves for the end of July 2014, July 2015, July 2016, and July 2017 are also
presented in Exhibit 1. Because the yield curve is upward sloping, the forward curves
lie above the spot curve and increasing the initiation date results in progressively
higher forward curves. The highest forward curve is that for July 2017. Note that the
forward curves in Exhibit 1 are progressively flatter at later start dates because the
spot curve flattens at the longer maturities.
© CFA Institute. For candidate use only. Not for distribution.
Spot Rates and Forward Rates
Exhibit 1
Spot Curve vs. Forward Curves, 31 July 2013
Interest Rate (%)
4.5
4.0
3.5
3.0
2.5
2.0
1.5
1.0
0.5
0
14
16
18
20
22
24
26
July 2017
28
30
July 2014
Maturity (years)
Spot rate (%)
32
34
July 2016
36
38
40
42
July 2015
Spot Curve
1
2
3
5
7
10
20
30
0.11
0.33
0.61
1.37
2.00
2.61
3.35
3.66
When the spot yield curve is downward sloping, the forward yield curve will be
below the spot yield curve. Spot rates for US Treasuries as of 31 December 2006 are
presented in the table following Exhibit 2. We used linear interpolation to construct
the spot curve based on these data points. The yield curve data were also somewhat
modified to make the yield curve more downward sloping for illustrative purposes.
The spot curve and the forward curves for the end of December 2007, 2008, 2009,
and 2010 are presented in Exhibit 2.
13