magan phosphat hướng dẫn chung
Bạn đang xem bản rút gọn của tài liệu. Xem và tải ngay bản đầy đủ của tài liệu tại đây (5.79 MB, 12 trang )
Electrochimica Acta 106 (2013) 1–12
Contents lists available at SciVerse ScienceDirect
Electrochimica Acta
journal homepage: www.elsevier.com/locate/electacta
Effect of phosphating time and temperature on microstructure
and corrosion behavior of magnesium phosphate coating
M. Fouladi, A. Amadeh ∗
School of Metallurgy and Materials Engineering, College of Engineering, University of Tehran, P.O. Box 11155-4563, Tehran, Iran
a r t i c l e
i n f o
Article history:
Received 18 December 2012
Received in revised form 7 May 2013
Accepted 8 May 2013
Available online 21 May 2013
Keywords:
Magnesium phosphate
Newberyite
Coating
Corrosion
Mild steel
a b s t r a c t
In this study a novel phosphate coating, magnesium phosphate, was developed on steel surface. The formation of the coating was confirmed by X-ray diffraction method. Morphological evolution of the coating,
as a function of phosphating time and temperature, was examined by scanning electron microscope.
Magnetic thickness gauge was used to determine the thickness of the coating and the bath sludge weight
was specified to determine the bath efficiency. Corrosion behavior of the samples was studied using
potentiodynamic polarization curves. The results indicated that increasing the phosphating temperature
facilitated the precipitation of coating and increased its thickness. Furthermore the best corrosion behavior was observed at 80 ◦ C. Also increasing the phosphating time, enhanced both thickness and uniformity
of the coating. The best results were observed after 20 min of phosphating.
© 2013 Elsevier Ltd. All rights reserved.
1. Introduction
Carbon steels are widely used in various industries, due to
their high strength, good hardness and proper toughness, but
their low corrosion resistance limits their application in some
cases. Phosphating is one of the most important processes,
applied to steels, especially in automotive industries, to improve
their corrosion resistance, paintability and lubrication properties [1–3]. Phosphate coatings are usually applied on carbon
steel, galvanized steel, magnesium, aluminum and zinc, but in
some cases when improving the paintability is required they
are also applied on stainless steels [4–7]. Zinc, manganese and
iron phosphate coatings are the most common types of these
coatings [8–13]. Lots of research has been done to reach a good
corrosion resistance in phosphate coatings. Using a double cationic
phosphate coatings, post sealing of the coating with molybdate
or some other compounds and using additives, such as copper
ions and ethanolamine have shown to be effective for improving
the corrosion resistance of these coatings [14–18]. The type and
amount of accelerators has also shown to play an important role
in coating quality [9,19]. Several parameters affect the corrosion
resistance of a coating, e.g. thickness of coating, its porosity and
the microstructure. It has shown that increasing the thickness
of coating and decreasing its porosity, results in better corrosion
resistance [20,21]. One of the problems of the prevalent phosphate
coatings such as zinc and manganese phosphate coatings is their
∗ Corresponding author. Tel.: +98 21 82084090; fax: +98 21 88006076.
E-mail address: (A. Amadeh).
0013-4686/$ – see front matter © 2013 Elsevier Ltd. All rights reserved.
/>
low thickness. The normal thickness of zinc phosphate coating
is less that 10 m and for manganese or zinc–manganese phosphate coating can reach 20 m [14]. So it seems necessary to
find a way to increase the thickness of these coatings. Therefore
developing a novel phosphate coating with different chemical
composition can be effective. Although some research has been
done to develop third and secondary magnesium phosphate on
steel and magnesium respectively [22,23], but developing the
secondary magnesium phosphate on steel was never been studied.
So in this study, novel secondary magnesium phosphate coating is
developed on steel surface to improve its efficiency.
2. Experimental procedure
Mild steel sheets (50 mm × 40 mm × 1 mm) were used as the
substrate. Chemical composition of the substrate is given in Table 1.
The sheets were degreased in 10 wt.% NaOH solution at 60 ◦ C for
5 min. Abrading procedure was performed by 400 grit emery paper.
Then the samples were rinsed with acetone and deionized water
to remove any remaining grease from the surface. Afterwards the
samples were acid pickled using 10 wt.% H2 SO4 solution at 60 ◦ C
for 3 min to provide a proper base for nucleation of the phosphate
coating. They were then rinsed with deionized water again and
finally they were immersed in 350 mL volume of magnesium phosphate bath with the composition, mentioned in Table 2. To study
the effect of phosphating time, the samples were phosphated for
1, 3, 5, 10, 20 and 30 min while the temperature was stayed constant at 80 ◦ C. Also to study the effect of phosphating temperature,
the phosphating time was stayed constant at 20 min and phosphating was studied at 25 ◦ C, 40 ◦ C, 60 ◦ C, 80 ◦ C and 90 ◦ C. Formation of
2
M. Fouladi, A. Amadeh / Electrochimica Acta 106 (2013) 1–12
Table 1
The composition of steel substrate (wt.%).
Fe
C
Si
Mn
P
S
Ni
Al
Mo
Cu
Balance
0.02
0.01
0.21
0.007
0.006
0.02
0.054
0.01
0.004
Table 2
Chemical composition of magnesium phosphate bath.
Concentration
Bath composition
23 mL/L
8.5 g/L
0.4 g/L
6.8 g/L
H3 PO4 (85%)
MgCO3
NaNO2
NaOH
the coating was confirmed by X-ray diffraction method. Scanning
electron microscope was used to study the coating microstructure.
A magnetic thickness gauge was used to determine the coating
thickness. The results are the average of 5 measurements.
The sludge amount which precipitated in the bath after the process was separated using a filter paper and weighed in order to
determine the bath efficiency factor [22]. Bath efficiency factor can
be defined by Eq. (1). It defines a criterion of effectiveness of the
bath by changing different parameters, i.e. by increasing the coating thickness and decreasing the sludge weight, the bath efficiency
would be enhanced.
bath efficiency =
thickness of coating
sludge weight
(1)
Potentiodynamic polarization tests were performed by suspending the samples in 3.5 wt.% NaCl solution. The counter and
reference electrodes were platinum and Saturated Calomel Electrode (SCE), respectively. After about 1 h of stabilization at rest
potential, polarization test commenced at a scan rate of 2 mV/s
using an EG&G273 potentiostat instrument. To check the reproducibility of the tests, each sample was tested three times. Finally
the corrosion rate was calculated using Eq. (2) [24,25]:
corrosion rate = 0.326 × 10⁻²
icorr M
ZD
(2)
where icorr is the corrosion current density, M is the molecular
weight, D is the density of metal and Z is the metal capacity in oxidation state. The coating porosity percentage was also calculated
according to Eq. (3) [26,27]:
P=
Rps
× 10−(
Rp
Ecorr /ˇa )
× 100
(3)
where P is the total coating porosity percentage, Rps is the polarization resistance of bare substrate, Rp is the polarization resistance of
coated substrate in, Ecorr is the difference between free corrosion
potentials of coated and bare substrate, and ˇa is the anodic Tafel
slope of the substrate. Furthermore corrosion protection efficiency
was calculated according to Eq. (4) [15]:
Pe % =
1−
icorr
0
icorr
× 100
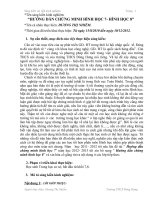
Fig. 1. XRD patterns of magnesium phosphate coating.
called newberyite, with the chemical formula of MgHPO4 ·3H2 O.
This material is also known as magnesium phosphate dibasic and
magnesium hydrogen phosphate. In XRD patterns all of the peaks
are related to newberyite except the two at 2Â = 44.76◦ and 65.16◦
which relate to iron and originates from steel substrate. The existence of these two peaks is because of the penetration of X-ray to
the substrate.
XRD pattern of the bath sludge, shown in Fig. 2, indicates that
the sludge is mostly consisted of amorphous compounds. There are
also some crystalline compounds in the sludge but it is not possible
to determine their composition due to the amorphous background.
Meanwhile it is obvious that the sludge does not include a considerable amount of newberyite phase. So it declares that the sludge
consists of some materials other than newberyite and much formation of sludge, means that the reactions do not shift toward the
formation of newberyite. The other possibility is that some amount
of newberyite which were not able to gain the substrate would precipitate as sludge in the bath and therefore it would decrease the
bath efficiency too.
3.2. Formation mechanism
The reactions which lead to formation of newberyite can be as
follows [28]:
(4)
where Pe is the corrosion protection efficiency of the coating, icorr
0
and icorr
are corrosion current density of coated sample and the
substrate, respectively.
3. Results and discussion
3.1. Phase analysis
X-ray diffraction pattern of the sample (Fig. 1) illustrates that
the coating formed on steel substrate is a single phase coating,
Fig. 2. XRD pattern of the sludge, precipitated from magnesium phosphate bath.
M. Fouladi, A. Amadeh / Electrochimica Acta 106 (2013) 1–12
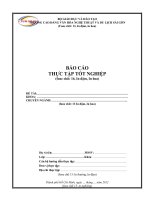
Fig. 3. SEM micrographs of magnesium phosphate coating at different bath temperatures (a) 25 ◦ C, (b) 40 ◦ C, (c) 60 ◦ C, (d) 80 ◦ C, (e) 90 ◦ C.
3
4
M. Fouladi, A. Amadeh / Electrochimica Acta 106 (2013) 1–12
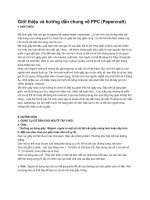
Fig. 4. Variation of coating thickness and sludge weight vs. bath temperature curves for magnesium phosphate coating.
Fig. 5. Variation of bath efficiency factor vs. bath temperature curve for magnesium phosphate coating.
Since in present study MgCO3 was used as the source of magnesium, so the decomposition reaction would occur as follows:
Magnesium hydroxide formed in this stage reacts with phosphoric
acid as follows:
MgCO3 → MgO + CO2
Mg(OH)2 + 2H3 PO4 → Mg(H2 PO4 )2 + 2H2 O
(R1)
Then, MgO would react with H2 O molecules to form Mg(OH)2 .
MgO + H2 O → Mg(OH)2
(R3)
Mg(H2 PO4 )2 formed in this stage is the primary magnesium phosphate which is soluble in water.
(R2)
Table 3
Corrosion data extracted from Fig. 6.
Temperature
(◦ C)
Ecorr (V vs SCE)
icorr (A/cm2 )
Rp (
cm2 )
Substrate
40
60
80
90
−0.501
−0.400
−0.433
−0.571
−0.648
16.05
16.459
6.337
0.549
5.475
1887
1703.34
5433.03
56772.81
6281.35
Corrosion rate
(mm/y)
Porosity (%)
Corrosion protection
efficiency (%)
0.368
0.375
0.144
0.012
0.124
–
23.62
14.61
0.37
0.69
–
10.01
65.35
97.00
70.06
M. Fouladi, A. Amadeh / Electrochimica Acta 106 (2013) 1–12
5
Fig. 6. Potentiodynamic polarization curves of magnesium phosphate coating applied at different temperatures.
Finally the secondary insoluble magnesium phosphate would
form according to (R4):
MgO + Mg(H2 PO4 )2 ·2H2 O → 2MgHPO4 ·3H2 O
(R4)
Also sodium nitrite can affect the bath by consuming H+ ions and
helping the precipitation of magnesium phosphate as follows:
NaNO2 → Na+ + NO2 −
(R5)
NO2 − + 2H+ + 2e− → (1/2)N2 + (1/2)O2 + H2 O
(R6)
It is due to mention that the aim of adding sodium hydroxide is to
adjust the pH, considering the fact that sodium hydroxide dissolves
in water and neutralizes H+ ions.
NaOH → Na+ + OH−
(R7)
H+ + OH− → H2 O
(R8)
3.2.1. Effect of bath temperature
To study the effect of bath temperature on coating quality, phosphating time stayed constant at 20 min. Fig. 3 shows the effect of
bath temperature on magnesium phosphate coating microstructure. No noticeable coating is formed at low temperatures such
as 25 ◦ C and 40 ◦ C. At these temperatures only a few crystals are
emerged after 20 min, indicating that although the reactions occur
at low temperatures but their kinetics is so slow. When the temperature of the bath rises to 60 ◦ C, more crystals appear, but still
no dense coating is formed at this temperature (Fig. 3c). At 80 ◦ C,
a dense and uniform coating is formed on steel surface. It means
that 80 ◦ C is a proper temperature for the formation of magnesium
phosphate coating and kinetics of the reactions is high enough at
this temperature. Further increase in temperature up to 90 ◦ C does
not change the morphology of the coating but causes the growth
of magnesium phosphate crystals. This effect can be attributed to
formation reaction of newberyite which is an endothermic reaction [28]. It means that by increasing the bath temperature the
mentioned reaction shifts toward the formation of newberyite.
Fig. 7. Effect of phosphating temperature on corrosion rate of magnesium phosphate coating.
6
M. Fouladi, A. Amadeh / Electrochimica Acta 106 (2013) 1–12
Fig. 8. Effect of phosphating temperature on coating protection efficiency and porosity of magnesium phosphate coating.
Fig. 4 shows the effect of bath temperature on coating thickness
and sludge weight of magnesium phosphate coating. As mentioned
before, by increasing the temperature, the reactions shift toward
the formation of newberyite and so it is reasonable for the coating thickness to enhance. Therefore by increasing the temperature
from 25 ◦ C to 80 ◦ C the thickness rises from 1 m to 30 m, but
there is no difference between the thickness of the coating at 80 ◦ C
and 90 ◦ C and at both conditions the thickness reaches 30 m. On
the other hand, the sludge weight rises slowly by increasing the
bath temperature, but there is a sharp increase between 80 ◦ C and
90 ◦ C and the sludge weight rises from 0.16 g to 0.33 g. So, despite
the fact that the thickness of the coating is the same at 80 ◦ C and
90 ◦ C but due to the sharp increase in sludge weight, the bath efficiency decreases a lot at 90 ◦ C. This fact can be seen in Fig. 5. It is
obvious that the greatest value of bath efficiency factor is achieved
at 80 ◦ C. It means that formation of the coating is more dominant
than formation of sludge at 80 ◦ C and coating thickness to sludge
weight ratio is more than the same ratio at other temperatures.
Hence, 80 ◦ C can be proposed as the optimum temperature for the
formation of magnesium phosphate coating. This temperature is
higher to some extent in comparison with formation temperature
of zinc phosphate coating, which is about 45–60 ◦ C [9,19,29], but it
is almost the same as the temperature applied for the formation of
double cationic zinc–manganese phosphate coating [14] and it is
about 10 ◦ C lower than the optimum temperature for manganese
phosphate bath [21,30].
Fig. 6 shows the potentiodynamic polarization curves of the
coating applied at different temperatures. Also Table 3 summarizes
the data, extracted from the curves. It can be seen that by increasing the phosphating temperature from 40 ◦ C to 60 ◦ C the corrosion
rate decreases about 2.6 times. On the other hand there is a considerable decrease in corrosion rate between 60 ◦ C and 80 ◦ C, i.e.
the corrosion rate decreases about 11.4 times. By comparing these
results with coating morphology and thickness, it is obvious that
the improvement in the corrosion resistance from 40 ◦ C to 80 ◦ C
can be attributed to increase of coating density and thickness. It is
reasonable that a thicker and denser barrier can better protect the
substrate.
On the other hand as it can be seen in Fig. 7 and Table 3, the
corrosion rate decreases continuously from 40 ◦ C to 80 ◦ C but it
increases about 10 times between 80 ◦ C and 90 ◦ C. So the minimum
corrosion rate is achieved at 80 ◦ C. Also, according to Figs. 4 and 8,
the most corrosion protection efficiency, the least porosity percentage and the heaviest thickness are all achieved at 80 ◦ C. So
80 ◦ C can be considered as optimum temperature for the formation
of magnesium phosphate coating. However, despite the fact that
the coating is not as favorable as 80 ◦ C at 90 ◦ C, but the samples
showed less corrosion rate and porosity percentage, more protection efficiency and heavier thickness at 90 ◦ C than 40 ◦ C and 60 ◦ C
(Figs. 4, 7 and 8).
As it was mentioned before, by increasing the bath temperature from 80 ◦ C to 90 ◦ C the coating thickness would stay constant
and the crystals would grow larger. The growth of coating crystals to larger sizes means that there is enough room for crystals to
grow, but the coating morphology showed to be dense enough at
80 ◦ C and there was no room for crystal growth. Therefore there
might be fewer crystals formed at 90 ◦ C than 80 ◦ C so there was
more room for these crystals to grow larger. This phenomenon
might be occurred because of the fact that the bath reaches its boiling temperature at 90 ◦ C, so the nucleation of phosphate crystals
encounters problem and the precipitated nuclei have more room
to grow. Hence because of lighter density of the coating at 90 ◦ C
than 80 ◦ C the corrosion rate increases.
3.2.2. Effect of phosphating time
It is clear that as time passes by, more reactions would occur,
more nuclei would form and the nuclei can grow larger. Therefore, proper phosphating time is needed for complete formation of
the coating. To study the effect phosphating time on coating quality, phosphating temperature stayed constant at 80 ◦ C. Fig. 9 shows
the effect of phosphating time on microstructure of magnesium
phosphate coating. As it is obvious, after 1 min of phosphating, as
shown in Fig. 9a only a few nuclei are formed on steel surface. But
after 3 min, more nuclei are emerged and the former nuclei have
grown (Fig. 9b). After 5 min, almost the most portion of sample’s
surface is covered by magnesium phosphate nuclei at this condition, the nucleation stage is almost completed, but the growth stage
would still go on (Fig. 9c). It should be mentioned that nucleation of
phosphate crystals would not end up completely at this time and it
would be continued in the coating free regions and porosities. At the
10th minute of phosphating, almost a dense coating is formed but
there are also some few regions without newberyite crystals. Also
M. Fouladi, A. Amadeh / Electrochimica Acta 106 (2013) 1–12
Fig. 9. SEM micrographs of magnesium phosphate coating at different phosphating times (a) 1 min, (b) 3 min, (c) 5 min, (d) 10 min, (e) 20 min, (f) 30 min.
7
8
M. Fouladi, A. Amadeh / Electrochimica Acta 106 (2013) 1–12
Fig. 10. Variation of coating thickness and sludge weight vs. phosphating time curves for magnesium phosphate coating.
Fig. 11. Variation of bath efficiency factor vs. phosphating time curve for magnesium phosphate coating.
Table 4
Corrosion data extracted from Fig. 12.
Sample
Ecorr (V vs SCE)
icorr (A/cm2 )
Rp (
cm2 )
Substrate
5
10
20
30
−0.501
−0.562
−0.594
−0.571
−0.671
16.05
15.745
13.023
0.549
4.932
1887
1825.44
2174.81
56772.81
6667.46
Corrosion rate
(mm/y)
Porosity (%)
Corrosion protection
efficiency (%)
0.368
0.360
0.297
0.012
0.112
–
14.01
6.09
0.37
0.41
–
13.91
28.80
97.00
73.04
M. Fouladi, A. Amadeh / Electrochimica Acta 106 (2013) 1–12
9
Fig. 12. SEM cross-section micrograph of the sample phosphated at 80 ◦ C for 20 min using backscattered electron detector.
the coating is not well uniform at this time. As it is obvious in Fig. 9e
a dense coating with uniform crystals is formed after 20 min. There
is no noticeable coating free region in this condition. After 30 min
of phosphating (Fig. 9f), the coating is almost dense enough but the
uniformity of the coating is less than what was achieved at 20 min.
On the other hand as it is obvious in Fig. 9e and f, the crystals grow
larger over time and their size increased from what was observed
after 20 min.
The effect of phosphating time on coating thickness and sludge
weight are shown in Fig. 10. It is obvious that as the time goes on,
the thickness of the coating enhances. Also it can be seen that after
5 min of phosphating, the slope of thickness–phosphating time
curve decreases and the rate of increasing the coating thickness
reduces. This means that after 5 min, when the nucleation stage
is almost completed, the coating formation rate decreases. Also
the sludge weight–phosphating time curve shows that although
the sludge weight increases over time, but there is only 0.08 g
difference in sludge weight, from the first to the 30th minute. It
would show that most of the sludge would form at the nucleation
stage.
Furthermore it is obvious in Fig. 11 that bath efficiency factor
has its maximum value after 10 min of phosphating. It means that
either an increase or decrease of the phosphating duration would
decrease the bath efficiency.
Accordingly, it can be concluded from Figs. 9–11 that although
the best bath efficiency is achieved at 10 min of phosphating but
the coating formed is not uniform enough. Regarding this fact it
can be concluded that despite the fact that there are 20% difference in bath efficiency factor between the coatings formed after 10
and 20 min but since the coating is thicker and more uniform after
20 min, so 20 min of phosphating can be considered as the optimum duration for the formation of magnesium phosphate coating.
A comparison with other phosphate coatings reveals that the optimum phosphating time for most of the phosphate coatings is about
10 min [19,30,31].
To verify the accuracy of the magnetic thickness gauge, a SEM
cross-section micrograph of the sample which was phosphate at
80 ◦ C for 20 min is provided using backscattered electron detector
(Fig. 12). As it is obvious, the coating thickness is about 28–33 m
which is in accordance with the data achieved by magnetic thickness gauge (30 m).
Potentiodynamic polarization curves (Fig. 13) show the effect of
phosphating time on corrosion behavior of the samples. Also Table 4
summarizes the data, extracted from the curves. As it can be seen
Fig. 13. Potentiodynamic polarization curves of magnesium phosphate coating applied at different phosphating times.
10
M. Fouladi, A. Amadeh / Electrochimica Acta 106 (2013) 1–12
Fig. 14. Effect of phosphating time on corrosion rate of magnesium phosphate coating.
in Fig. 13 and Table 4, phosphating the steel improves its corrosion resistance. Also it is obvious in Fig. 14 that by increasing the
phosphating time from 5 to 20 min the corrosion rate decreases
continuously. As it is obvious there is no noticeable difference
between the corrosion rates of the samples after 5–10 min of phosphating, But by increasing the phosphating time from 10 to 20 min
there is a considerable decrease in corrosion rate, i.e. the corrosion
rate decreases from 0.297 mm/y to 0.012 mm/y. It means that by
increasing the phosphating time from 10 to 20 min the corrosion
rate decreases about 25 times.
To clarify this behavior, it can be mentioned that by increasing
the phosphating time, a denser and thicker phosphate layer would
form on steel surface and thicker layer would act as better corrosion
protector.
On the other hand by increasing the phosphating time from
20 to 30 min the corrosion rate increases from 0.012 mm/y to
0.112 mm/y. Also there is a sharp decrease in corrosion protection
efficiency between 20 and 30 min. To clarify this fact, as it is obvious
in Table 4 and Fig. 15 coating porosity increases a little from 20th to
30th minutes. Furthermore it is visible in higher magnification SEM
micrographs of the samples phosphated for 20 and 30 min (Fig. 16),
that there is more porosity in the coating after 30 min than 20 min.
Also the crystals are larger at 30th minutes of phosphating. So it can
be concluded that since the nucleation stage is completed before
the 30th minutes of phosphating, but the growth is still continuing
at this time, so by growth of some crystals to larger sizes the surrounding crystals which may not be well adhered to the substrate
would be detached from the substrate and leave some porosities
instead.
A novel phosphate coating, magnesium phosphate, was developed successfully on steel surface. The following conclusions can
be made from this investigation:
Fig. 15. Effect of phosphating time on coating protection efficiency and porosity of magnesium phosphate coating.
M. Fouladi, A. Amadeh / Electrochimica Acta 106 (2013) 1–12
11
Fig. 16. SEM micrographs of magnesium phosphate coating after (a) 20 min (500×), (b) 20 min (1000×), (c) 30 min (500×), (d) 30 min (1000×).
4. Conclusion
1. Increasing the bath temperature increased both the coating
thickness and the sludge weight. The maximum value for
coating thickness and bath efficiency factor was achieved at
bath temperature of 80 ◦ C. There was a sharp increase in
sludge weight and decrease in bath efficiency factor, between
80 ◦ C and 90 ◦ C, i.e. the sludge formed at 90 ◦ C was about 2
times more than what was formed at 80 ◦ C by weight and it
caused the bath efficiency factor to be decreased. Increasing
the bath temperature also caused the growth of coating crystals and increased the coating density up to 80 ◦ C. Enhancing
the temperature more than 80 ◦ C, increased the crystal size
but decreased the coating density. Furthermore the best corrosion behavior was achieved at 80 ◦ C, i.e. the corrosion rate was
0.012 mm/y at this temperature. It can be concluded that 80 ◦ C
is the optimum temperature for the formation of newberyite
film.
2. Increasing the phosphating time enhanced both the coating
thickness and the sludge weight. Between 5 and 10 min the
nucleation stage was almost completed and the crystals formed
in this stage grew larger overtime. The maximum value for bath
efficiency factor was achieved after 10 min of phosphating, but a
dense and uniform coating with suitable thickness was formed
after 20 min. The best corrosion behavior was also observed after
20 min. Further increase in phosphating time (more than 20 min)
decreased the uniformity, density and corrosion resistance of the
coating. Therefore 20 min of phosphating can be considered as
the optimum time for the formation of magnesium phosphate
coating.
References
[1] M. Manna, Characterisation of phosphate coatings obtained using nitric acid
free phosphate solution on three steel substrates: an option to simulate TMT
rebars surfaces, Surface and Coatings Technology 203 (2009) 1913.
12
M. Fouladi, A. Amadeh / Electrochimica Acta 106 (2013) 1–12
[2] T.K. Rout, H.K. Pradhan, T. Venugopalan, Enhanced forming properties of
galvannealed steel sheet by polymanganese phosphate coating, Surface and
Coatings Technology 201 (2006) 3496.
[3] M. Zubielewicz, E.K. Tarnawska, A. Kozłowska, Protective properties of organic
phosphate-pigmented coatings on phosphated steel substrates, Progress in
Organic Coatings 53 (2005) 276.
[4] P.E. Tegehall, N.G. Vannerberg, Nucleation and formation of zinc phosphate
conversion coating on cold-rolled steel, Corrosion Science 32 (1991) 635.
[5] J. Flis, J. Mankowski, T. Zakroczymski, T. Bell, The formation of phosphate
coatings on nitrided stainless steel, Corrosion Science 43 (2001) 1711.
[6] W. Zhou, D. Shan, E.H. Han, W. Ke, Structure and formation mechanism of
phosphate conversion coating on die-cast AZ91D magnesium alloy, Corrosion
Science 50 (2008) 329.
[7] K. Ogle, A. Tomandl, N. Meddahi, M. Wolpers, The alkaline stability of phosphate
coatings I: ICP atomic emission spectro electrochemistry, Corrosion Science 46
(2004) 979.
[8] G.Y. Li, J.S. Lian, L.Y. Niu, Z.H. Jiang, Q. Jiang, Growth of zinc phosphate coatings
on AZ91D magnesium alloy, Surface and Coatings Technology 201 (2006) 1814.
[9] L.Y. Niu, Z.H. Jiang, G.Y. Li, C.D. Gu, J.S. Lian, A study and application of zinc phosphate coating on AZ91D magnesium alloy, Surface and Coatings Technology
200 (2006) 3021.
[10] D. Weng, P. Jokiel, A. Uebleis, H. Boehni, Corrosion and protection characteristics of zinc and manganese phosphate coatings, Surface and Coatings
Technology 88 (1996) 147.
[11] S.H.L. Zhang, H.H. Chen, X.L. Zhang, M.M. Zhang, The growth of zinc phosphate
coatings on 6061-Al alloy, Surface and Coatings Technology 202 (2008) 1674.
[12] M.C.M. Farias, C.A.L. Santos, Z. Panossian, A. Sinatora, Friction behavior of lubricated zinc phosphate coatings, Wear 266 (2009) 873.
[13] S. Jegannathan, T.S.N.S. Narayanan, K. Ravichandran, S. Rajeswari, Performance
of zinc phosphate coatings obtained by cathodic electrochemical treatment in
accelerated corrosion tests, Electrochimica Acta 51 (2005) 247.
[14] G. Li, L. Niu, J. Lian, Z. Jiang, A black phosphate coating for C1008 steel, Surface
and Coatings Technology 176 (2004) 215.
[15] B.L. Lin, J.T. Lu, G. Kong, Effect of molybdate post-sealing on the corrosion resistance of zinc phosphate coatings on hot-dip galvanized steel, Corrosion Science
50 (2008) 962.
[16] X. Sun, D. Susac, R. Li, K.C. Wong, T. Foster, K.A.R. Mitchell, Some observations for
effects of copper on zinc phosphate conversion coatings on aluminum surfaces,
Surface and Coatings Technology 155 (2002) 46.
[17] Q. Li, S.H. Xu, J. Hu, S.H. Zhang, X. Zhong, X. Yang, The effects to the structure and electrochemical behavior of zinc phosphate conversion coatings with
ethanolamine on magnesium alloy AZ91D, Electrochimica Acta 55 (2010) 887.
[18] C.Y. Tsai, J.S. Liu, P.L. Chen, C.S. Lin, A two-step roll coating phosphate/molybdate
passivation treatment for hot-dip galvanized steel sheet, Corrosion Science 52
(2010) 3385.
[19] L.B. Lan, L.J. Tang, K. Gang, L. Jun, Growth and corrosion resistance of molybdate modified zinc phosphate conversion coatings on hot-dip galvanized steel,
Trans. Nonferr. Met. Soc. China 17 (2007) 755.
[20] E.P. Banczek, P.R.P. Rodrigues, I. Costa, Evaluation of porosity and discontinuities in zinc phosphate coating by means of voltammetric anodic dissolution
(VAD), Surface and Coatings Technology 203 (2009) 1213.
[21] C.M. Wang, H.C. Liau, W.T. Tsai, Effect of heat treatment on the microstructure and electrochemical behavior of manganese phosphate coating, Materials
Chemistry and Physics 102 (2007) 207.
[22] M.F. Morks, Magnesium phosphate treatment for steel, Materials Letters 58
(2004) 3316.
[23] T. Ishizaki, I. Shigematsu, N. Saito, Anticorrosive magnesium phosphate coating
on AZ31 magnesium alloy, Surface and Coatings Technology 203 (2009) 2288.
[24] E.E. Stansbury, Fundamentals of Electrochemical Corrosion, ASM International,
Ohio, 2000, pp. 233–363.
[25] ASTM standard G 102-89, ASTM International, 2004, 03.02.
[26] V.F.C. Lins, G.F.A. Reis, Electrochemical impedance spectroscopy and linear
polarization applied to evaluation of porosity of phosphate conversion coatings
on electrogalvanized steels, Surface and Coatings Technology 253 (2006)
2875.
[27] J. Creus, H. Mazille, H. Idrissi, Porosity evaluation of protective coatings onto
steel, through electrochemical techniques, Surface and Coatings Technology
130 (2000) 224.
[28] A. Wagh, Chemically Bonded Phosphate Ceramics, Elsevier, 2004, pp. 102.
[29] L. Kouisni, M. Azzi, M. Zertoubi, F. Dalard, S. Maximovitch, Phosphate coatings
on magnesium alloy AM60 part1: study of the formation and the growth of zinc
phosphate films, Surface and Coatings Technology 185 (2004) 58.
[30] Y. Totik, The corrosion behaviour of manganese phosphate coatings applied to
AISI 4140 steel subjected to different heat treatments, Surface and Coatings
Technology 200 (2006) 2711.
[31] L. Lazzarotto, C. Marechal, L. Dubar, A. Dubois, J. Oudin, The effects of processing
bath parameters on the quality and performance of zinc phosphate stearate
coatings, Surface and Coatings Technology 122 (1999) 94.