Growth and stability of litchi production in Muzaffarpur district of Bihar, India
Bạn đang xem bản rút gọn của tài liệu. Xem và tải ngay bản đầy đủ của tài liệu tại đây (376.87 KB, 12 trang )
Int.J.Curr.Microbiol.App.Sci (2020) 9(5): 708-719
International Journal of Current Microbiology and Applied Sciences
ISSN: 2319-7706 Volume 9 Number 5 (2020)
Journal homepage:
Original Research Article
/>
Growth and Stability of Litchi Production in
Muzaffarpur District of Bihar, India
Janmejay Kumar* and Nikky Kumari
Dr. Rajendra Parsad Central Agricultural University, Pusa, Bihar
ATMA, Muzaffarpur, Bihar, India
*Corresponding author
ABSTRACT
Keywords
Litchi, Growth,
Area. Stability
productivity,
Muzaffarpur etc.
Article Info
Accepted:
05 April 2020
Available Online:
10 May 2020
This study in aimed at growth and stability of litchi production in
Muzaffarpur district of Bihar with specific objectives of determining trend
in area, production and productivity of litchi. India is the second largest
producer of litchi in the world after China. Presently in India, litchi is
cultivated in an area about 74.40 thousand hectares with total production of
483.60 thousand metric tons and productivity of 6.50 metric tons / hectare.
Bihar produces nearly cultivated in an area about 31.1 thousand hectares
with a total production of 227 thousand metric tons and productivity of 7.3
metric tons / hectare. It is mainly cultivated in the old district of
Muzaffarpur, Champarn and Darbhanga. The study reveals that the growth
rates in area, production and productivity is positive and found 2.76, 3.82
and 0.98, per cent respectively in India while in Bihar it is recorded 1.19,
3.02 and 1.75 per cent and negative rate -0.19, -2.07 and -2.03 per cent
respectively in Muzaffarpur.
India, it is cultivated extensively in
temperature regions or Australia, South
Africa, Thailand, Mauritius and Hongkong
etc.
Introduction
Litchi (Litchi chinensis) is the important subtropical evergreen fruit crop, belonging to
family sapindaceae and originated from china
during 300 years ago. Litchi reached India
through Myanmar by the end of the 17th
Century and then spread over in many tropical
and subtropical area of the world. Its
homeland, china still remains the biggest
producer of litchi. India is the second largest
litchi producing country in the world. Beside
Litchi is famous for its excellent quality
pleasant flavor and attractive red color. Litchi
fruit contains about 60 percent Juice, 8 per
cent of rag, 19 percent seed and 13 percent
rind which depends upon the varieties and the
climate under which it is grown. The principle
chemical constituents are carbohydrates,
708
Int.J.Curr.Microbiol.App.Sci (2020) 9(5): 708-719
organic acids, vitamins, pigments, protein and
fat. Litchi fruit is considerably rich in sugar
and the sugar content in fruit of Indian
varieties varies from 6.74 to 18.0 per cent
with the average of 11.85 per cent. Litchi is
also an excellent source of vitamin „C‟
(ascorbic acid) ranging from40.20 to 90
mg/100 g. It also contains protein (0.8-0.9 %
fat (0.3 %) pectin (0.42 %) and minerals
specially calcium phosphorus and iron (0.7
%). Thus Litchi fruits add to the country‟s
total production of bulky food over and its
nutritive values, which is of ultimate utility at
the present Juncture under nutrition.
Champaran, West Champaran, Sitamarhi and
Darbhanga.
The
Muzaffarpur
district
contributes highest area and production of
litchi in state. Muzaffarpur is the largest litchi
producing district with a production of 56.066
matric tones followed by Vaishali at 26,498
matric tones and Sitamarhi at 15,518 matric
tones West Champaran and East Champaran
and Katihar having of more than 10,000
matric tones.
Materials and Methods
Growth in area, production, productivity
of litchi in Bihar and Muzaffarpur India
Litchi is popular and delicious fruit of India.
It cultivation is confined to Northern and
some North-Eastern state of India. There has
been substantial increase in area and
production of litchi in India during last 50
years. Area has increased from 9,400 hectares
(1949-50) to over 86,000 ha (2016-17). The
contribution of litchi to total area under fruit
has increased from 0.75 to nearly 2 %.Litchi
has limited distribution in India particularly in
the Indo-Gang tic plans form Bengal to
Punjab. It is grown in the Bihar, Tripura,
West Bengal, Uttrakhand, Uttar Pradesh,
Punjab and Haryana of the total Production of
litchi in India. 45 percent contributed by
Bihar followed by W.B, Jharkhand, Assam
and Chhatisgarh. Productivity is highest in
Punjab which almost double to the National
average. Litchi occupies an important place in
the horticultural landscape of Bihar owing to
its geographic confinement and the magnitude
of its share to the overall production in the
country.
The data obtained on area, production,
productivity of litchi for the period 2001-02 to
2015-16 in India, Bihar and Muzaffarpur were
used for the estimation of compound growth
rates. The data were computerized to get the
compound growth rates in area, production,
productivity.
Compound growth rate
The compound growth rates were estimated
by fitting exponential foundation for the data.
The equation fitted was of the following form
Y = abt
Where,
Y=
Area
(000ha)/production
(000MT)/productivity (MT/ha)
a = constant
b= Regression coefficient
t = time period in years.
Litchi is produced in 27 district of Bihar with
32,600 ha area 2, 15,100 matric tons of
production and 7.0 metric tons /hectare
productivity. (Indian Horticulture Data base
2015). In Bihar Litchi is mainly grown on
large scale in the districts of North Bihar,
Muzaffarpur, Samastipur, Vaishali, East
Finally, the annual rate of compound growth
in area, production and productivity of litchi
were work out by using the formula
r = (Antilog b -1) x 100
709
Int.J.Curr.Microbiol.App.Sci (2020) 9(5): 708-719
The significance of the estimated compound
growth rates was tested with the help of
student‟s (“T”) test.
hectare (1.53 per cent) in the year 2012-13.
Further in 2013-14, the area extended to 84.70
thousand hectare i.e. 2.05 per cent over the
previous year 2014-15 the area increased
84.95 thousand hectare, finally in 2015-16 the
area increased 85.00 thousand hectares i.e.
0.59 per cent over previous year increased in
area of litchi cultivation from 2001-02 to
2015-16 was mainly due to remunerative
price of litchi.
To know the variation in area, production,
years, the co- efficient of variance (CV) was
worked out by employing the following
formula:
CV + standard division / mean X 100.
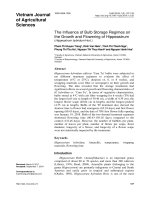
The production of litchi fruit in India in 200102 is seen as 355.90 thousand MT in 2002-03
it increased to 476.40 thousand MT (33.85 per
cent) and it further increased marginally to
478.50 thousand MT (0.44 per cent) in
subsequent year due to adoption of plant
protection measures. Where as in 2004-05,
the production decreased to 368.60 thousand
MT (-22.96 per cent) and inter covered to
392.10 thousand MT (6.37 per cent) in the
subsequent year in 2006-07. The production
raised further to 403.00 thousand MT (2.77
per cent) in 2006-07 and it was 418.00
thousand MT (3.72 per cent) in the year 200708. In 2008-09 the production increased to
423.00 thousand MT (1.20 per cent) over the
previous year in 2009-10 the production
increased to 483.30 thousand (14.26 per cent)
over the previous year. In 2010-11 it
increased to 497.00 thousand MT (2.83 per
cent) over the previous year and it increased
to 538.13 thousand MT (8.28 per cent) over
the previous year in 2011-12. The production
level of litchi in India again increased in
2012-13 and 2013-14 to 580.00 thousand MT
and 585.30 thousand MT respectively. In
2014-15 production level decreased to 528.26
thousand MT i.e. -9.75 per cent. Finally in
2015-16
production
level
increased
comparatively previous year to 610.30
thousand MT i.e. 5.53 per cent over previous
year.
Results and Discussion
Trends
in
area,
production
productivity of litchi in India
and
In this section an attempt has been made to
analyze the compound growth rate (CGR) and
per cent change in area production and
productivity of the litchi in India and the data
pertaining to it was accessed from the
secondary source for a period of fifteen years
(2001-02 to 2015-16). The area, production
and productivity of litchi in India from 200102 to 2015-16 has been presented in the
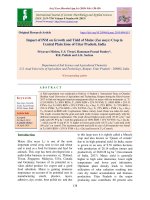
table:1 The area under litchi cultivation in
2001-02 is seen as 58.10 thousand hectares in
2002-03 they are decreased to 54.10 thousand
hectares i.e. -6.86 per cent over the previous
year and it further decreased to 53.70.
Hectares (-0.73 per cent) in the subsequent
year where as in 2004-05 they are increased
to 60.00 thousands hectare thousands hectare
(11.73 per cent) and again it further increased
to 63.20 thousand hectares (5.33 per cent) in
the year 2005-06, 65.00 thousands hectare
(0.04 per cent) in the year 2006-07 and 69.00
thousand hectares (6.15 per cent) in 2007-08.
Further in 2008-09 the area extended to 72.00
thousand hectares i.e. 4.34 per cent over the
previous year and again it increased to 74.40
thousand hectares (3.33 per cent) in 2009-10.
78.00 thousand hectare (4.83 per cent) in the
year 2010-11, 81.75 thousand hectare (4.81
per cent) in the year 2011-12, 83.00 thousand
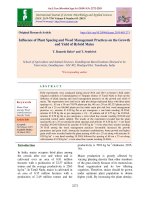
The productivity of litchi fruit in India in
2001-02 is seen 6.1 MT/ha which increased to
710
Int.J.Curr.Microbiol.App.Sci (2020) 9(5): 708-719
8.8 MT/ha 44.26 per cent in 2002-03 and 8.9
MT/ha (1.13 per cent) in the year 2003-04,
where in 2004-05.
it remained constant at 28.40 thousand
hectares in subsequent year. Further in 200607, the area increased to 28.80 thousand
hectares (3.47 per cent) in the subsequent
year. Similarly, in 2008-09 the area increased
to 30.5 thousand hectares (2.35 per cent) and
it increased to 30.6 thousand hectares in the
subsequent year. Further, in 2010-11 the area
increased to 31.1 thousand hectares (1.63 per
cent).
The productivity decreased to 6.1 MT/ha (31.46 per cent) and then recovered to 6.2
MT/ha (1.63 per cent) in the year 2005-06.
The productivity remained stable at 6.2
MT/ha in 2006-07 and 6.1 MT/ha in 2007-08
whereas 2008-09, the productivity decreased
to 5.9 MT/ha (-3.28 per cent) and then
recovered to 6.5 MT/ha (10.17 per cent) in the
year 2009-10. The productivity decreased to
6.4 MT/ha in 2010-11 (-1.54 per cent) and it
marginally increased to 6.5 MT/ha in 201112. Where as in 2012-13, the productivity
increased to 6.9 MT/ha (6.15) over the
previous year and it remained stable to 6.9
MT/ha in the subsequent year in 2014-15, the
productivity decreased to 6.3 MT/ha (-8.70
per cent). Finally in 2015-16 the productivity
same increased to 6.6 MT/ha (4.55 per cent)
over the previous year.
The production of litchi in Bihar 2001-02 was
221.7 thousand MT in 2002-03 it increased to
336.9 thousand MT i.e. 51.96 per cent
increases over the previous year which is quit
a substantial growth due to increased
productivity level and it further increased to
339.0 thousand MT (0.62 per cent) in
subsequent year. In 2004-05, the production
decreased to 204.9 thousand MT i.e. -39.55
per cent a decline over the previous year and
further again it decreased to 200.1 thousand
MT (-2.34 per cent) in the subsequent year. In
2006-07 the production increased further to
211.9 thousand MT (5.89 per cent) over the
previous year and 223.2 thousand MT (5.33
per cent) in the subsequent year. In 2008-09,
the production declined marginally to 2016.9
thousand MT (-2.82 per cent) and 215.1
thousand MT (-0.82 per cent) in the
subsequent year. In 2010-11, the production
increased to 227.0 thousand MT i.e. 5.53 per
cent over the previous year. In 2011-12 the
production increased 256.2 thousand MT i.e.
11.39 per cent and 2012-13 the production
increased in 310.2 thousand MT and
percentage decline in 3.68 in 2013-14 the
production increased 321.6 thousand MT i.e.
(3.16 per cent) i.e. in the year 2014-15 the
production increased to 332.1 per cent MT i.e.
3.16 per cent respectively. Finally in 2015-16
the production increased to 336.4mt i.e. 1.28
per cent over the previous year.
The compound growth rates for area
production and productivity were 2.76 per
cent, 3.83 per cent and productivity 0.98 per
cent respectively.
Trends
in
area,
production
productivity of litchi in Bihar
and
In this section an attempt has been made to
analyze the compound growth rate (CGR) and
per cent change in area, production and
productivity at the litchi in Bihar for the
period of fifteen tears (2001-02 to 2015-16).
The area, production and productivity of litchi
in Bihar from 2001-02 to 2015-16 has been in
table- 2. The area under litchi in 2001-02 is
seen as 27.70 thousand hectares where as in
2002-03 the area increased to 29.10 thousand
hectare (-2.74 per cent) in the subsequent
year. Similarly in 2004-05, the area increased
to 28.40 thousand hectares (0.35 per cent) and
The productivity of litchi fruit in Bihar in
2001-02 shows that 8.0mt/ha and in 2002-03
711
Int.J.Curr.Microbiol.App.Sci (2020) 9(5): 708-719
it increased to 11.6mt/ha (45 per cent) and
further it increased to 12.0mt/ha (3.44 per
cent) in the subsequent year. In 2004-05, the
productivity decreased to 7.2mt/ha (-40 per
cent) and letter slightly improved to 7.0mt/ha
(-2.77 per cent) in the year in the subsequent
year. In 2006-07, the productivity increased to
7.4mt/ha i.e. 5.71 per cent over the previous
year and it further increased to 7.5mt/ha in the
subsequent year. In 2008-09, the productivity
decreased by 5.33 per cent and again it
decreased by 1.40 per cent in the subsequent
year. In 2010-11, the productivity increased to
7.3mt/ha (4.28 per cent) in 2011-12, the
productivity 8.0 increased by 9.56 per cent
and again 2012-13 the productivity increased
9.6mt/ha i.e. (20.00 per cent) then 2013-14
the productivity increased 10.2mt/ha and 3.03
per cent. Finally in 2015-16, the productivity
increased to 10.3mt/ha (0.98 per cent).
in 2006-07, the area increased to 7,157 ha i.e.
0.25 per cent increased over the previous year
and further to 7,206 ha in 2007-08 the area
increased by 0.31 per cent in 2008-09 over the
previous year and by 0.33 per cent in the
subsequent year. In 2010-11the area under
litchi increased to 7.28/ha (0.38 per cent)
increased over the previous year and further
to 7289 ha in 2011-12. The area increased by
0.15 per cent in 2012-13 over the previous
year and it remains unchanged in the
subsequent year. In 2014-15 the area under
litchi declined by 0.03 per cent. Finally in
2015-16 the area same increased 7303 ha i.e.
0.06 per cent.
The production of litchi fruit in Muzaffarpur
district of Bihar in 2001-02 was 74000 MT in
2002-03 it decreased to 53.000mt (-28.30 per
cent and it increased to 75000mt (41.50 per
cent) in subsequent year. In 2004-05, the
production increased to 85,548 MTi.e. 14.06
per cent rise over the previous year and it
slightly decreased to 57096mt (-33.25 per
cent) in the subsequent year due to under able
climatic conditions. In 2006-07, the
production slightly declined to 52687mt and it
marginal increased to 55826 MT in 2007-08.
In 2008-09 the production decreased to 54322
MT and further to 51496 MT in the
subsequent year. Whereas during the year
2010-11 the production increased by 4.62 per
cent over the previous year. The production
slightly increased to 53879mt and it marginal
increased to 53886mt in 2011-12. In 2012-13
the production increased to 58980mt and it
remains same in the subsequent year. In 201415 the production decreased by 5.48 per cent.
Where during the year 2015-16 the
production decreased by 1.08 per cent over
the previous year.
The compound growth rates for area,
production and productivity were 1.19, per
cent 3.02 per cent and 1.15 per cent
respectively. Among the all these variables
has shown significant growth rate is similar to
the trend at all India level.
In this section an attempt has been made of
analyze the compound growth rate (CGR) and
per cent change in area, production and
productivity of litchi in Muzaffarpur district
of Bihar for fifteen years (2001-02 to 201516).
The area, production and productivity of litchi
in Muzaffarpur district from 2001-02 to 201516 has been presented in the table- 3.
The area under litchi in 2001-02 is seen as
7,517 ha where as in 2002-03 the area
increased to 7,667 ha where as it remained
constant at 7,667 ha in the subsequent year. In
2004-05, the area decreased by 6.44 per cent
over the previous year and again it further
declined by 0.47 per cent in 2005-06 where as
The productivity of litchi in Muzaffarpur
district of Bihar in 2001-02 was 10-0mt/ha. In
2002-03 it was decreased to 6.0 MT/ha and it
marginally increased to 9.7 MT/ ha (61.66 per
712
Int.J.Curr.Microbiol.App.Sci (2020) 9(5): 708-719
cent) in the subsequent year. In 2004-05, the
productivity further increased to 11.9mt/ha
(22.68) and it decreased to 7.9mt/ha (-33.6
per cent in the 2005-06, 7.3 MT/ha in 200607 and it increased to 7.7mt/ha (5.47 per cent)
in the year 2007-08 in 2008-09, the
productivity declined by 2.59 per cent over
the previous year and again it further declined
by 5.33 per cent in the subsequent year. In
2010-11 and it increased to 7.4 MT/ha (4.2
per cent). In 2011-12 the productivity remains
unchanged over the previous year and it
further increased by 9.5 per cent in the
subsequent year. In 2014-15 the productivity
declined to 7.6 MT/ha i.e. (-6.2 per cent).
Finally in 2015-16, the productivity decreased
to 7.5mt/ha i.e. (-1.3 per cent) over the
previous year. The compound growth rates for
area, production and productivity were -0.19,
-2.07 and -2.03 per cent respectively.
In conclusion, growth and stability the area
under litchi has increased significantly both in
Bihar and India, but production has declined
significantly in Muzaffarpur, while in India it
has increased but not significantly. The
productivity has declined significantly in
Muzaffarpur and India both which resulted in
decreased production even there was
significant increase in area.
Table.1 Percentage change and growth rates in area, production and productivity of litchi in
India (2001-02 to 2015-16)
S.
No.
Year
Area in
1000 ha
2001-02
58.10
2002-03
54.10
2003-04
53.70
2004-05
60.00
2005-06
63.20
2006-07
65.00
2007-08
69.00
2008-09
72.00
2009-10
74.40
2010-11
78.00
2011-12
81.75
2012-13
83.00
2013-14
84.70
2014-15
84.95
2015-16
85.00
Percent change in over
2001-02 to 2015-16
2.76
CGR
11.40
SD
16.05
CV
1% - 2.977 Significant,5% - 2.145 Significant
1.
2.
3.
4.
5.
6.
7.
8.
9.
10.
11.
12
13.
14.
15.
Percentage
over
previous
Production
in 1000
MT
-6.88
-0.73
11.73
5.33
0.04
6.15
4.34
3.33
4.83
4.81
1.53
2.05
0.30
0.59
46.30
355.90
476.40
478.50
368.60
392.10
403.00
418.00
423.00
483.30
497.00
538.13
580.00
585.30
528.26
610.30
3.83
81.24
17.07
713
Percentage
over
previous
year
33.85
0.44
-22.96
6.37
2.77
3.72
1.19
14.25
2.83
8.28
7.78
0.91
-9.75
15.53
71.48
Productivity
(in MT/ha)
6.10
8.8
8.9
6.1
6.2
6.2
6.1
5.9
6.5
6.4
6.5
6.9
6.9
6.3
66
0.98
0.92
13.74
Percentage
over
previous
year
44.26
1.13
-31.46
1.63
0
-1.61
-3.28
10.17
-1.54
1.56
6.15
0.00
-8.70
4.55
8.20
Int.J.Curr.Microbiol.App.Sci (2020) 9(5): 708-719
Table.2 Percentage change and growth rate in area, production and productivity of litchi in Bihar
S.
No.
Year
Area
(1000ha)
1.
2.
3.
4.
5.
6.
7.
8.
9.
10.
11
12.
13.
14.
15.
2001-02
2002-03
2003-04
2004-05
2005-06
2006-07
2007-08
2008-09
2009-10
2010-11
2011-12
2012-13
2013-14
2014-15
2015-16
Per cent change in
2015-16 over 2001-02
27.7
29.1
28.3
28.4
28.4
28.8
29.8
30.5
30.6
31.1
31.8
32.1
32.4
32.4
32.7
Per cent change
over previous
year
5.05
-2.74
0.35
0.00
1.40
3.47
2.34
0.32
1.63
0.94
0.93
0.00
0.00
0.91
18.05
Production
(1000mt)
221.7
336.9
339.0
204.9
200.1
211.9
223.2
216.9
215.1
227.0
256.2
310.2
321.6
332.1
336.4
1.19
CGR
Per cent change
over previous
year
51.96
0.62
-39.55
-2.34
5.89
5.33
-2.82
-0.82
5.53
11.39
3.68
3.36
3.16
1.28
51.73
3.02
Yield
mt/ha
8.0
11.6
12.0
7.2
7.0
7.4
7.5
7.1
7.0
7.3
8.0
9.6
9.9
10.2
10.3
Per cent change
over previous
year
4.5
3.44
-40
-2.77
5.71
1.35
-5.33
-1.40
4.28
9.58
20.00
3.12
3.03
0.98
28.75
1.75
Note: - ** significantly at 1 per cent level of probability. *Significant at 5 Per cent level of probability2011-12 the area some increase in 31.8
thousand hectare (0.94 per cent) and 2012-13 percentage decrease in 0.93 the year 2013-14 and 2014-15 same the subsequent area and percentage
finally in 2015-16. The area was increased to 32.7 thousand hectare i.e. 0.91 per cent over the previous year. The increased trend is the bet ter
return being received by the litchi growers.
Table.3 Trends in area, production and productivity of litchi in Muzaffarpur district of Bihar
S. No.
Year
Area
(ha)
1.
2.
3.
4.
5.
6.
7.
8.
9.
10.
11.
12.
13.
14.
15.
2001-02
2002-03
2003-04
2004-05
2005-06
2006-07
2007-08
2008-09
2009-10
2010-11
2011-12
2012-13
2013-14
2014-15
2015-16
Per cent change in
2015-16 over 2001-02
CGR
5%
1%
7517
7667
7667
7173
7139
7157
7206
7229
7253
7281
7289
7300
7300
7298
7303
Per cent
over
previous
year
1.99
0.00
-6.44
-0.47
0.25
0.68
0.31
0.33
0.38
0.11
0.15
0.00
-0.03
0.06
-2.84
Production
(MT)
74000
53000
75000
85548
57096
52687
55826
54322
51496
53879
53886
58980
58980
55746
55146
-0.19
2.145
2.977
-2.07
Note: - **1% Level of significance at probability*5% Level of significance at probability
714
Per cent
change over
previous
year
-28.30
41.50
14.06
-33.25
-7.72
5.95
-25.81
-5.20
4.62
0.01
9.45
0.00
-5.48
-1.08
-25.48
Productivity
MT/ha
10.0
6.0
9.7
11.9
7.9
7.3
7.7
7.5
7.1
7.3
7.3
8.1
8.1
7.6
7.5
-2.03
Per cent
change over
previous
year
-40.00
61.66
22.68
-33.60
-7.59
5.47
-2.59
-5.33
2.81
0.0
9.5
0.00
-6.2
-1.3
-25
Int.J.Curr.Microbiol.App.Sci (2020) 9(5): 708-719
Production
715
Int.J.Curr.Microbiol.App.Sci (2020) 9(5): 708-719
716
Int.J.Curr.Microbiol.App.Sci (2020) 9(5): 708-719
Area
Production
Productivity
717
Int.J.Curr.Microbiol.App.Sci (2020) 9(5): 708-719
Hectares (-0.73 per cent) in the subsequent
year where as in 2004-05 they are increased
to 60.00 thousands hectare thousands hectare
(11.73 per cent) and again it further increased
to 63.20 thousand hectares (5.33 per cent) in
the year 2005-06, 65.00 thousands hectare
(0.04 per cent) in the year 2006-07 and 69.00
thousand hectares (6.15 per cent) in 2007-08.
Further in 2008-09 the area extended to 72.00
thousand hectares i.e. 4.34 per cent over the
previous year and again it increased to 74.40
thousand hectares (3.33 per cent) in 2009-10.
78.00 thousand hectare (4.83 per cent) in the
year 2010-11, 81.75 thousand hectare (4.81
per cent) in the year 2011-12, 83.00 thousand
hectare (1.53 per cent) in the year 2012-13.
Further in 2013-14, the area extended to 84.70
thousand hectare i.e. 2.05 per cent over the
previous year 2014-15 the area increased
84.95 thousand hectare, finally in 2015-16 the
area increased 85.00 thousand hectares i.e.
0.59 per cent over previous year increased in
area of litchi cultivation from 2001-02 to
2015-16 was mainly due to remunerative
price of litchi.
The production of litchi fruit in India in 200102 is seen as 355.90 thousand MT in 2002-03
it increased to 476.40 thousand MT (33.85 per
cent) and it further increased marginally to
478.50 thousand MT (0.44 per cent) in
subsequent year due to adoption of plant
protection measures. Where as in 2004-05,
the production decreased to 368.60 thousand
MT (-22.96 per cent) and inter covered to
392.10 thousand MT (6.37 per cent) in the
subsequent year in 2006-07. The production
raised further to 403.00 thousand MT (2.77
per cent) in 2006-07 and it was 418.00
thousand MT (3.72 per cent) in the year 200708. In 2008-09 the production increased to
423.00 thousand MT (1.20 per cent) over the
previous year in 2009-10 the production
increased to 483.30 thousand (14.26 per cent)
over the previous year. In 2010-11 it
increased to 497.00 thousand MT (2.83 per
cent) over the previous year and it increased
to 538.13 thousand MT (8.28 per cent) over
the previous year in 2011-12. The production
level of litchi in India again increased in
2012-13 and 2013-14 to 580.00 thousand MT
and 585.30 thousand MT respectively. In
2014-15 production level decreased to 528.26
thousand MT i.e. -9.75 per cent. Finally in
2015-16
production
level
increased
comparatively previous year to 610.30
thousand MT i.e. 5.53 per cent over previous
year.
The productivity of litchi fruit in India in
2001-02 is seen 6.1 MT/ha which increased to
8.8 MT/ha 44.26 per cent in 2002-03 and 8.9
MT/ha (1.13 per cent) in the year 2003-04,
where in 2004-05.
The productivity decreased to 6.1 MT/ha (31.46 per cent) and then recovered to 6.2
MT/ha (1.63 per cent) in the year 2005-06.
The productivity remained stable at 6.2
MT/ha in 2006-07 and 6.1 MT/ha in 2007-08
whereas 2008-09, the productivity decreased
to 5.9 MT/ha (-3.28 per cent) and then
recovered to 6.5 MT/ha (10.17 per cent) in the
year 2009-10. The productivity decreased to
6.4 MT/ha in 2010-11 (-1.54 per cent) and it
marginally increased to 6.5 MT/ha in 201112. Where as in 2012-13, the productivity
increased to 6.9 MT/ha (6.15) over the
previous year and it remained stable to 6.9
MT/ha in the subsequent year in 2014-15, the
productivity decreased to 6.3 MT/ha (-8.70
per cent). Finally in 2015-16 the productivity
same increased to 6.6 MT/ha (4.55 per cent)
over the previous year.
The compound growth rates for area
production and productivity were 2.76 per
cent, 3.83 per cent and productivity 0.98 per
cent respectively.
References
Choubey,
718
Manesh(1997).
A
study
on
Int.J.Curr.Microbiol.App.Sci (2020) 9(5): 708-719
production and marketing of litchi
(Litchi chinensis) in Bihar. M.Sc.
(Agri.)
(Unpublished)
Thesis,
Department of Agricultural Economics,
Indian Agricultural Research Institute,
New Delhi.
Kanwar, J.S. and G.S., Nijjar (1984).
Comparative evaluation of fruit growth
in relation to cracking of fruit in some
litchi
cultivars.
The
Punjab
horticultural journal, XXIII (1-4):82
Kumar, Ram and Kotur S. P. (1992). Litchi
survey in Muzafarpur area of North
Bihar. National seminar on recent
development in litchi production, May
30-31 at Pusa. Pp. 7-8.
Kumar, Suresh (1997). A study of dynamics
of production and marketing of litchi in
Muzaffarpur district of Bihar. M.Sc.
(Agri.) (Unpublished) Thesis, Rajendra
Agricultural University, Pusa.
Pandey, R.M. (1990). Horticultural crops
New vista for growth. The Hindu
Survey of India Agriculture. P.P. 177181.
Prasad Lallan Kumar (1993). Why maximum
production of litchi in Muzaffarpur. Nav
Bharat Times, (Hindi) July 7.
Ray, P.K. (2004) Litchi production
technology and postharvest handling for
export
Rajendra
Agricultural
University, Pusa : 28
RumanaAkter, M. Serajul Islam and Golam
Rabbani (2016). Financial analysis of
litchi (Litchi chinensis) production in
Dinajpur district of Bangladesh. The
Agricultrist 14 (2) 32.
Singh, H. P. (2017). Dynamic of Research
and Development of Litchi: Way
forward.
Former,
DDG,
ICAR.
Gyanmatharn, vol. VI, National
conference on perspective of challenges
and option in Litchi Production and
Utilization. 6-7 June 2017. ICARNational Research Center on Litchi,
Muzaffarpur,Bihar.37.A
Scientific
Journal of Krishi Foundation.
How to cite this article:
Janmejay Kumar and Nikky Kumari. 2020. Growth and Stability of Litchi Production in
Muzaffarpur District of Bihar, India. Int.J.Curr.Microbiol.App.Sci. 9(05): 708-719.
doi: />
719

![Growth and yield of Ashwagandha [Withania somnifera (L.)] as influenced by different intercropping system in Kymore plateau of Madhya Pradesh](https://media.store123doc.com/images/document/2020_01/09/medium_vsb1578562778.jpg)