Exchange rate volatility and causality effect of Sri Lanka (LKR) with Asian emerging countries currency against ÚD
Bạn đang xem bản rút gọn của tài liệu. Xem và tải ngay bản đầy đủ của tài liệu tại đây (704.49 KB, 18 trang )
International Journal of Management (IJM)
Volume 11, Issue 2, February 2020, pp. 191–208, Article ID: IJM_11_02_021
Available online at />Journal Impact Factor (2020): 10.1471 (Calculated by GISI) www.jifactor.com
ISSN Print: 0976-6502 and ISSN Online: 0976-6510
© IAEME Publication
Scopus Indexed
EXCHANGE RATE VOLATILITY AND
CAUSALITY EFFECT OF SRI LANKA (LKR)
WITH ASIAN EMERGING COUNTRIES
CURRENCY AGAINST USD
Kasilingam Lingaraja
Assistant Professor, Department of Business Administration
Thiagarajar College (Autonomous), Madurai -09, India
C. Jothi Baskar Mohan
Associate Professor & Head, Department of Business Administration
Thiagarajar College (Autonomous), Madurai -09, India
Murgesan Selvam
Professor & Head, Department of Commerce and Financial Studies
Bharathidasan University, Trichy – 24, India
Mariappan Raja
Assistant Professor, Department of Business Commerce
Bharathidasan University Constituent College, Lalgudi, Trichy.India
Chinnadurai Kathiravan
Research Scholar, Department of Commerce and Financial Studies
Bharathidasan University, Trichy – 24, India
ABSTRACT
This study an attempt to examine the long-run volatility and causality effects of Sri
Lankan (LKR) currency and nine currency of emerging countries in Asia against USD
over 17 years i.e., from 01st January, 2002 to 31st December, 2018 by using the
Descriptive Statistics (Summary), GARCH (1,1) Model, Correlation and Granger
Causality Test. A descriptive statistics and Graphical model were specified and
empirical results show a significant currencies movements and the Granger causality
test indicates the strong evidence that the causation runs between Sri Lankan currency
(LKR / USD) to nine Asian emerging countries currency price behavior against USD.
The purpose of the study is to make a finer point with respect to relationship, volatility
and causality effect between the Sri Lankan currency and Asian Emerging countries
/>
191
Kasilingam Lingaraja, C. Jothi Baskar Mohan, Murgesan Selvam
currency returns against USD. It is found that the significant uni-directional causality
effects and relationships among the sample currency data series with LKR against USD.
Hence, this result would help to international portfolio managers, multinational
corporations, and policymakers for decision-making in the Asian region.
Keywords: Foreign Exchange Market, Granger Causality, Correlation, Exchange Rate
Volatility, Asian Emerging Countries and Sri Lanka (LKR/USD)
Cite this Article: Kasilingam Lingaraja, C. Jothi Baskar Mohan, Murgesan Selvam,
Mariappan Raja and Chinnadurai Kathiravan, Exchange Rate Volatility And Causality
Effect Of Sri Lanka (Lkr) With Asian Emerging Countries Currency Against Usd,
International Journal of Management (IJM), 11 (2), 2020, pp. 191–208.
/>JEL Classifications: C50; C58; F31; R15; O34
1. INTRODUCTION
Exchange rate volatility has been a constant feature of the International Monetary System ever
since the breakdown of the Bretton Woods system of fixed parities in 1971 (Black, F and
Scholes, M (1973). Many theories were that a change in the exchange rates would affect a
firm’s foreign operation and overall profits. It is widely acknowledged that international
financial markets and exchange rate value of countries currency have become substantially
integrated in recent years. On the one hand, the collapse of the Bretton Woods system was
followed by greater exchange rate fluctuations. On the other, the liberalization of markets and
capital flows in the 1990s was followed by a huge increase in the volume of cross border
transactions in both securities and currencies. Liu et al. (2019) & Lingaraja et.al. (2014 &
2015) denotes that the merchandise trade and portfolio investment are most helpful in
increasing the direct use of currency, while foreign direct investment (FDI) has a stronger effect
on promoting vehicle use. Kathiravan et al., 2019, investigated the Causal effect among the
three weather factors (temperature, humidity, and wind speed) and the returns of the Agriculture
Commodity Index called Dhaanya, in India. Hence, the volatility and causality effect of foreign
exchange markets has been a topic of interest of academic researchers and practitioners alike.
1.1. THE CONCEPTUAL FRAMEWORK
i) FRONTIER: It is a type of developing country which is more developed than the least
developing countries, but too small, risky, or illiquid to be generally considered an emerging
market. The term is an economic term which was coined by International Finance Corporation’s
Farida Khambata in 1992. The frontier, or pre-emerging equity markets are typically pursued
by investors seeking high, long-run return potential as well as low correlations with other
countries economic variables. Some frontier market countries were emerging position in the
past, but have regressed to frontier status. Frontiers are countries that because of demographics,
development, politics and liquidity are considered less mature than Emerging countries
(Source: MSCI)
ii) EMERGING: The concept of “Emerging”, used in the beginning of the 1980s, was
initially developed to designate financial markets located in developing countries. The tem
“Emerging Markets” was first coined by World Bank economist, Antoine W. Van Agtmael,
1981, to refer to nations undergoing rapid economic growth, currency value, and
industrialization. The term is often used interchangeably with 'emerging and developing
economies and describe it as economies with low to middle per capita income (Economy
Watch, 2010). The emerging countries are differentiated from developed, with respect to
several qualitative characteristics, such as institutional infrastructure, taxation of dividends and
capital gains, capital controls, market regulations, currency value and available information
/>
192
Mariappan Raja and Chinnadurai Kathiravan, Exchange Rate Volatility And Causality Effect Of Sri
Lanka (Lkr) With Asian Emerging Countries Currency Against Usd
flows. The quality of these factors is generally lower for emerging countries than for the
developed. These conditions affect, to a large extent, trading activity, price formulation, and as
a result, the risk-return properties of emerging countries stock markets (Mohamed E1 Hedi
Arouri et al., 2010).
iii) DEVELOPED: It is a country that is most developed in terms of its economy, currency
and capital markets. The country must have high income, but this also includes openness to
foreign ownership, ease of capital movement, and efficiency of market institutions. As well,
they have highly developed capital and money markets with high levels of liquidity, meaningful
regulatory bodies, large market capitalization, and high levels of per capita income. (Source:
MSCI).
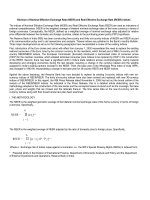
According to the criteria adopted by the Morgan Stanley Capital International (MSCI), the
world countries are classified under three categories such as Developed, Emerging and Frontier
are grouped into three regional classification by continent wise i.e., 1) Americas, 2) Europe,
Middle East & Africa and 3) Asia.
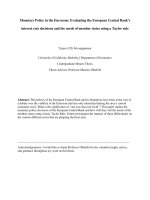
It is clear that there are five counties under developed markets categories in Asia, Nine
countries under emerging markets categories in Asia and eight countries under frontier markets
categories in Asian continent. The list of Asian countries under three category of classification
by MSCI is given in Figure – 1
Source: Morgan Stanley Capital International (MSCI) as on 30.07.2019.
Figure – 1: List of Countries in the Asian Region under Frontier, Emerging and Developed Categories
/>
193
Kasilingam Lingaraja, C. Jothi Baskar Mohan, Murgesan Selvam
2. LITERATURE REVIEW
Yamani, E (2019), investigated the diversification role of currency momentum for carry trade
crashes during the turbulent periods surrounding the 1997-1998 Asian financial crisis and the
2007-2008 global financial crisis by used 24 global currencies from December 31, 1996 to May
11, 2017. This study found that the combined strategy was a good hedge with desirable
diversification merits in times of financial stress. Khademalomoom, S and Narayan, P
(2019), inspected intraday patterns in the currency market for hourly exchange rates of the six
most liquid currencies (i.e. the Australian Dollar, British Pound, Canadian Dollar, Euro,
Japanese Yen, and Swiss-Franc) vis-à-vis the United States Dollar over the period 2004-2014.
It was noted that currencies’ behaviour induced by these intraday effects had implications for
investors. Liu et al. (2019), investigated the currency use in financial transactions using the
SWIFT dataset from October 2010 to August 2014. Kunkler, M and MacDonald, R (2019),
examines the multilateral relationship between oil and G10 currencies during from 31st
December 1985 to 31st December 2017. It was found that that the global price of oil moves
multilaterally with a group of “oil” currencies: the Norwegian krone, the Australian dollar, the
Canadian dollar and the British pound and also it was clearly noted that the Japanese Yen and
the Swiss Franc move multilaterally against the group of oil currencies and not against the
global price of oil. McCauley, R and Shu (2019), investigated how variation in Chinese
authorities’ renminbi management since the August 2015 exchange rate reform maps on to
variation in the co-movement between the renminbi with regional and other emerging market
currencies. An efficient market provides, on continues basis, a platform for no opportunities to
engage in profitable trading activities. If a market is not efficient, the regulatory authorities
normally take necessary steps to ensure that the stocks are correctly priced, leading to stock
market efficiency. Kathiravan et al. (2018), investigated the effect of three weather factors
(temperature, humidity and wind speed), on the returns of the Indian stock market indices (BSE
Sensex and S&P CNX Nifty) and used granger causality and Correlation. Shu et al. (2015),
examined the changes in the RMB/ USD rates in two markets have a statistically and
economically significant impact on changes in Asian currency rates against the US dollar during
the data between September 2010 (when quotes for the CNH rates became regular) and
September 2013. It is suggested that China's regional influence is increasingly transmitted
through financial channels. The efficiency of emerging markets is characterized by regular and
unexpected changes in variance. It is to be noted that national and international events in
countries, pave the way for high volatility (Lingaraja et al., 2014). Ben Rejeb, A and
Boughrara, A (2013), studied the impact of financial liberalization on the degree of
informational efficiency in emerging stock markets while considering three types of financial
crises, i.e. Banking, Currency and Twin crises. The study revealed that emerging markets were
characterized by greater efficiency in recent years. Tudor, C and Popescu – Dutaa, C (2012),
investigated the issue of Granger causality between stock prices and exchange rates movement
for Developed (Australia, Canada, France, Hong Kong, Japan, United Kingdom, and United
States) and Emerging financial markets (Brazil, China, India, Korea, Russia and South Africa)
during the period from January 1997 to March 2012. This study employed tools like Descriptive
Statistics and Granger Causality Tests for the analysis. Charoenwong et al. (2009),
investigated volatility forecast and compare the predictive power of the implied volatility
derived from currency option prices that are traded on the Philadelphia Stock Exchange
(PHLX), Chicago Mercantile Exchange (CME), and over-the-counter market (OTC) with four
currency pairs from October 1, 2001 to September 29, 2006. It was clearly noted that the implied
volatility provides more information about future volatility–regardless of whether it is from the
OTC, PHLX, or CME markets–than time series based volatility. Lagoarde-Segot, T and
Brian M. Lucey (2008), examined the informational efficiency of seven emerging MiddleEastern North African (MENA) stock markets. The study found that the extent of weak-form
/>
194
Mariappan Raja and Chinnadurai Kathiravan, Exchange Rate Volatility And Causality Effect Of Sri
Lanka (Lkr) With Asian Emerging Countries Currency Against Usd
efficiency in the MENA stock markets was primarily explained by differences in stock market
size. Alan T. Wang (2007), examined the volatility of currency futures options for Australian
dollar (AD), British pound (BP), Canadian dollar (CD), Deutsche mark (DM), and Japanese
yen (JY) and used the sample of daily exchange rates and options with maturities from the
beginning of January 1998 to the beginning of September 2001. Dunis, C and Huang, X
(2002), examined the use of non-parametric Neural Network Regres- sion (NNR) and Recurrent
Neural Network (RNN) regression models for forecasting and trading currency volatility, with
an application to the GBP/ USD and USD/JPY exchange rates for the period April 1999 – May
2000. This study threw light on the currency option market was inefficient and/or the pricing
formulae applied by market participants were inadequate.
From the earlier studies it has been found that researchers examined Risk and Return,
volatility and relationship between Foreign exchange market and Stock Market using currency
exchange rates and stock market indices price. But no study has been carried out causality effect
and volatility of Asian region’s currencies under emerging category countries with Frontier
country like Sri Lanka (LKR) on long run period i.e. 17 years. In order to fill this gap, the
present study has been undertaken.
3. PROBLEM STATEMENT OF THE STUDY
Reserve Bank of India (RBI) report indicates the foreign exchange markets experienced a
substantial increase in volatility in August 2007 and most of the countries amongst Asian
currencies, the US Dollar depreciated by 2.7 per cent against Chinese yuan, but appreciated by
52.2 per cent against Korean won, 24.7 per cent against the Indian rupee, 13.6 per cent against
the Malaysian ringgit and 11.9 per cent against Thai baht. The currencies of many emerging
and developing economies suffered large depreciations with the onset of the global financial
crisis during 2007-09. The exchange rate losses varied largely commensurate with the extent
and nature of each country's exposure to trade and global financial operations. Most of the Asian
currencies underwent depreciation during 2011 and showed significant volatility, coinciding
with the world economic and financial conditions. The international investor tolerance (or
expectations) could put downward pressure on the US Dollar and upward pressure on many
Asian currencies. In addition, Asia also faces the challenge of surges in short-term capital
inflows and the consequent upward pressure on currency values. While some corporates and
financial institutions in Asia may remain vulnerable to their home currency depreciations, in
aggregate, these economies have moved from running current account deficits to surpluses and
stockpiled reserves in US Dollars and Euros. Hence, this study.
3.1. Significance and Importance of the Study
Understanding the causes of exchange rate volatility provides valuable insight for policy makers
to design appropriate measures or intervention strategies in mitigating a country’s vulnerability
to risk in periods of uncertainty. The changes in exchange rates will have both favorable and
unfavorable impacts on economic activities and living standard of the public because of the
largely globalized trade and finance involving the exchange of currencies. In addition that,
identifying the sources of exchange rate volatility is important, as maintaining a competitive
and stable exchange rate is necessary for promoting private investment, domestic and foreign,
needed to meet the growth and development targets in the country. Hence, this study an attempt
to test Causality Effect and Volatility of Sri Lanka Currency (LKR) with Asian Emerging
Countries Currency against USD.
/>
195
Kasilingam Lingaraja, C. Jothi Baskar Mohan, Murgesan Selvam
4. OBJECTIVES OF THE STUDY
The objectives of this study are as follows:
To analyse the summary statistics (Mean, Maximum, Minimum and SD) among the
selected sample currencies against USD.
To examine the exchange rate volatility among the selected sample currencies
against USD.
To analyse relationship between Sri Lanka (LKR) and Asian emerging currencies
against USD
To investigate the causality effect between Sri Lanka (LKR) and Asian emerging
currencies against USD.
5. HYPOTHESES OF THE STUDY
In the light of the objective of this study, the following Null Hypotheses are developed and
tested in the analysis.
NH01: There is no long-run exchange rate volatility among the sample countries currency
against USD during the study period.
NH02: There is no long-run significant relationship (movements) between Asian emerging
currency and Sri Lanka (LKR) against USD during the study period.
NH03: There is no long-run causality (linkage) effect between Asian emerging currency and
Sri Lanka (LKR) against USD during the study period.
6. RESEARCH METHODOLOGY
6.1. Data
For the purpose of the study, we use the MSCI system of nine emerging Asian countries and
one Sri Lankan (frontier) country exchange rates (ten currencies) against the US Dollar
(numeraire currency). The ten currency universe consists of the following ten currencies:
Chinese Yuan Renminbi (CNY), Indian Rupee (INR), Korean Won (KRW), Taiwan New
Dollar (TWD), Malaysian Ringgit (MYR), Thai Baht (THB), Indonesian Rupiah (IDR),
Philippine Peso (PHP), Pakistani Rupee (PKR) and Sri Lankan Rupee (LKR). The details of
sample Countries, Currencies and their Symbols are shown in Table – 1.
Table – 1
The Details of Sample Currencies and Symbols
Emerging Countries in Asia
Nature
Frontier
Country
Name of the Currency
Symbols/ Sign
China
Chinese Yuan Renminbi
CNY
India
Indian Rupee
INR
Korea
Korean Won
KRW
₩
Taiwan
Taiwan New Dollar
TWD
NT$
Malaysia
Malaysian Ringgit
MYR
M$
Thailand
Thai Baht
THB
฿
Indonesia
Indonesian Rupiah
IDR
Rp
Philippines
Philippine Peso
PHP
Pakistan
Pakistani Rupee
PKR
₨
Sri Lanka
Sri Lankan Rupee
LKR
රු.
/>
196
¥
Mariappan Raja and Chinnadurai Kathiravan, Exchange Rate Volatility And Causality Effect Of Sri
Lanka (Lkr) With Asian Emerging Countries Currency Against Usd
Source: Morgan Stanley Capital International (MSCI) as on
30.07.2019
6.2. Data Collection
The countries currency data have been collected from different data base such as FRED
Exchange rate UK. The FRED is the Research Division of the Federal Reserve Bank of St.
Louis is to discover international historical banking and economic data. The widely used
database FRED (Federal Reserve Economic Data) is updated regularly and allows 24/7 access
to regional, national and International financial and economic data (Website:
And Exchange Rates UK is a site devoted to bringing you the latest
currency news, historical data, currency conversion and exchange rates, using mid-market rates
updated
minutely
(22:00
Sun
22:00
Fri)
through
the
Website:
/>
6.3. Period of the Study
This study was conducted for the purpose of test the long-run currencies behavior of sample
countries. So, we have collected the daily currency exchange rate data against USD for more
than 15 years i.e. from 01st January, 2002 to 31st December, 2018.
6.4. Tools Used for Analysis
For the purpose of the study, we used the following tools for analyzing the data such as
Descriptive Statistics (Summary), GARCH (1,1) Model (Volatility), Correlation
(Relationship), Granger Causality test (Linkages) Chart and Graphs.
6.4.1. Descriptive Statistics
Descriptive Statistics, the Mean, Minimum, Maximum, Standard Deviation, and Jarque-Bera
were used (Gupta. S.P., 2008). The measures of central tendency include the mean, median
and mode, while measures of variability include the standard deviation (or variance), the
minimum and maximum values of the variables and Jarque-Bera. The use of logarithms makes
graphs symmetrical and look similar to the normal distribution, making them easier to interpret
intuitively (Nick, Todd G., 2007).
6.4.2. GARCH (1,1) Model
A deficiency of ARCH (q) models is that the conditional standard deviation process has high
frequency oscillations with high volatility coming in short burst. GARCH models (p, q) permit
a wider range of behavior, in particular more persistent volatility. Tim Bollerslev (1986)
proposed a more generalized form of the ARCH (m) model appropriately termed as the GARCH
model which has two equations. Numerous parametric specifications for the time varying
conditional variance have been proposed in the literature. The following is formula to calculate
the GARCH model:
σ2t = α0 +α1u2t-1 + α2u2t-2 + … + αqu2t-q + β1σ2t-1 + β2σ2t-2 + … + βpσ2t-p
6.4.3. Correlation Analysis
According to Tripti Nashier (2015), correlation is a statistical tool which measures the degree
of relationship between two and more variables. Here, by term relationship, it is meant that the
tendency of variable to move together. In the sense, it denotes interdependency amongst
variables. The movement of variable may be in positive or negative direction. The correlation
/>
197
Kasilingam Lingaraja, C. Jothi Baskar Mohan, Murgesan Selvam
analysis is used to find out the movements of currency exchange rate between the countries
over the period of time. Correlation measures the strength of the linear association between two
variables of two different countries. The formula for correlation (r) is:
x x y y
1
r
n 1 s x s y
Computationally, the Descriptor systems uses what is sometimes referred to as the sum of
squares formula for r.
r
X
XY
X
X Y
2
2
N
N
Y2
Y
2
N
6.4.5. Pairwise Granger Causality Test
According to Brooks, C. (2002), a variable X Granger-causes Y if the past changes in X can
project current values of Y. If X Granger-causes Y, this is called unidirectional causality. If X
Granger-causes Y and Y also Granger-causes X then this is considered to be a bi-directional
causality linkages. Granger causality tests are conducted to test the significance and
bidirectional/ unidirectional causality between the foreign exchange and stock market returns.
According to Granger, C.W.J. (1969), a variable X is said to 'Granger cause' Y if past values
of X help in the prediction of Y after controlling for past values of Y, or equivalently if the
coefficients on the lagged values of X are statistically significant.
The computation of daily currency data for this study is made by using E-views (Version 7.0), MS Excel and SPSS (Version - 21.0).
7. LIMITATIONS OF THE STUDY
The present study has the following limitations.
The sample currencies consist of only ten from 9 Asian emerging countries and one
frontier (Sri Lanka).
The study is based on secondary data and the period is limited to 17 years from 2002
to 2018.
The Global Financial Crisis which occurred during September- 2008 is not removed
in this data set.
The study is confined to only foreign exchange rate of samples countries against
USD.
The study does not analyze or consider the economic and political risk factors of the
sample countries.
/>
198
Mariappan Raja and Chinnadurai Kathiravan, Exchange Rate Volatility And Causality Effect Of Sri
Lanka (Lkr) With Asian Emerging Countries Currency Against Usd
8. ANALYSIS OF LONG-RUN RELATIONSHIP, EXCHANGE RATE
VOLATILITY AND CAUSALITY EFFECT BETWEEN THE SRI
LANKA (LKR) AND ASIAN EMERGING CURRENCIES AGAINST USD
Table -2
The Results of Descriptive Statistics for the Sample Emerging Asian Countries Currency and Sri
Lanka Currency Returns against USD during the Study Period from 01st January, 2002 to 31st
December, 2018
Descriptive
Statistics
Mean
Median
Maximum
Minimum
Std. Dev.
JarqueBera
Obs.
CHY / USD
7.09
6.83
8.28
6.04
0.80
505.18
4412
INR / USD
52.42
48.44
74.33
38.48
9.27
470.28
4412
KRW / USD
1113.19
1121.40
1570.10
903.20
102.89
334.83
4412
TWD / USD
31.73
31.84
35.21
28.50
1.70
209.85
4412
MYR / USD
3.60
3.64
4.50
2.94
0.39
162.37
4412
THB / USD
34.99
33.56
44.24
28.60
4.08
464.72
4412
IDR / USD
10490.81
9481.48
15305.29
8097.35
1902.80
631.31
4412
PHP / USD
48.20
47.41
62.27
40.32
4.61
284.60
4412
PKR / USD
82.72
84.85
139.85
56.95
20.64
266.49
4412
19.68
418.44
4412
Emerging Countries in Asia
Countries
Currency
Frontier Country (Sri Lanka)
LKR / USD
119.71
113.60
182.70
93.13
Source: and Computed using E-Views (Version – 7).
The results of descriptive statistics for the Sample Emerging Asian Countries Currency and
Sri Lanka Currency Returns against USD during the Study Period from 01st January, 2002 to
31st December, 2018 are shown in Table - 2. It is clear from the above Table that during the
study period, the currency exchange rate of Malaysia (MYR) earned high mean value of 3.60,
followed by China (7.09), Taiwan (31.73) and Thailand (34.99) against USD. At the same time
Indonesia (10490.81) and Korea (1113.19) earned low mean value compare with Sri Lankan
currency (119.71) against USD during the study period. In terms of foreign exchange rate
unpredictability as measured by the standard deviation of daily returns, only two sample
currencies namely Indonesia (IDR/USD) assumed the highest risk value (1902.80), followed
by Korea (KRW/USD) with the value (102.89) during the study period. This indicates the fact
that there was high risk (in the order of currencies, namely, IDR and KRW). It is significant to
note that high degree of risk is useful for speculators but the investors may study the country
risk and carefully watch the currency value before taking investment decision. We also compute
/>
199
Kasilingam Lingaraja, C. Jothi Baskar Mohan, Murgesan Selvam
the Jarque-Bera statistics to test whether the returns are normally distributed. Besides, the
Jarque-Bera (JB) values of all ten sample currency were more than 5. Hence, it clearly implied
that all the sample were normally distributed. In other words, all the sample currencies were
less volatile except Indonesia and Korea during the study period.
Table : 3
Results of Volatility using GARCH (1, 1) Model for Sample Emerging Asian Countries Currency and
Sri Lanka Currency Returns against USD during the Study Period from 01st January, 2002 to 31st
December, 2018
Emerging Asian Countries Currency
List of Sample Countries
Currency
C
α
β
α+β
P Value
China
(CHY / USD)
0.0000000
0.01661
0.97985
0.99646
0
India
(INR / USD)
0.0000000
0.07155
0.93670
1.00825
0
Korea
(KRW / USD)
0.0000003
0.06647
0.92787
0.99434
0
Taiwan
(TWD / USD)
0.0000001
0.06522
0.93289
0.99811
0
Malaysia
(MYR / USD)
0.0000000
0.08219
0.92854
1.01073
0
Thailand
(THB / USD)
0.0000003
0.09711
0.88480
0.98190
0
Indonesia
(IDR / USD)
0.0000467
0.22908
0.28190
0.51098
0
Philippines
(PHP / USD)
0.0000098
0.19771
0.36787
0.56559
0
Pakistan
(PKR / USD)
0.0000000
0.02661
0.97049
0.99711
0
0.87432
0
Frontier Country (Sri Lanka)
Sri Lanka
(LKR / USD)
0.0000001
0.15805
0.71627
Source: and Computed using E-Views (Version – 7).
Table-3 shows the results of volatility, using GARCH (1.1) model, for daily (closing value)
currency returns of Asian emerging countries and frontier country (Sri Lanka) against USD,
during the study period from 01st January, 2002 to 31st December, 2018. As stated earlier, the
sample of nine currency exchange rate against USD from emerging countries in Asia while the
one sample from frontier country, namely, Sri Lanka (LKR/ USD). From the Table, it is clearly
observed that value of the probability (P-Value) was zero at 99% confidence level. It is worth
noting that the values (α+ β) for eight currencies were close to one. The values (α+ β) of ten
sample Countries currency exchange rate against USD were 1.01073 (for Malaysia – MYR/
USD), 1.00825 (for India – INR/ USD), 0.99811 (for Taiwan - TWD/ USD), 0.99711 (for
/>
200
Mariappan Raja and Chinnadurai Kathiravan, Exchange Rate Volatility And Causality Effect Of Sri
Lanka (Lkr) With Asian Emerging Countries Currency Against Usd
Pakistan – PKR/ USD) 0.99646 (for China- CHY/ USD), 0.99434 (for Korea – KRW/ USD),
0.98190 (for Thailand – THB/ USD), and 0.87432 (for Sri Lanka – LKR/ USD). According to
the analysis of GARCH Model, the α+ β values of ten currencies, Seven out of Nine Asian
emerging Countries Currency and one Frontier country currency were close to one. At the same
time, the two Asian emerging countries currency i.e., Indonesia (IDR/ USD) was 0.51098 and
Philippines (PHP/ USD) was 0.56559 were recorded low volatility during the study period. This
indicates the fact that the data of sample currency against USD, for eight countries currency
(China, India, Korea, Taiwan, Malaysia, Thailand, Pakistan and Sri Lanka) out of ten were
highly volatile, during the study period from 01st January 2002 to 31st December, 2018. Thus
the null hypothesis (NH01), there is no long-run exchange rate volatility among the sample
countries currency against USD during the study period from 01st January, 2002 to 31st
December, 2018, was rejected.
The overall results of GARCH (1, 1), for the returns of ten sample currencies against USD,
showed that all the parameters in the GARCH (1, 1) were highly significant at 1% significance
level. The high degree of significance of α (GARCH term) and β (GARCH term) implied that
past volatility highly influenced the current volatility of all the series under study. As both α
and β were significant, it revealed that the lagged conditional variance and lagged squared
variance had impact on current volatility. From the sum values of co-efficient of α+β of the
series, it was clearly evident that eight countries currency showed a value which was close to
unity or one. At the same time, the currencies like Philippines (PHP) and Indonesia (IDR) were
not highly volatile among the sample currencies.
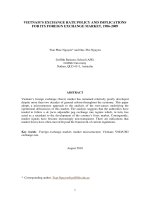
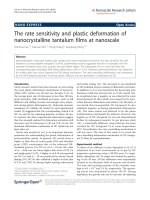
Source: Data taken from Table-3 and Computed using MS office Excel – 2007
Chart –1: Results of Volatility (α+β) for Sample Emerging Asian Countries Currency and One
Frontier (Sri Lanka) Currency against USD during the Study Period from 01st January, 2002 to 31st
December, 2018
The results of volatility (both α+β value), of all the Nine Asian emerging Countries currency
and Frontier Sri Lanka (LKR) exchange rate against USD, during the study period from 01st
January, 2002 to 31st December, 2018, are shown in Chart – 1. The Chart clearly explains the
high rate of volatility in sample emerging counties currency of Asia and Frontier countries
/>
201
Kasilingam Lingaraja, C. Jothi Baskar Mohan, Murgesan Selvam
currency. The values of both risk and return (α+ β) were close to one and the Chart represents
both high and low volatility of sample currency. It implies that the volatility among the sample
currencies, except for Philippines (PHP/ USD) and Indonesia (IDR/ USD) were Low persistent
at 1% and 5% significant levels. In other words, less volatility (risk and return) may be
transmitted among the sample currency returns. Out of ten sample currencies, Eight currencies,
namely, Malaysia – MYR/ USD, India – INR/ USD, Taiwan - TWD/ USD, Pakistan – PKR/
USD, China- CHY/ USD, Korea – KRW/ USD, Thailand – THB/ USD, Sri Lanka – LKR/USD
were highly volatile, with more than 98 percent of risk with return (α+ β), during the study
period from 01st January, 2002 to 31st December, 2018.
Table - 4
Results of Correlation between Emerging Asian Countries currency and one Frontier (Sri Lanka)
Currency against USD during the Study Period from 01st January, 2002 to 31st December, 2018
Countrie
s
Currenc
y
CHY/U
SD
CHY /
USD
1
INR /
USD
KRW /
USD
0.5968
43
0.0443
44
INR/U
SD
KRW/
USD
TWD/
USD
MYR/
USD
THB/U
SD
IDR/U
SD
PHP/U
SD
PKR/U
SD
1
0.1974
21
1
TWD /
USD
0.7612
31
0.3640
17
0.33607
3
MYR /
USD
0.3283
68
0.4561
28
0.21170 0.41360
6
9
THB /
USD
0.8484
68
0.2516
07
0.26342
IDR /
USD
0.5089
22
0.9099
82
0.58194
0.13816 0.25578
9
8
0.2145
75
1
PHP /
USD
0.7718
15
0.0983
88
0.13365 0.59095 0.68266
8
5
9
0.8108
81
0.0020
24
1
PKR /
USD
0.8493
59
0.8841
01
0.12931
0.11296
0.65229
1
8
3
0.6207
74
0.8003
21
0.4021
84
1
LKR /
USD
0.6955
49
0.9022
57
0.34023
0.00843 0.54340
6
5
0.5206
82
0.8812
88
0.2316
68
0.9329
44
1
1
0.79961 0.52651
5
2
1
Source: and Computed using SPSS (Version – 21)
/>
202
Mariappan Raja and Chinnadurai Kathiravan, Exchange Rate Volatility And Causality Effect Of Sri
Lanka (Lkr) With Asian Emerging Countries Currency Against Usd
Table – 4 exhibits the results of correlation matrix, for sample between Emerging Asian
Countries currency and one Frontier (Sri Lanka) Currency against USD during the Study Period
from 01st January, 2002 to 31st December, 2018. It is clear that the Sri Lanka (LKR) currency
was significant positive correlated with Pakistan Rupee (PKR), Indian Rupee (INR) and
Indonesian Rupiah (IDR) with the values (correlation coefficient) of 0.932944, 0.902257 and
0.881288 respectively. It is to be noted that out of nine sample currencies of Asian emerging
countries three countries currency (Chinese Yuan –CHY, Taiwan New Dollar – TWD and Thai
Baht - THB) were significant negative correlation with Sri Lanka (LKR) with the correlation
coefficient values of -0.695549, -0.543405 and -0.520682, respectively. At the same time, the
currencies like Malaysian Ringgit (MYR), Korean Won (KRW) and Philippine Peso (PHP) did
not have significant correlation with Sri Lanka (LKR) during the study period. In addition to
the above fact, there was only minor relationship (interdependence) between Asian emerging
countries currency and Sri Lanka (LKR). However, out of nine currencies only three (Malaysia,
Korea and Philippines) currencies did not reach significant correlation during the study period.
But, remaining six currencies (CHY, INR, TWD, THB, IDR and PKR) were attained significant
correlation with Sri Lanka (LKR) against USD during the study period. Hence the null
hypothesis (NH02), namely, there is no long-run significant relationship (movements)
between Asian emerging currency and Sri Lanka (LKR) against USD during the period
from 01st January, 2005 to 31st December, 2005, was rejected.
The results of Pairwise Granger Causality, for testing the Causality effect between Sri Lanka
(LKR) and nine sample currencies of Asian emerging countries against USD, during the period
from 01st January, 2002 to 31st December, 2018, are shown in Table – 5. The analysis of Asian
sample currencies with Sri Lanka (LKR) against USD, reveals that only one currency, namely,
Thai Baht -THB (Thailand) recorded no causality linkage (---) in the both way during the study
period. A pair currency, namely, Sri Lanka (LKR/USD) on Chinese Yuan (CHY/USD) earned
a value of 4.36797, Indian Rupee (INR/USD) on Sri Lanka (LKR/USD) recorded a value of
6.79359, Korean Won (KRW/USD) on Sri Lanka (LKR/USD) earned a value of 4.15625,
Taiwan New Dollar (TWD/USD) on Sri Lanka (LKR/USD) recorded a value of 4.57597,
Malaysian Ringgit (MYR) on Sri Lanka (LKR/USD) earned a value of 4.51862, Sri Lanka
(LKR/USD) on Indonesian Rupiah (IDR/USD) recorded a value of 5.29903, Philippine Peso
(PHP/USD) on Sri Lanka (LKR/USD) with a value of 4.24211 and Sri Lanka (LKR/USD) on
Pakistan Rupee (PKR/USD) earned a value of 5.49767 were registered unidirectional (→ and
←) or one way causality linkage during the study period on the basis of F- Statistics.
Table – 5
The Results of Pairwise Granger Causality of SRI LANKA (LKR/USD) with Emerging Asian
Countries Currency Exchange Rate against USD during the study period from 01st January 2002 to
31st December 2018
Null Hypothesis:
Obs
F-Statistic
Prob.
Result
LKR / USD does not Granger Cause CHY / USD
4410
4.36797
0.0127
Rejected
CHY / USD does not Granger Cause LKR / USD
4410
2.05784
0.1279
Accepted
LKR / USD does not Granger Cause INR / USD
4410
1.69649
0.1834
Accepted
INR / USD does not Granger Cause LKR / USD
4410
6.79359
0.0011
Rejected
/>
203
Kasilingam Lingaraja, C. Jothi Baskar Mohan, Murgesan Selvam
LKR / USD does not Granger Cause KRW / USD
4410
0.12073
0.8863
Accepted
KRW / USD does not Granger Cause LKR / USD
4410
4.15625
0.0157
Rejected
LKR / USD does not Granger Cause TWD / USD
4410
0.73626
0.479
Accepted
TWD / USD does not Granger Cause LKR / USD
4410
4.57597
0.0103
Rejected
LKR / USD does not Granger Cause MYR / USD
4410
1.99023
0.1368
Accepted
MYR / USD does not Granger Cause LKR / USD
4410
4.51862
0.011
Rejected
LKR / USD does not Granger Cause THB / USD
4410
0.37717
0.6858
Accepted
THB / USD does not Granger Cause LKR / USD
4410
2.89075
0.0556
Accepted
LKR / USD does not Granger Cause IDR / USD
4410
5.29903
0.005
Rejected
IDR / USD does not Granger Cause LKR / USD
4410
1.73326
0.1768
Accepted
LKR / USD does not Granger Cause PHP / USD
4410
0.11659
0.89
Accepted
PHP / USD does not Granger Cause LKR / USD
4410
4.24211
0.0144
Rejected
LKR / USD does not Granger Cause PKR / USD
4410
5.49767
0.0041
Rejected
PKR / USD does not Granger Cause LKR / USD
4410
0.51015
0.6004
Accepted
Source: and Computed using E-Views (Version – 7).
It is interesting to note that out of nine sample Currencies of Asian emerging countries, only
one currency, namely, Thailand Baht (THB) registered no causality linkages with Sri Lanka
(LKR) against USD. At the same time, the other eight currencies, namely, Chinese Yuan
Renminbi, Indian Rupee, Korean Won, Taiwan New Dollar, Malaysian Ringgit, Thai Baht,
Indonesian Rupiah, Philippine Peso and Pakistani Rupee experienced unidirectional linkages
with Sri Lanka (LKR) against USD. Hence the null hypothesis (NH03) - there is no is no longrun causality (linkage) effect between Asian emerging currency and Sri Lanka (LKR)
against USD during the study period from 01st January, 2002 to 31st December, 2018, was
partially rejected.
/>
204
Mariappan Raja and Chinnadurai Kathiravan, Exchange Rate Volatility And Causality Effect Of Sri
Lanka (Lkr) With Asian Emerging Countries Currency Against Usd
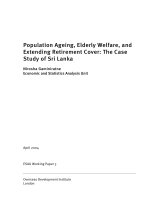
Source: The results of Table – 5
NOTE
One way – Unidirectional causality
No causality relation
Figure – 2: The Dynamic Linkages of SRI LANKA (LKR/USD) with Emerging Asian Countries
Currency Exchange Rate against USD during the study period from 01st January 2002 to 31st
December 2018
Figure - 2 displays the graphical demonstration of two forms of dynamic linkages, for
sample currencies of nine Asian emerging countries currency, with the frontier currency of Sri
Lankan Rupee (LKR), during the period from 01st January 2002 to 31st December 2018. The
above Figure, formulated with the help of Table 5 are given at the above Figure. According to
Figure – 2, out of nine emerging countries currency, seven currencies namely, Chinese Yuan
Renminbi (CHY), Indian Rupee (INR), Korean Won (KRW), Taiwan New Dollar (TWD),
Malaysian Ringgit (MYR), Indonesian Rupiah (IDR), Philippine Peso (PHP) and Pakistani
Rupee (PKR) registered significant degree of unidirectional linkages with Sri Lanka (LKR)
against USD during the study Period. At the same time, one Asian emerging country currency,
namely, Thai Baht (THB), registered no causality linkage with the Sri Lanka (LKR) against
USD during the study Period.
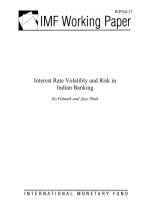
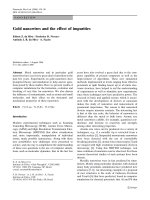
Graph 1 shows the evolution of the Nine Asian emerging countries and Sri Lankan
currency exchange rates against the U.S. Dollar since the beginning of this century i.e., from 1st
January, 2002 to till 31st December, 2018. It also shows the paths of the China (CHY/USD),
Korean (KRW/USD), Taiwan (TWD/USD), and Thailand (THB/USD) currencies were
performed better than U.S. Dollar during the study period. At the same time, the following
currencies India (INR/USD), Indonesia (IDR/USD), Malaysia (MYR/USD) Philippines
(PHP/USD), Pakistan (PKR/USD) and Sri Lanka (LKR/USD) were equally performed with
U.S Dollar till 2014, the graph depicts very large variation in all ten sample currencies over this
long data set for 17-year horizon, with broad trends emerging and disappearing, occasional
/>
205
Kasilingam Lingaraja, C. Jothi Baskar Mohan, Murgesan Selvam
sharp turns, and quite a few ups and downs. The sample currencies were trajectories do not look
qualitatively different from that of a freely floating Chinese Yuan renminbi (CHY). The overall
performance of the currency values of sample countries were good and the currencies like
Pakistan Rupee (PKR), Sri Lankan Rupee (LKR) and Indonesian Rupiah (IDR) were equally
moved from start to end of the study period. It is to be noted that the countries like Indonesia,
Malaysia, Pakistan and Sri Lanka were highly affected their currency values from the year 2015
to 2017 against USD.
Source: and Computed using E-Views (Version – 7)
Graph – 1: Graphical Expression for SRI LANKA (LKR/USD) and Emerging Asian Countries
Currency Exchange Rate against USD during the study period from 01st January 2002 to 31st
December 2018 9.0 Conclusion and Recommendations
The present paper empirically investigated the relationship between the volatilities and
causality effect between Asian emerging countries and Frontier (Sri Lanka) currency exchange
rate against USD for 17 year from 01st January 2002 to 31st December, 2018. In the sample
currency pairs namely, CNY/USD, INR/USD, KRW/USD, TWD/USD, MYR/USD,
THB/USD, IDR/USD, PHP/USD, PKR/USD and LKR/USD; it is found that the results of
GARCH Model only two sample currencies i.e., Indonesia (IDR/ USD) was 0.51098 and
Philippines (PHP/ USD) was 0.56559 were recorded low volatility during the study period. At
the same time, the remaining 8 counties currency were highly volatile and it good for
speculators to make their better investment. The results of Granger causality test show a
unidirectional relationship between the exchange rate of Asian emerging countries and LKR
against USD except Thailand Baht (THB). Hence, the Sri Lankan currency market investors
would focus their portfolio investment plan to Thailand baht. These results, apart from offering
a much better understanding of the Volatility, Causality effect in the sample countries may have
important implications for currency market efficiency to the selected sample countries. Finally,
this study results would help to international portfolio managers, multinational corporations,
and policymakers for decision-making in the Asian region.
/>
206
Mariappan Raja and Chinnadurai Kathiravan, Exchange Rate Volatility And Causality Effect Of Sri
Lanka (Lkr) With Asian Emerging Countries Currency Against Usd
REFERENCES:
[1]
[2]
[3]
[4]
[5]
[6]
[7]
[8]
[9]
[10]
[11]
[12]
[13]
[14]
[15]
[16]
[17]
[18]
Alan T. Wang (2007). Does Implied Volatility of Currency Futures Option Imply Volatility of
Exchange Rates? Physica A, 374,773–782. />Antoine W. van Agtmael (1981). The Emerging Markets Century: How a New Breed of WorldClass Companies is Overtaking the World. International Finance cooperation: World Bank,
Simon & Schuster Ltd (ISBN: 978-1847370303).
Ben Rejeb, A and Boughrara, A (2013). Financial Liberalization and Stock Markets Efficiency:
New Evidence from Emerging Economies. Emerging Markets Review, 17, 186–208.
/>Black, F and Scholes, M (1973). The Pricing of Options and Corporate Liabilities. Journal of
Political Economy, 81, 637 – 654. />Bollerslev, T (1986). Generalized Autoregressive Conditional Heteroskedasticity. Journal of
Econometrics, 31, 307-327. />Brooks, C. (2002). Introductory Econometrics for Finance. Cambridge: Cambridge University
Press (ISBN: 0-5217-9367-X).
Charoenwong, C., Jenwittayaroje, N and Sin Low, B (2009). Who knows more about Future
Currency
volatility?
The
Journal
of
Futures
Markets,
29,
270–295.
.
/>Dunis, C and Huang, X (2002). Forecasting and Trading Currency Volatility: An Application of
Recurrent Neural Regression and Model Combination. Journal of Forecasting, 21, 317 – 354.
/>Economy Watch (2010). Emerging Markets. Press release (Retrieved JUNE 29, 2010).
/>Emerging markets: A 20 –year’s perspectives – 2008 MSCI Barra.
Granger, C.W.J. (1969). Investigating Casual Relationship by Econometric Models and Cross
Spectral Models. Econometrica, 37 (3), 424-438. />Gupta, S. P. (2008). Statistical Methods. Sultan Chand & Sons, India (ISBN: 978-8-17014-8968).
Hedi Arouri, M., Jawadi, F and Khuong Nguyen, D (2010). The Dynamics of Emerging Stock
Markets: Empirical Assessments and Implications. Springer Publishing Services.
( (ISBN 978-3-7908-2389-9).
Kasilingam Lingaraja., Murugesan Selvam, & Sankaran Venkateswar (2015). An Empirical
Examination of Returns on Select Asian Stock Market Indices. Journal of Applied Finance &
Banking, 5(2), 97–101.
Kasilingam Lingaraja., Murugesan Selvam, & Vinayagamoorthi Vasanth, (2014). Co Movements
and Inter-Linkages among Emerging and Developed Stock Markets in Asia with Reference to
Singapore Stock Exchange. International Research Journal of Finance and Economics, (122),
103–120.
Kathiravan, C., Selvam, M., Kannaiah, D., Lingaraja, K and Thanikachalam, V. (2019). On The
Relationship between Weather and Agricultural Commodity Index in India: A Study with
Reference to Dhaanya of NCDEX. Quality and Quantity, 53(2), 667-683.
/>Kathiravan, C., Selvam, M., Venkateswar, S., Amirdhavasani, S and Kannaiah, D (2018). An
Empirical Investigation of the Inter-Linkages of Stock Returns and the Weather at the Indian
Stock Exchange. Academy of Strategic Management Journal, 17 (1), 1-14.
Khademalomoom, S and Narayan, P (2019). Intraday Effects of the Currency Market. Journal of
International
Financial
Markets,
Institutions
and
Money.
58,
65-77.
/>
/>
207
Kasilingam Lingaraja, C. Jothi Baskar Mohan, Murgesan Selvam
[19] Kunkler, M and MacDonald, R (2019). The Multilateral Relationship between Oil and G10
Currencies. Energy Economics, 78, 444-453. />[20] Lagoarde-Segot, T and Brian M. Lucey (2008). Efficiency in Emerging Markets-Evidence from
the MENA Region. Journal of International Financial Markets, Institutions and Money, 18, 94–
105. />[21] Lingaraja, K., Selvam, M and Vasanth, V (2014). The Stock Market Efficiency of Emerging
Markets: Evidence from Asian Region. Asian Social Science, 10 (19), 158-168.
/>[22] Lingaraja, K., Selvam, M., & Vasanth, V. (2015). Long Run Dynamic Linkages between
Emerging Stock Markets in Asia and a Developed Stock Market (DJIA). Research Journal of
Applied Sciences, 10(5), 203–211.
[23] Lingaraja, K., Selvam, M., Vasanth, V., & Gayathri, M. (2014). Co movements and inter-linkages
of Indian stock market with emerging stock market indices in Asia. International Journal of
Applied Business and Economic Research, 12(4), 1045–1064.
[24] Lingaraja, K., Justin Paul., & Selvam. M. (2019). Indian Culture, Lunar Phases and Stock Market
Returns, International Journal of Indian Culture and Business Management, 19 (4), 394-417.
/>[25] Lingaraja, K., Selvam, M., Vasanth, V., & Ramkumar, R. R. (2015). Long-Run Overseas
Portfolio Diversification Benefits and Opportunities of Asian Emerging Stock Markets and
Developed Markets. International Journal of Economics and Financial Issues, 5(2), 324–333.
[26] Liu, T., Wangcor, X and Thye Woo, W (2019). The Road to Currency Internationalization: Global
Perspectives and Chinese Experience. Emerging Markets Review, 38, 73-101.
/>[27] McCauley, R and Shu (2019). Recent Renminbi Policy and Currency Co-Movements. Journal of
International Money and Finance, 95, 444-456. />[28] Nashier, T (2015). Financial Integration between BRICS and Developed Stock Markets.
International Journal of Business and Management Invention, 4 (1), 65-71.
[29] Nick, Todd G. (2007). Descriptive Statistics. New York: Springer. (ISBN 978-1-58829-531-6).
/>[30] Shu, C., He, D and Cheng, Z (2015). One Currency, Two Markets: the Renminbi's Growing
Influence
in
Asia-Pacific.
China
Economic
Review,
33,
163–178.
/>[31] Tim Bollerslev (1986). Generalized Autoregressive Conditional Heteroskedasticity. Journal of
Econometrics, 31, 307-327. />[32] Tripti Nashier (2015). Financial Integration between BRICS and Developed Stock Markets.
International Journal of Business and Management Invention, 4 (1), 65-71.
[33] Tudor, C and Popescu – Dutaa, C (2012). On the Causal Relationship between Stock Returns and
Exchange Rates Changes for 13 Developed and Emerging Markets. Procedia – Social and
Behavioral Sciences, 57, 275 – 282. />[34] Yamani, E (2019). Diversification Role of Currency Momentum for Carry Trade: Evidence from
Financial Crises. Journal of Multinational Financial Management, 49, 1-19.
/>
/>
208