Evaluating the possible use of phytoplankton and zoobenthos for water quality assessment: A case study at Bung Binh Thien reservoir, An Giang province, Viet Nam
Bạn đang xem bản rút gọn của tài liệu. Xem và tải ngay bản đầy đủ của tài liệu tại đây (2.13 MB, 12 trang )
TẠP CHÍ KHOA HỌC TRƯỜNG ĐẠI HỌC TRÀ VINH, SỐ 36, THÁNG 12 NĂM 2019
DOI: 10.35382/18594816.1.36.2019.315
EVALUATING THE POSSIBLE USE OF PHYTOPLANKTON
AND ZOOBENTHOS FOR WATER QUALITY ASSESSMENT:
A CASE STUDY AT BUNG BINH THIEN RESERVOIR,
AN GIANG PROVINCE, VIET NAM
Nguyen Thanh Giao1
Abstract – The study aimed to evaluate
water quality at Bung Binh Thien Reservoir, in An Giang Province, Viet Nam using Shannon-Wiener species diversity index
(H’) and associated average score per taxon
(ASPT) calculated from composition of phytoplankton and zoobenthos. The water quality
index (WQI) was used as the reference for
the quality of surface water. The samples
of surface water quality, phytoplankton, and
zoobenthos were simultaneously collected at
11 sites during the dry season. The results
showed that WQI (57-88) classified water
quality from good to medium, H’ calculated
using phytoplankton species (1.12-2.71) presented water quality from medium to bad
where as, H’z calculated (0 to 2.07) and
ASPT (2-4.21) calculated from zoobenthos
species divided water quality from bad to
very bad. The findings revealed that assessing water quality should not totally rely
on diversity indices (H’, ASPT), but compositions of phytoplankton and zooplankton
should also be taken into consideration.
Keywords: An Giang Province, biodiversity index, phytoplankton, water quality,
zoobenthos.
I. INTRODUCTION
Water is essential for life and monitoring
changes in water quality due to the impacts of
socio-economic activities such as domestic,
agriculture, industry and services is an important task. The results of water monitoring
1
Department of Environmental Management, College of
Environment and Natural Resources, Can Tho University
Email:
Received date: 31st December 2019; Revised date: 9th
February 2020; Accepted date:16th March 2020
39
can be used effectively to manage and improve water quality. Thus, water monitoring
is now upheld by standards with environmental laws and policies in most countries. There
are several types of water quality monitoring
such as continuous monitoring, background
monitoring, flux monitoring, or impact monitoring. Choosing the right monitoring indicators make environmental monitoring more
accurate and allows for environmental management to be put in place effectively.
In Viet Nam, the central and local environmental management authorities have been
monitoring the surface water quality mainly
using physicochemical variables. However,
observation of the environmental quality of
water using phytoplankton and zoobenthos
have been recently recommended since it
would help to quickly diagnose environmental properties with simple, inexpensive methods with less pollutants generated compared
to chemical methods. Certain environmental
management authorities in the Vietnamese
Mekong delta have been using phytoplankton and zoobenthos for water monitoring
[1]. However, limited studies have been conducted using physicochemical, phytoplankton and zoobenthos to evaluate how these
methods could work for water quality monitoring simultaneously together. This study
was carried out in Bung Binh Thien reservoir in An Phu district, An Giang Province,
Viet Nam, to assess the water quality using
physicochemical, phytoplankton and zoobenthos testing methods. The findings of the
current study could provide important information for the selection of environmental
indicators for improved water monitoring.
TẠP CHÍ KHOA HỌC TRƯỜNG ĐẠI HỌC TRÀ VINH, SỐ 36, THÁNG 12 NĂM 2019
II.
BACKGROUND
KHOA HỌC CÔNG NGHỆ - MÔI TRƯỜNG
tigated using zoobenthos detection methods
[6], [10], [14], [15].
For monitoring surface water quality,
physicochemical parameters of the water and
biological organisms associated with water
environment such as phytoplankton, zooplankton and zoobenthos can also be used
[2]–[10]. Physicochemical variables including temperature (o C), pH, total suspended
solids (TSS, mg/L), turbidity (NTU), dissolved oxygen (DO, mg/L), biological oxygen demand (BOD, mg/L), chemical oxygen demand (COD, mg/L), ammonia (NH+
43−
N, mg/L), orthophosphate (PO4 -P, mg/L),
heavy metals and other metals (Fe, Al, Mn,
Cr, Cd), chloride (Cl− ), sulfate (SO2−
4 ), pesticides, antibiotics, or microorganisms and
bacteria such as E. coli and Coliforms
(MPN/100mL) have been often used for water monitoring [11]–[13]. The selection of a
set of physicochemical indicators for water
monitoring depends on the characteristics
of the pollution source [4]. In addition to
physicochemical parameters, phytoplankton
is also selected as an indicator for the quality
of water since its diversity and abundance
are closely related to the characteristics of
water environment such as light, temperature,
nutrients, carbon dioxide, bicarbonate, presence of phytoplankton consumers (zooplankton, fish) [4], [14]–[16]. Some phytoplankton
phyla such as Bacillariophyta, Cyanophyta
and Chlorophyta can be used to indicate
nutrient-rich and highly organic water environments [5], [15], [17], [18]. Cyanophyta
can be an indicator for static water and an
organic-rich water environment. Dinophyta
or Pyrrophyta are used to indicate brackish and saltwater environments [18]. Similarly, zoobenthos for example, Oligochaeta,
Polychaeta, Insecta, Gastropoda, Bivalvia and
Malacostraca, can be used as water quality
and sediment property indication since they
have a relatively long-life cycle with the
affected water source and the bottom of the
water body [2], [6]–[8], [10], [19]. Water
quality affected by domestic wastewater, urban wastewater, aquaculture wastewater, and
landfill operation has previously been inves-
III. MATERIALS AND METHODS
A. Site description
Bung Binh Thien is the largest freshwater
reservoir in the south of Viet Nam belonging
to three communes comprised of Nhon Hoi,
Quoc Thai and Khanh Binh of An Phu district in An Giang Province. The water surface
area of the reservoir during the dry and wet
seasons are 200 and 800 ha, respectively.
The average depth of the reservoir is 4 m,
the average length is approximately 2,900
m and the average width is 430 m [20].
Bung Binh Thien plays a key role in the
socio-economic development of this area in
An Giang Province. For example, it provides
freshwater for domestic use, cultivation and
animal husbandry, and aquaculture. However,
it is now severely affected by waste from
those local activities (domestic, agriculture,
and aquaculture) as well as uncontrolled water from upstream from Cambodia. For instance, there is waste such as fast food foam
boxes, plastic bottles and pollutants attached
to sediment. In the future, Bung Binh Thien
reservoir is planned to become a conservation
area to maintain biodiversity and to serve as
a reserve freshwater for inhabitants in the
region for their daily life and other activities.
For this reason, Bung Binh Thien reservoir
is a good selection for the current research.
B. Water sampling and analysis
Water quality characterization including
physical, chemical and biological parameters was analyzed. The physical variables
tested were temperature (o C), pH, total suspended solids (TSS, mg/L), and turbidity
(NTU). The chemical variables are dissolved oxygen (DO, mg/L), biological oxygen demand (BOD, mg/L), chemical oxygen demand (COD, mg/L), ammonia (NH+
43−
N, mg/L), orthophosphate (PO4 -P, mg/L)
and coliforms (MPN/100mL). The 10 water
samples (S1-S10) were collected inside the
reservoir and one sample (S11) was collected
40
TẠP CHÍ KHOA HỌC TRƯỜNG ĐẠI HỌC TRÀ VINH, SỐ 36, THÁNG 12 NĂM 2019
KHOA HỌC CÔNG NGHỆ - MÔI TRƯỜNG
samples were placed in a 110 mL vial and
fixed with formaldehyde 2-4%. Qualitative
analysis was performed using a microscope
with 10X-40X magnification and images of
phytoplankton were taken to determine morphological and structural characteristics and
classification according to Tien and Hanh;
Ho; Tuyen; Fernando, and Reynold [23]–
[27]. Quantitative analysis of the samples
were performed by counting individual phytoplankton according to the methods of Boyd
and Tucker [28]. The density of phytoplankton was calculated by equation (2):
in the river (Binh Di river) directly connected
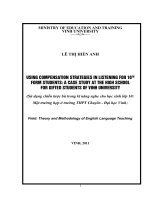
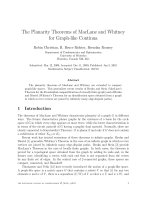
to the reservoir. The locations of sample
collection in Bung Binh Thien Reservoir are
shown in Figure 1.
The water samples were collected inside
the reservoir at the onset (S10), at the middle
(S4- S9) and at the end of the reservoir (S1S3). The water samples were also collected
at the positions close to the reservoir banks
(S3, S6, S9, S1, S4, and S7) and at the
middle of the reservoir (S2, S5, and S8).
The samples were collected during the dry
season in January 2019. Temperature and DO
were measured in the field using handheld
meters. The other parameters of water quality
analysis and quality control were performed
using standard methods [21].
The surface water quality was assessed by
WQI following Equation (1) [22]: W QI =
W QIpH 1 5
[
W QIa .W QIb .W QIc ]1/3
100 5 a=1
(1)
Where WQIa is the WQI value of five
parameters (DO, BOD5 , COD, NH+
4 -N, and
PO3−
-P);
WQI
is
the
WQI
value
of TSS;
b
4
WQIc is the WQI value of coliforms and
WQIpH is the WQI value of pH parameters
(ranging from 6 to 8.5).
The WQI value ranging from 0 to 100
divides water quality into five levels. Level
1 (100> WQI> 91) is excellent water quality
that can be used for purposes of water supply.
Level 2 (90>WQI>76), good water quality,
is also used for water supply for domestic
use but extra suitable treatment measures
are required. Level 3 (75>WQI>51), medium
water quality, is for irrigation and other similar purposes. Level 4 (50>WQI>26), bad
water quality, is the water suitable for transport and equivalent purposes while Level
5 (25>WQI>0), very bad water quality, is
considered to be heavily polluted water
and proper treatment measures are urgently
needed.
Y =
X ∗ Vc ∗ 1000
N ∗ A ∗ Vt
(2)
Where Y is phytoplankton density (individuals/liter); X is the number of individual
phytoplankton in the counted cells; Vc is
the concentrated sample volume (mL); N
is the number of counted cells; A is area
of counted cells (1 mm2 ) and Vt is water
volume collected (mL).
The diversity of phytoplankton was examined by calculating Shannon-Wiener diversity
index (H’) following Equation (3):
H =−
pi .ln(pi )
(3)
where pi =ni /N; ni is the numbers of ith
individual; N is total amount of individuals in
the samples. Water quality is divided by the
three levels of pollution based on H’ values
with H’ greater than 3 indicates good water
quality or water is not polluted, when H’ is in
the range of 1 to 3, this shows moderate water
pollution. Finally, when H’ is lower than 1,
this indicates highly polluted water [19].
D. Zoobenthos sampling and analysis
Zoobenthos samples were collected by Petersen grab [8], with an open mouth area
equal to 0.02 m2 . At each sampling point,
collecting benthic species samples were repeated five times. The collected samples
were sieved to 0.5 mm size to remove mud
and debris. After that, the sieved samples
were stored in nylon bags and fixed with 8%
formaldehyde. The collected samples were
C. Phytoplankton sampling and analysis
Each sample of phytoplankton was collected by filtering 200 L of water through
25µm mesh sized nets. The concentrated
41
TẠP CHÍ KHOA HỌC TRƯỜNG ĐẠI HỌC TRÀ VINH, SỐ 36, THÁNG 12 NĂM 2019
KHOA HỌC CÔNG NGHỆ - MÔI TRƯỜNG
Fig. 1: Locations of sample collection
(Source: Google Earth image, 2019)
[18]:
transported to the laboratory, at which they
were further processed to eliminate any organic matter and to retain only zoobenthos.
The collected zoobenthos were fixed with a
4% formaldehyde solution until qualitative
and quantitative analyses were performed.
For qualitative analysis, zoobenthos were observed by microscope and with magnifying
glasses to determine the structural morphological characteristics and classification characteristics following the taxonomy textbooks
of Quynh et al.; Thanh et al.; Hung; Hayward
and Ryland; Zamora and Co; and Carpenter
and Niem [29]–[34]. For quantitative analysis, the zoobenthos in each sample were
counted and the density was determined by
Equation (4):
D = X/S
H =−
pi .ln(pi )
(5)
The associated average score per taxon
(ASPT) was calculated based on the scored
table of BMWPV IET N AM (Biological Monitoring Working Party-VIETNAM) [35] using
Equation (6) [1]:
n
i=1
BM W P
(6)
N
Where N is total families used for
calculating tolerance scale; BMWP is
BMWPV IET N AM .
ASP T =
IV. RESULTS AND DISCUSSION
A. Physical and chemical characteristics of
water at Bung Binh Thien Reservoir
Table 1 presents the 10 physicochemical
water quality variables of the 11 sampling
points at Bung Binh Thien Reservoir during in the dry season (January 2019). The
temperature in the reservoir was in the range
of 28.07±0.06 - 30.33±1.36 o C. A former
study reported that the temperature of water
in the Hau river and field canals in An Giang
Province fluctuates in the range of 29-30o C
(4)
where D is the density calculated by individual per m2 , X is the number of counted
individuals in the collected sample; S is the
sampling area (S = n x d), n is the number of
collected Petersen grab, d is the open mouth
area of the grab.
Data on species composition and density
of zoobenthos was calculated by ShannonWeiner diversity index (H’) using Equation 5
42
TẠP CHÍ KHOA HỌC TRƯỜNG ĐẠI HỌC TRÀ VINH, SỐ 36, THÁNG 12 NĂM 2019
(average 29.7 ± 0.7o C) [9] which is in accordance with the current study. The temperature at all sampling points is within a suitable
range for aquatic organisms. The pH of the
water was recorded ranging from 7.55±0.03
to 7.85±0.01, which is slightly basic. The pH
measured in the reservoir was slightly higher
than the pH recorded in the water bodies in
An Giang Province (6.9 to 7.1) during 20092016 [9], but still in a favorable ranges for
aquatic life, and the national standard recommends pH should be in the range of 6.08.5. The pH and temperature do not greatly
fluctuate and this is a common property of
a tropical region [12], [36]. Turbidity levels
were found to be greatest in S10 (11.43±0.06
NTU) and S11 (9.03±0.09 NTU) since these
two points were in close relation to the river.
Prior study also found that turbidity was high,
ranging from 12.6 ± 7.2 to 131.8 ± 62.3
NTU in the river [13]. It was found that
DO ranged from 5.33±0.06 to 9.17±0.38
mg/L. The significantly higher DO values
(p<0.05) were observed at the points inside the reservoir while the DO values sites
close to the river (S10) and in the river
(S11) were significantly lower (p<0.05). The
higher values of DO in the reservoir could
be due to the diverse and abundant presence
of phytoplankton and water hyacinth that
release and diffuse oxygen into the water
environment. It was found that DO values in
the present study were higher compared to
those of several other water bodies (4.0 to
5.2 mg/L) belonging to An Giang Province
over the period of 2009-2016 [9].The higher
DO concentration could indicate better selfpurification capacity of the reservoir. BOD
was in the range of 9.33±0.58-11.67±0.58
mg/L, whereas COD was in the range of
14.33±0.58-17.67±0.58 mg/L. Both BOD
and COD are used as indicators of organic
waste concentration in water [37], [38]. They
were found higher at the end of the reservoir
where there are presence of human activities, such as restaurants and cafeterias. BOD
averagely accounts for 65.2 ± 1.1% of the
COD indicating that almost 35% of organic
matter present in the reservoir are recalcitrant
KHOA HỌC CÔNG NGHỆ - MÔI TRƯỜNG
substances. The value of organic matter in
the reservoir exceeded the national standard
of 2.6 and 1.6 times for BOD and COD [39],
respectively, which could potentially pose a
high threat to ecological and human health.
Fortunately, DO levels are high and this generates a good environmental condition for the
decomposition of organic matter. BOD in the
reservoir (9.33±0.58-11.67±0.58 mg/L) was
substantially higher than that in Hau river
and neighboring field canals (4.1-5.5 mg/L)
[9] indicating that the water quality in the
reservoir is more organically polluted that
the other water bodies in areas of An Giang
Province.
Ammonium concentration was not detected (detection limit of 0.03 mg/L) in S1,
S3, S4, S5, S7, S8, and S9, although it was
detected in S2 (0.2 mg/L), S6 (0.04 mg/L),
S10 (0.10 mg/L) and S11 (0.22 mg/L). Orthophosphate was also not detected (detection limit of 0.03 mg/L) at any sampling site
except S11 (0.05 mg/L). During 2009-2016,
orthophosphate concentration was detected
in the river system of An Giang Province,
which ranged from 0.03 to 0.47 mg/L [9],
and was higher than that detected in the reservoir during the dry season. Coliform density
in the study site ranged from 1900±346.41
to 9300±0.00 MPN/100mL. The coliform
density in S4, S8, S10, and S11 exceeded
the national regulation surface water quality
(allowable limit of 2500 MPN/100 mL) by
1.72 to 3.72 times [39]. A previous study
also found that coliform density in the river
networks of An Giang Province exceeded the
national regulation by 2.14-7.04 times [9].
This data revealed that the river water was
more seriously contaminated with fecal microorganisms than that of the reservoir water.
The source of the coliform contamination are
from human and animal waste and feces [1],
[40]. The overall result indicated that TSS,
organic matter, and coliforms has impaired
water quality in Bung Binh Thien Reservoir.
43
TẠP CHÍ KHOA HỌC TRƯỜNG ĐẠI HỌC TRÀ VINH, SỐ 36, THÁNG 12 NĂM 2019
KHOA HỌC CÔNG NGHỆ - MÔI TRƯỜNG
Table 1. Characteristics of surface water at Bung Binh Thien Reservoir
previous studies that reveal that the water
quality in the rivers that make up the Mekong
Delta has been polluted for a long period of
time [1], [41].
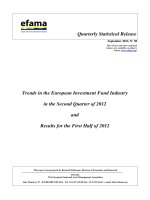
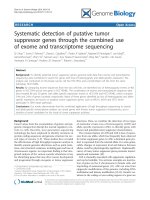
B. Water quality assessment using water
quality index
The water quality index (WQI) for sampling sites at Bung Binh Thien is presented
in Figure 2. The WQI values classifies water quality into two types: good (S1-S9)
and medium (S10-S11). According to the
National Environmental Protection Agency
[22] WQI (90>WQI>76) means good water quality and the water could be used
for domestic supply but proper treatment
is required, whereas medium water quality
(75>WQI>51) could be used only for agriculture and other equivalent uses. As previously
discussed, the water quality in the studied
area ranged from medium to good due to
the presence of relatively high concentrations
of TSS, organic matter, and coliforms. The
medium water quality was found in one site
in the river (S11) and one site receiving water
from that river (S10), since the water was
flowing from S11 to S10 during the sampling
time. This result was in accordance with
Fig. 2: Water quality indexes at different
sampling sites
C. Water quality assessment using phytoplankton
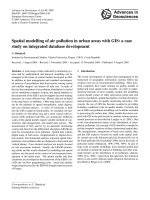
A total of 912 species of phytoplankton
belonging to five phyla including Eugleno44
TẠP CHÍ KHOA HỌC TRƯỜNG ĐẠI HỌC TRÀ VINH, SỐ 36, THÁNG 12 NĂM 2019
phyta, Cyanophyta, Bacillariophyta, Chlorophyta and Dinophyta were found at the study
site. The number of species at the sampling
locations ranged from 36 to 114, where the
lowest specie number was found at site S11.
Total density of phytoplankton ranged from
13,082 to 121,452 individuals/L, and the lowest density was found at the site S11. Total
density of each phylum was from 12,340
to 285,143 individuals/L (Figure 3a). The
percentage of Cyanophyta, Baccillariophyta,
Chlorophyta, Dinophyta, and Euglenophyta
were 44.0%, 34.1%, 16.7%, 3.6%, and 1.6%,
respectively (Figure 3b). The phytoplankton
of Cyanophyta, Baccillariophyta, and Chlorophyta were also found to dominate in the
constructed wetland areas [4] and rivers [15],
[16]. The total number of Chlorophyta, Dinophyta and Euglenophyta were relatively stable from sites S1 to S9, whereas the number of Cyanophyta and Bacillariophyta were
highly oscillated. This fluctuation was due
to the change in composition of the phytoplankton at each site probably relating to
environmental properties such as turbulence,
depth, and nutrient content. Phytoplankton at
site S11 was less abundant than the other
sites. Phytoplankton at the site S10 was also
less abundant than that of S1-S9, since S10
was more influenced by the direct connection to the river water at the sampling time.
The data of phytoplankton diversity and its
abundance corresponding with high turbidity
and dissolved oxygen in water was discussed
in the previous section.
The presence of Bacillariophyta in the
study area indicates that the water environment is nutrient-rich [18], and that these
phyla of phytoplankton are very important
for aquaculture [5]. Chlorophyta is a favorite
food for other aquatic organisms especially
fish and shrimp [17]. Cyanophyta is also
widely distributed in nutrient-rich water environments [18], and it can utilize dissolved
nitrogen from the air since it has the nitrogenase enzyme. Although, its fast growth could
lead to eutrophication and cause harm for
other aquatic species, and has been seen to
not be good for aquaculture [23]. Eugleno-
KHOA HỌC CÔNG NGHỆ - MÔI TRƯỜNG
phyta is widely distributed in static, high
organic matter and nutrient-rich water bodies,
however, it is not suitable as a food source
for other aquatic organisms since its cell
wall are hard and contains a high level of
mucus substances [17]. Dinophyta or Pyrrophyta often occur in brackish or saline water
[18]. They could release toxins which cause
harm to aquatic species, however, Dinophyta
and Bacillariophyta could be the main food
source for zooplankton and shrimp larvae
[18]. The occurrence of phytoplankton at the
sampling sites could indicate several properties relating to the water bodies being
tested, for instance, it indicates that there
is a nutrient-organic-rich water environment
which is taking part in the food chain and
food web, as well as facilitating nutrient
cycles in the water bodies. The compositional
data of phytoplankton was in accordance with
turbidity, suspended solids, organic matter,
and dissolved oxygen.
The calculated Shannon-Wiener diversity
index (H’) is presented in Figure 4. The
values of H’ ranged from 1.12 to 2.71 corresponding to the quality of the water from
medium to bad. The medium water quality
was found at the sample sites S1, S2, S4,
S5, S6, S8 and S9. Bad water quality means
the water should only be used for water transportation and equivalent purposes, which was
found at sites S3, S7, S10 and S11. The finding indicates that there is an inconsistency
between the use of H’ and WQI in reflection
of the water quality at these sites, since H’
showed worse water quality (good to bad)
compared to WQI (good to medium).
D. Water quality assessment using zoobenthos
A total of 6 classes and 17 families
of zoobenthos were detected at the studied
area. The six classes included Oligochaeta
(1 family, 3 species), Polychaeta (1 family,
1 species), Insecta (5 families, 7 species),
Gastropoda (2 families, 2 species), Bivalvia
(4 families, 9 species), and Malacostraca
(4 families, 4 species) were identified, of
45
TẠP CHÍ KHOA HỌC TRƯỜNG ĐẠI HỌC TRÀ VINH, SỐ 36, THÁNG 12 NĂM 2019
KHOA HỌC CÔNG NGHỆ - MÔI TRƯỜNG
Fig. 3: Density and composition of phytoplankton at Bung Binh Thien Reservoir
at site S6 and the highest was at site S11.
The lack of diversity in the species of the
zoobenthos in the sites from S1 to S9 (1-5
species belonging to 1-2 classes) compared
to S10-S11 (10-19 species belonging to 56 classes) could indicate a significant difference in the properties of the sediments. It
was observed at the field that the sediment
at site S10 and site S11 was hard, light in
color and contained sandy materials, whereas
the sediment at site S1 to site S9 was soft
and muddy, dark in color, and contained
organic matter. In the previous discussion, the
WQI values indicated that the water quality
of the samples collected at sites S10 and
S11 was much more polluted than that at
S1-S9, however, the number of species of
zoobenthos at S10 and S11 were considerably
higher than those at S1-S9. This could be
because zoobenthos could be an indicator
for a sediment environment as previously
reported by [7], [10]. Future research should
also collect sediment sample for analysis of
its properties which could be used to elaborate on the role of zoobenthos in indicating
environmental properties.
The density of zoobenthos ranged from
640 to 6,600 individuals/m2 . The highest
density was found at site S3. This could
be due to the effect of waste discharging
from the floating restaurant at the site. The
density fluctuation was mainly caused by the
large change of individuals of Oligochaeta
and Polychaeta at each sampling point (Fig-
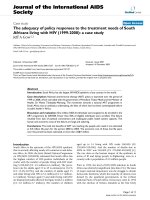
Fig. 4: Water quality using Shannon-Weiner
diversity index (H’)
which Polychaeta, Gastropoda, Bivalvia and
Malacostraca did not or very rarely present
at sites S1-S9, but appeared at sites S10S11 (except Polychaeta). The Insecta and
Oligochaeta were in frequent occurrence and
dominant classes (Figure 5a). The species
of Chaoborus astictopus, Metriocnemus Knabi coq belonging to the families Culicidae and Chironomidae, respectively, were the
most frequent occurrence of the class of Insecta. For the Oligochaeta class, Branchyura
sowerbyi, Limnodrilus hoffmeisteri, Tubifex
sp (Tubificidae family) were the dominant
species. These species of the Tubificidae
were commonly found in the canals that are
being impacted by landfill and by agriculture
[10], and indicates the presence of heavy
organic pollution sediment [3], [6], [10]. The
number of species at the study sites ranged
from 1 to 19 species in which the lowest was
46
TẠP CHÍ KHOA HỌC TRƯỜNG ĐẠI HỌC TRÀ VINH, SỐ 36, THÁNG 12 NĂM 2019
KHOA HỌC CÔNG NGHỆ - MÔI TRƯỜNG
Fig. 5: Density and composition of zoobenthos
levels, one was bad quality or water quality
for transportation (S10 and S11), with the
other level being very bad quality or heavily
polluted (S1-S9).
ure 5b). The densities of Oligochaeta and
Polychaeta at the studied sites ranged from 10
to 270 and from 600 to 6,480 individuals/m2 ,
respectively (Figure 5a). Using the ShannonWeiner diversity index (H’) it was calculated
that the zoobenthos diversity at the Bung
Binh Thien Reservoir fluctuated from 0 to
2.07 (Figure 6a).The values of H’ inside
Bung Binh Thien Reservoir (from S1 to S9)
were lower than 1, this could indicate that
the water quality was very bad or heavily
polluted [42]. The water could only be used
after appropriate treatment methods are applied. However, the values of H’ at S10 (1.88)
and S11 (2.07) revealed that water quality at
those sites were better than S1-S9. It could
also mean that the zoobenthos at site S10
and S11 were more diverse than those at sites
S1-S9. This was consistent with the data of
the composition of zoobenthos, where five to
six families of zoobenthos were discovered
at S10 and S11, whereas only two or three
families of zoobenthos were found at S1-S9.
This could be due to the difference in the
characteristics of the bottom sediments of the
study sites. Further study could adjust the
collection method by collecting the sediment
samples simultaneously for better data interpretation.
The use of biological indicators including
using phytoplankton and zoobenthos for water quality assessment showed some inconsistency. In this study, the water quality index
was used as the standard quality for comparison andusing H’ calculated from diversity of
phytoplankton (H’p) and H’ calculated from
zoobenthos (H’z), and ASPT calculated from
zoobenthos present. The comparing among
WQI, H’p, H’z and ASPT is presented in
Table 2. The use of H’p for water quality
prediction could lower water quality to level
one or two, for example, from good water quality to medium or bad water quality.
This could be due to the fact that phytoplankton diversity and composition depends
on several factors such as nutrients, organic
matter, light, bicarbonate and phytoplankton
consumers, such as fish and zooplankton.
Using the H’z and ASPT values this indicates
very bad to bad water quality whereas WQI
shows water quality from good to medium.
A previous study also indicated that the use
WQI for the assessment of the water quality
could result in lower pollution levels than
the use of H’z and ASPT calculated from
zoobenthos [10] since zoobenthos could be
affected by both the properties of sediments
and the water column [7]. However, using
The calculated values of ASPT based on
the BMWPV IET for the 11 sampling locations were illustrated in Figure 6b. The
ASPT values divided water quality into two
47
TẠP CHÍ KHOA HỌC TRƯỜNG ĐẠI HỌC TRÀ VINH, SỐ 36, THÁNG 12 NĂM 2019
KHOA HỌC CÔNG NGHỆ - MÔI TRƯỜNG
Fig. 6: Water quality assessment using H’ and ASPT
Chlorophyta and Dinophyta, of which Bacillariophyta, Cyanophyta, and Chlorophyta
were dominant. The density of phytoplankton
was found to be from 13,082 to 121,452
individuals/L. The Shannon-Weiner diversity
index (H’) of detected phytoplankton (1.12
to 2.71) indicated that the quality of water
ranged from medium to bad. For zoobenthos found, six classes including Oligochaeta,
Polychaeta, Insecta, Gastropoda, Bivalvia,
and Malacostraca were identified in which
the Insecta and Oligochaeta most frequently
occurred. The density of zoobenthos was in
the range of 640-6,600 individuals/m2 . The
values of H’ of the zoobenthos present in
the samples ranged from 0 to 2.07 while
ASPT values from 2 to 4.21. Both H’and
ASPT values described water quality as bad
to very bad quality. There was inconsistency
among the water quality indices, therefore
utilizing the results of the present study it is
recommended that future assessment of water
quality should not totally rely on biodiversity indices (H’, ASPT) but also include the
analysis of the composition of phytoplankton
and zooplankton with the participation of the
experts in the relevant fields.
H’(for both p and z) and ASPT calculated
from zoobenthos lead to the same water
quality evaluation, which was also previously
reported by Giao [10]. Therefore, the use of
H’z (for both p and z) and ASPT should be
carefully considered, for example, the values
of H’z (for both p and z) of phytoplankton
and zoobenthos were calculated based on
the diversity of the species, but not species
abundance; The obtained ASPT values were
based on scoring the family of zoobenthos,
and sometimes predicting the water quality
may not be accurate since various species in
the same family may have different capability
of pollution tolerance [43]. The results of
the present study suggest that the ShannonWiener diversity index H’z and ASPT should
not be solely used to evaluate water quality.
Instead, it should be used in combination
with physicochemical water parameters. H’z
and ASPT should be used for bottom sediment quality assessment and not for water
quality assessment.
V. CONCLUSION
Water quality at Bung Binh Thien Reservoir during the dry season in January 2019
was polluted by suspended solids, organic
matter, and coliforms. The WQI (57-88)
values classified water quality from good
to medium, and 912 species belonging to
five phyla of phytoplankton comprising of
Euglenophyta, Cyanophyta, Bacillariophyta,
REFERENCES
[1]
Ministry of Natural Resources and’ Environment.
Surface Water Quality; 2012. (In Vietnamese).
[2] Richard ST, Thorne J, Williams WP. The response of
benthic macroinvertebrates to pollution in developing
48
TẠP CHÍ KHOA HỌC TRƯỜNG ĐẠI HỌC TRÀ VINH, SỐ 36, THÁNG 12 NĂM 2019
KHOA HỌC CÔNG NGHỆ - MÔI TRƯỜNG
Table 2. Comparing assessment of water quality using phytoplankton and zoobenthos
countries: a multimetric system of bioassessment.
Freshwater Biology. 1997;37:671–686.
[3]
[4]
tial and temporal variation of water quality of a
segment of Marikina river using multivariate statistical methods. Water Science and Technology.
2017;66(6):1510–1522.
Plafkin JL, Barbour MT, PorterKD, Gross SK,
Hughes RM. Rapid Bioassessment Protocols for Use
in Streams and Rivers: Benthic Macroinvertebrates
and Fish. EPA/444/4-89-001. U.S. Environ. Prot.
Agency, Washington, D.C; 1989.
Cao L, Guisen D, Bingbin H, Qingyi M, Huimin L,
Zijian W, et al. Biodiversity and water quality variations in constructed wetland of Yongding River system. Acta EcologicaSinica. 2007;27(9):3670–3677.
[13]
Zeinalzadeh K, Rezaei E. Determining spatial and
temporal changes of surface water quality using principal component analysis. Journal of Hydrology:
Regional Studies. 2017;13:1–10.
[14]
Oanh DTH, Lien NTK. Zooplankton, natural food in
the rotational rice-tiger shrimp (Penaeus monodon)
system. Feed and Feeding Management for healthier
Aquaculture and profits. The 7th Regional Aquafeed
Forum hold at CanTho University; 2015. (In Vietnamese).
[15]
Hoang HTT, Duong TT, Nguyen KT, Le QTP,
Luu MTN, Trinh DA, et al. Impact of anthropogenic
activities on water quality and plankton communities
in the Day River (Red River Delta, Vietnam). Environmental Monitoring and Assessment. 2018;p. 190–
67. (In Vietnamese).
[5]
Lan LM. Aquatic plants. Can Tho University
Publishing House; 2000. (In Vietnamese).
[6]
Dung DT, Cong NV, Quyen LC. Using zoobenthos
indices for assessment of the polluted water in Tam
Bot canal, Long Xuyen, AnGiang province. Can Tho
University Journal of Science. 2011;20:18–27. (In
Vietnamese).
[7]
Lien NTK, Ut VN. Comparing development of
zoobenthos at upper, middle and lower parts of
Hau River. Journal of Science and Technology.
2016;18:94–102. (In Vietnamese).
[16]
Wijeyaratne WMDN Kalaotuwave KMBPP. Evaluation of the water and sediment quality of a lotic waterbody in the western coastal region of Sri Lanka using
Rapid Bioassessment Protocol II (RBP II) of benthic
macroinverterbrates. Sri Lanka Journal of Aquatic
Science. 2017;22(2):85–97.
Duong TT, Hoang HTT, Nguyen KT, Le QTP, Le ND,
Dang DK, et al. Factors structuring phytoplankton
community in a large tropical river: Case study in the
Red River (Vietnam). Limnologica. 2019;76:82–93.
(In Vietnamese).
[17]
Bac TC. Fundamental Ecology. Can Tho University
Publishing House; 1998. (In Vietnamese).
[18]
Oanh DTH, Giang HT, Lien NTK. Fluctuation
of phytoplankton community in intensive white leg
shrimp (Litopenaeusvannamei) ponds referring to
shrimp health status. Can Tho University Journal of
Science. 2014;p. 159–168. (In Vietnamese).
[19]
Wilhm J, Dorris T. Biological parameters for water
quality criteria. Biological Science. 1968;18(6):477–
481.
[8]
[9]
Ly NHT, Giao NT. Surface water quality in canals
in An Giang province, Viet Nam, from 2009 to 2016.
Journal of Vietnamese Environment. 2018;10(2):113–
119. (In Vietnamese).
[10]
Giao NT. The use of zoobenthos for the assessment
of water quality in canals influenced by landfilling
and agricultural activity. Journal of Vietnamese
Environment. 2019;11(1):21–31. (In Vietnamese).
[20]
[11]
Cho KH, Park Y, Kang J-H, Ki SJ, Cha S, Lee SW,
et al. Interpretation of seasonal water quality variation
in the Yeongsan Reservoir, Korea using multivariate
statistical analyses. Water Science and Technology.
2009;59(11):2219–2226.
Department of Natural Resources and’ Environment.
Statistics, inventory of land use and land use mapping; 2014. (In Vietnamese).
[21]
American Public Health Association. Standard methods for the examination of water and wastewater. 20th
ed. Washington DC, USA; 1998.
Chounlamany V, Tanchuling MA, Inoue T.
[22]
National Environmental Protection Agency. Guideline
[12]
Spa-
49
TẠP CHÍ KHOA HỌC TRƯỜNG ĐẠI HỌC TRÀ VINH, SỐ 36, THÁNG 12 NĂM 2019
for calculating water quality index; 2011. Decision
No. 879 /QĐ-TCMT.
[23]
[24]
[25]
[26]
[39]
Tien D D, HanhV. Freshwater algae in Vietnam Classification of green algae. Agricultural Publishing
House; 1997. (In Vietnamese).
[40]
Ho PH. Algae. Sai Gon Publishing House; 1972. (In
Vietnamese).
[41]
Tuyen NV. Biodiversity in algae in Vietnam’s inland
waters. Prospects and challenges. Agriculture Publishing House; 2003. (In Vietnamese).
[42]
Fernando CH. A guide to tropical freshwater zooplankton: identification, ecology and impact on fisheries. Backhuys Publishers, Leiden, The Netherlands;
2002.
[27]
Reynolds CS. Ecology of Phytoplankton (Ecology,
Biodiversity and Conservation). Cambridge University Press, Cambridge; 2006.
[28]
Boyd CE, Tucker CS. Water quality and pond soil
analyses for aquaculture. Alabama Agricultural Experiment Station, Auburn University, Alabama, USA;
1992.
[29]
Quynh NX, Pinder C, Tilling S. Identification of
Vietnam freshwater invertebrates. Scientific and
Technical Publisher, Hanoi, Vietnam; 2001. (In Vietnamese).
[30]
Thanh DN, Bai TT, Mien PV. Identification of
North Vietnam freshwater invertebrates. Scientific
and Technical Publisher, Hanoi, Vietnam; 1980. (In
Vietnamese).
[31]
Hung NQ. Atlas of photos: The list of economic
aquatic species is mainly in the mangrove ecosystem.
Institute of Seafood Research; 2010. (In Vietnamese).
[32]
Hayward PJ, Ryland JS. The marine fauna of the
British Isles and north-west Europe. vol. 2. Molluscs
to chordates, Oxford Clarendon Press; 1990.
[33]
Zamora PM, Co L. Guide to Philippine Flora
and Fauna, Natural Resources Management Center.
Ministry of Natural Resources; 1986.
[34]
Carpenter KE, Niem VH. The living marine resources
of the Western central Pacifi. vol. 1. Seaweeds, corals,
bivalves and gastropods, FAO, Rome; 1998.
[35]
Quynh NX, Yen MD, Pinder C, Tilling S. Biological
surveillance of freshwaters, using macroinvertebrates,
A Practical Manual and Identification Key for Use
in Vietnam Field Studies Council. UK; 2000. (In
Vietnamese).
[36]
Singh KP, Malik A, Sinha S. Water quality assessment and apportionment of pollution sources
of Gomti river (India) using multivariate statistical
techniques – a case study. Analytica Chimica Acta.
2005;538:355–374.
[37]
Galal-Gorchev H, Ozolins G, Bonnefoy X. Revision
of the WHO guidelines for drinking water quality.
Annalidell’IstitutoSuperiore di Sanità. 1993;29:335–
345.
[38]
Kazi TG, Arain MB, Jamali MK, Jalbani N,
Afridi HI, Sarfraz RA, et al. Assessment of water
quality of polluted reservoir using multivariate statistical techniques: A case study. Ecotoxicology and
Environmental Safety. 2009;72(20):301–309.
[43]
50
KHOA HỌC CÔNG NGHỆ - MÔI TRƯỜNG
Ministry of Natural Resources and’ Environment. National technical regulation on surface water quality;
2015. QCVN 08-MT: 2015/BTNMT (In Vietnamese).
Bolstad PV, Swank WT. Cumulative impacts of land
use on water quality in a southern Appalachian watershed. J Am Water Resour Assoc. 1997;33(3):519–533.
UNICEF Handbook on Water Quality. United Nations
Children’s Fund (UNICEF), New York; 2008. QCVN
08-MT: 2015/BTNMT.
People’s Committee of An Giang province. Report on
the state of environment in five years (2011 -2015) of
An Giang province; 2015. (In Vietnamese).
Dung DT, Tam DT, Be NV. Aquatic characteristics in
the biodiversity area in the Agro-forestry Area 184,
Ca Mau. Can Tho University Journal of Science.
2007;7:85–94. (In Vietnamese).