The Mediator complex subunits MED25/PFT1 and MED8 are required for transcriptional responses to changes in cell wall arabinose composition and glucose treatment in Arabidopsis thaliana
Bạn đang xem bản rút gọn của tài liệu. Xem và tải ngay bản đầy đủ của tài liệu tại đây (1.6 MB, 13 trang )
Seguela-Arnaud et al. BMC Plant Biology (2015) 15:215
DOI 10.1186/s12870-015-0592-4
RESEARCH ARTICLE
Open Access
The Mediator complex subunits MED25/PFT1
and MED8 are required for transcriptional responses
to changes in cell wall arabinose composition and
glucose treatment in Arabidopsis thaliana
Mathilde Seguela-Arnaud1,2, Caroline Smith1, Marcos Castellanos Uribe3, Sean May3, Harry Fischl1,4,
Neil McKenzie1 and Michael W. Bevan1*
Abstract
Background: Plant cell walls are dynamic structures involved in all aspects of plant growth, environmental interactions
and defense responses, and are the most abundant renewable source of carbon-containing polymers on the planet. To
balance rigidity and extensibility, the composition and integrity of cell wall components need to be tightly regulated,
for example during cell elongation.
Results: We show that mutations in the MED25/PFT1 and MED8 subunits of the Mediator transcription complex
suppressed the sugar-hypersensitive hypocotyl elongation phenotype of the hsr8-1 mutant, which has cell wall defects
due to arabinose deficiency that do not permit normal cell elongation. This suppression occurred independently of light
and jasmonic acid (JA) signaling. Gene expression analyses revealed that the expression of genes induced in hsr8-1 that
encode enzymes and proteins that are involved in cell expansion and cell wall strengthening is reduced in the pft1-2
mutant line, and the expression of genes encoding transcription factors involved in reducing hypocotyl cell elongation,
genes encoding cell wall associated enzymes and proteins is up-regulated in pft1-2. PFT1 was also required for the
expression of several glucose-induced genes, including those encoding cell wall components and enzymes, regulatory
and enzymatic components of anthocyanin biosynthesis, and flavonoid and glucosinolate biosynthetic pathways.
Conclusions: These results establish that MED25 and MED8 subunits of the Mediator transcriptional complex are
required for the transcriptional regulation of genes involved in cell elongation and cell wall composition in
response to defective cell walls and in sugar- responsive gene expression.
Background
Sugars are universal nutrients that provide carbon skeletons for energy production, storage and the synthesis of
most metabolites. In plants, the main sink of carbon is
the cell wall [1], a dynamic structure that provides both
rigidity to support the plant and plasticity to allow cell
growth. There is extensive knowledge of the enzymes involved in the synthesis and assembly of cell wall polysaccharides [2–4], but relatively little is known about how
environmental stimuli and photosynthate availability
contribute to cell wall formation during cell growth.
* Correspondence:
1
Cell and Developmental Biology Department, John Innes Centre, Colney
Lane, Norwich NR4 7UH, UK
Full list of author information is available at the end of the article
Sugars can act as both metabolic intermediates and as
signaling molecules [5], and treatment of plants with
sugars promotes growth. One mechanism linking sugar
availability and growth promotion is the stimulation of
auxin synthesis by exogenous sugars [6], which may indirectly influence cell wall formation by promoting cell
elongation. Sugar levels may also link cell wall formation
with the maintenance of turgor pressure. Mutations in a
gene encoding a cell wall-associated kinase (WAK),
which is required for normal cell expansion, also exhibited reduced vacuolar invertase activity [7]. This led to
an increased dependence of seedlings on exogenous
sugars for maintaining turgor and growth, and indicated
that WAKs may be involved in maintaining the balance
between turgor pressure, which drives cell expansion, and
© 2015 Seguela-Arnaud et al. Open Access This article is distributed under the terms of the Creative Commons Attribution
4.0 International License ( which permits unrestricted use, distribution, and
reproduction in any medium, provided you give appropriate credit to the original author(s) and the source, provide a link to
the Creative Commons license, and indicate if changes were made. The Creative Commons Public Domain Dedication waiver
( applies to the data made available in this article, unless otherwise stated.
Seguela-Arnaud et al. BMC Plant Biology (2015) 15:215
Results
Identification of a novel suppressor of hsr8-1 sugar
hypersensitive growth
The high sugar response8-1 mutant, which has reduced
cell wall arabinose [14], displays a range of sugar hypersensitivity phenotypes [9]. Among these, dark grown
hsr8-1 seedlings show reduced hypocotyl elongation in
response to glucose in comparison to wild-type plants,
and light-grown seedlings show hypersensitive sugarregulated gene expression and anthocyanin content. To
identify possible mechanisms linking altered cell wall
composition and sugar responses, we screened for suppressors of the short hypocotyl phenotype of the hsr8-1
mutant. We grew M2 seedlings of a fast neutron mutagenized hsr8-1 population in the dark in the presence of
glucose for 14 days and screened for individuals with
longer hypocotyls. Eight suppressors of hsr8-1 (soh) were
isolated, several deletions were genetically mapped, and
the soh715hsr8-1 recessive mutant was selected for further analysis. Figures 1a and b show the intermediate
B
hsr8-1
C
180
**
***
D
120
100
80
60
40
Col hsr8-1 soh715
hsr8-1
***
1.5
1
0.5
0
160
140
20
0
2
soh715
hsr8-1
Anthocyanins (E530nm) g-1. F.W.
Col
***
2.5
Hypocotyl length (cm)
A
Relative β Amylase mRNA levels
cell wall formation. A similar link between turgor and cell
walls was shown by interrupting cellulose synthesis and
observing that the resulting stress responses and distorted
cells were rescued by osmotic support and sugar availability [8]. The interaction between sugar signaling and cell
wall integrity control was also highlighted by the sugar
hypersensitivity of several cell wall matrix structural
mutants mur4, mur1 and mur3 [9]. The hsr8-1 (high sugar
response 8-1) allele of MUR4, which is defective in UDPArabinose synthesis, exhibits sugar hypersensitive gene expression and growth responses [9]. The pleitropic regulatory locus1 (prl1) mutation was identified as a suppressor
of hsr8-1 sugar hypersensitivity phenotypes. PRL1 (Pleiotropic Regulatory Locus 1) encodes a WD40 protein that is
a component of a spliceosome complex, and prl1 mutations have multiple complex phenotypes that include
sugar hypersensitivity [10]. These findings suggest that impaired cell wall composition may be actively sensed, leading to transcriptional responses that modify cell wall
composition and growth [11].
Recently, the existence of such transcriptional regulators
controlling cell wall integrity and plant growth was demonstrated [12, 13]. The stunted growth and lignin deficiency
of the lignin deficient mutant ref8 was restored by the disruption of two subunits of the transcriptional regulatory
complex Mediator, MED5a and MED5b. Here we show
that the MED25/PFT1 (MEDIATOR25/PHYTOCHROME
AND FLOWERING TIME 1) and MED8, two other subunits of the Mediator transcription complex, are able to
suppress the sugar hypersensitive short hypocotyl and gene
expression phenotypes of the hsr8-1 mutant. We show that
these Mediator subunits are required for the altered expression of a set of genes encoding cell wall components and
biosynthetic activities in the hsr8-1 mutant [9]. We show
that one of these subunits, MED25/PFT1, is also required
for the coordinated induction of several sugar-responsive
genes, including those encoding cell wall modifying enzymes. These results suggest the MED25 and MED8 subunits of the Mediator complex have an integrating role by
linking sugar responsive- and cell wall- gene expression.
Page 2 of 13
Col
hsr8-1 soh715
hsr8-1
**
8
***
7
6
5
4
3
2
1
0
Col
hsr8-1 soh715
hsr8-1
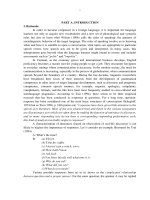
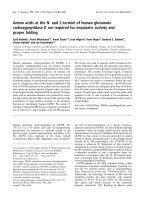
Fig. 1 Identification of a suppressor of hsr8-1 sugar-hypersensitive
hypocotyl elongation in the dark. a Image of sugar hypersensitive
hypocotyl elongation of Col, hsr8-1 and hsr8-1soh715 grown on 1 %
glucose on vertical plates in the dark. b Quantitative measurements
of hypocotyl lengths of Col, hsr8-1 and hsr8-1soh715. Seedlings were
grown vertically in the dark for 14 days on MS medium with 1 %
Glucose. Errors bars represent SD (n > 30). ***, p < 0.001 comparing
Col to hsr8-1 and hsr8-1 to soh715 hsr8-1 (Student’s t- test). Data shown
is representative of three independent experiments. c Quantitative
Real-time PCR analysis of β-Amylase mRNA levels in Col, hsr8-1 and
the hsr8-1soh715 repressor in response to glucose. Seedlings were
grown on MS medium supplemented with 0.5 % glucose in constant
light. After 7 days, seedlings were transferred 24 h in a MS glucose-free
liquid medium and then treated for 6 h with 3 % MS medium
containing 3 % glucose. Errors bars represent SD from three
biological replicates. Data shown is representative of three
independent experiments. **, p < 0.01 comparing Col to hsr8-1;
***, p < 0.001 comparing hsr8-1 to soh715 hsr8-1 (Student’s t- test).
Relative transcript levels (RTL) were calculated using transcript levels of
the reference gene TUB6 (At5g12250). d Anthocyanin accumulation
in response to glucose in Col, hsr8-1 and hsr8-1soh715. Seedlings
were grown in continuous light for 7 days on MS medium containing
1 % glucose (solid bars) or 3 % glucose (dashed bars). Errors bars
represent SD from three biological replicates. **, p < 0.01 comparing
Col to hsr8-1; ***, p < 0.001 comparing hsr8-1 to soh715 hsr8-1 (Student’s
t- test). Data shown is representative of two independent experiments
Seguela-Arnaud et al. BMC Plant Biology (2015) 15:215
Page 3 of 13
and genotyped to identify hsr8-1 homozygous plants.
Double soh715hsr8-1 mutants comprised 1/4th of the
segregating population instead of the expected 1/16th.
Preliminary genetic analysis (data not shown) showed
the soh715 locus mapped to a region of chromosome 1
where HSR8 also maps, confirming that the soh715 and
hsr8-1 mutations may be genetically linked. A transcriptbased cloning approach [15] was then used to identify
deletions in the mapped region. Gene expression in
hsr8-1 and soh175hsr8-1 seedlings was assessed using
the ATH1 Gene Chip. Comparison of gene expression
levels revealed that 6 consecutive genes on chromosome
1 showed strongly reduced RNA levels in soh715hsr8-1
compared to hsr8-1 (At1g25510, At1g25520, At1g25530,
At1g25540, At1g25550, At1g25560; Fig. 2a). This result,
hypocotyl length of the soh715hsr8-1 suppressor mutant
compared to wild- type Col and hsr8-1. The hsr8-1 sugar
hypersensitive phenotypes, increased β-amylase (BAM)
mRNA accumulation and anthocyanin content were also
suppressed in the soh715hsr8-1 mutant, with BAM
mRNA accumulation and anthocyanin content reduced
in hsr8-1 to lower levels than in wild-type plants (Fig. 1c
and d). These results show that the soh715 mutation
suppresses hsr8-1 sugar hypersensitive phenotypes.
soh715 is allelic to the pft1-2 mutation
To map the soh715 locus in the Columbia ecotype, the
double mutant was crossed with wild-type Landsberg
erecta. To isolate soh715hsr8-1 double mutant plants,
long hypocotyl plants were selected in the F2 population
Normalized intensity values
A
4
B
Complemented lines
2
0
-2
Col
-4
hsr8-1 soh715
hsr8-1
hsr8-1 hsr8-1 pft1-2
pft1-2
**
***
160
140
120
100
80
60
40
20
0
Col hsr8-1 hsr8-1
pft1-2
E
**
8
***
7
6
5
4
3
2
1
0
Col
hsr8-1 hsr8-1
pft1-2
F
800
Relative APL3 mRNA levels
Col
180
Anthocyanins (E530nm) g-1. F.W.
D
C
Relative β Amylase mRNA levels
-6
**
700
**
***
***
600
500
400
300
200
100
0
Col
hsr3
pft1-2
hsr3
hsr4
pft1-2
hsr4
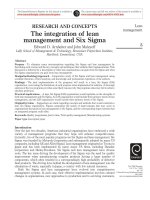
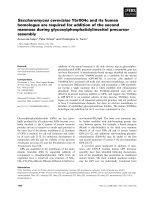
Fig. 2 hsr8-1 sugar hypersensitive phenotypes are suppressed by the pft1-2 mutation. a Identification by microarray analysis of a cluster of six
genes that are down regulated in the suppressor line soh715hsr8-1 compared to hsr8-1. Values on the Y-axis are those obtained after normalization of
the entire microarray data set. Dark grey bars and light grey bars represent values obtained for the hsr8-1 mutant and the hsr8-1soh715 suppressor line
respectively. b Sugar hypersensitive dark development of Col, hsr8-1, soh715hsr8-1 and soh715hsr8-1 complemented with each of the 6 genes of the
deletion. Seedlings were grown vertically in the dark for 14 days on MS medium containing 1 % Glucose. Only the genomic fragment containing the
At1g25540 gene rescued the dark development phenotype. c Sugar hypersensitive dark development of Col, hsr8-1, the double mutant hsr8-1pft1-2
and pft1-2. Seedlings were grown as described in (B) above. d Quantitative Real-time PCR analysis of β-Amylase mRNA levels in Col, hsr8-1 and the
double mutant hsr8-1pft1-2 in response to glucose. Seedlings were grown on MS medium supplemented with 0.5 % glucose in constant light. After
7 days, the seedlings were transferred for 24 h to MS glucose-free liquid medium and then treated for 6 h with MS medium containing 3 % glucose.
Errors bars represent SD from three biological replicates. Data shown is representative of three independent experiments. **, p < 0.01 comparing Col to
hsr8-1; ***, p < 0.001 comparing hsr8-1 to hsr8-1 pft1-2 (Student’s t- test). Relative transcript levels (RTL) were calculated using transcript levels of the
reference gene TUB6 (At5g12250). e Anthocyanin accumulation in response to glucose in Col, hsr8-1 and the double mutant hsr8-1pft1-2. Seedlings
were grown in continuous light for 7 days on MS medium containing 1 % glucose (solid bars) or 3 % glucose (dashed bars). Errors bars represent SD
from three biological replicates. Data shown is representative of two independent experiments. **, p < 0.01 comparing Col to hsr8-1; ***, p < 0.001
comparing hsr8-1 to hsr8-1 pft1-1 (Student’s t- test). f Quantitative Real-time PCR analysis of the sugar-responsive APL3 gene mRNA levels in Col, hsr3,
pft1-2hsr3, hsr4, pft1-2hsr4 and pft1-2 in response to glucose. Hsr3 and hsr4 are sugar-hypersensitive mutations in subunits of the ARP2/3 complex [18].
Seedlings were grown on MS medium supplemented with 0.5 % glucose in constant light. After 7 days, the seedlings were transferred to glucose-free
liquid MS medium for 24 h and then treated for 6 h with MS medium containing either 0 % glucose (solid bars) or 3 % glucose (dashed bars). Errors
bars represent SD from three biological replicates. **, p < 0.01 comparing Col to hsr3 and Col to hsr4; ***, p < 0.001 comparing hsr3 to hsr3 pft1-2 and
hsr4 to hsr4 pft1-2 (Student’s t- test). Relative transcript levels (RTL) were calculated using transcript levels of the reference gene TUB6 (At5g12250)
Seguela-Arnaud et al. BMC Plant Biology (2015) 15:215
Page 4 of 13
and anthocyanins in hsr8-1 in response to glucose
treatment was suppressed by the pft1-2 mutation
(Fig. 2d and e). Figure 2f shows that pft1-2 also suppresses elevated glucose- responsive APL3 expression
in the glucose hypersensitive mutants hsr3 [18] and
hsr4, which is a mis-sense mutation in the ARP3 subunit of the Arp2/3 complex(unpublished data). Therefore loss of PFT1 gene function suppressed the hsr8-1
hypocotyl cell elongation defect and sugar hypersensitive gene expression.
taken together with the preliminary genetic mapping
data, indicated that a deletion encompassing 6 genes on
chromosome 1 suppressed the hsr8-1 phenotype. To
identify the gene(s) involved, we complemented the
soh715hsr8-1 mutant background with 6 genomic fragments, each containing one gene and flanking regions in
the deleted locus. Only the genomic fragment containing
At1g25540 restored the hsr8-1 short hypocotyl phenotype (Fig. 2b). The suppression of hsr8-1 dark development phenotype in the soh715hsr8-1 mutant is therefore
caused by the deletion of At1g25540, encoding the
MED25/PFT1 protein [16, 17]. To confirm this observation a double mutant between hsr8-1 and a loss-of function T-DNA insertion allele in At1g25540 called pft1-2
was analysed. When grown in the dark in the presence
of glucose, the hsr8-1pft2-1 double mutant displayed
the same intermediate hypocotyl length as soh715hsr8-1
(Fig. 2c). Increased accumulation of BAM transcripts
B
**
1600
1400
1200
1000
800
600
400
200
0
-
40
**
pft1-2
Col
hsr8-1
*** ***
pft1-2
hsr8-1pft1-2
20
0
Col
C
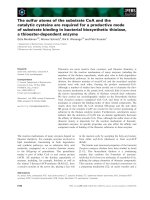
Figure 3a shows that reduced hypocotyl elongation in
hsr8-1, and its suppression by pft1-2, was due to changes
in cell length and not in cell number. The suppression of
the short hypocotyl phenotype in hsr8-1 by pft1-2 was not
due to changes in cell wall monosaccharide composition,
as the hsr8-1pft1-2 double mutant had the same reduced
Monosaacharide
composition (mol %)
Hypocotyl cell length (µm)
A
Cell wall composition is altered in pft1-2
hsr8-1
pft1-2
hsr8-1
pft1-2
Fuc
Rha
Ara
Gal
Xyl
Man
D
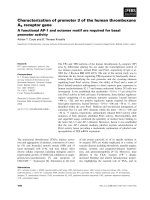
Fig. 3 Comparison of cell elongation and cell wall composition in Col, hsr8-1, pft1-2 and hsr8-1pft1-2. a Hypocotyl cell length was measured
from scanning electron micrograph images. n = 10 cells each from 5 hypocotyls. **, p < 0.01 comparing hsr8-1 to Col, and hsr8-1 to pft1-2 and
hsr8-1 pft1-2 (Student’s t- test). b Monosaccharide composition of cell wall material isolated from 14 day old light grown seedlings (5 biological
replicates). Fuc fucose; Rha rhamnose; Ara arabinose; Xyl xylose; Man mannose. . ***, p < 0.001 comparing arabinose levels in Col to hsr8-1, and
pft1-2 to hsr8-1 pft1-2 (Student’s t- test). c Compositional analysis of cell wall material isolated from dark grown hypocotyl tissues using FTIR. The
data are represented as differences in relative absorbance from wild-type Col. d Principal Components Analyses of FTIR data. Score loadings of
PC1, PC2 and PC3 are plotted against the range of wavelengths to show the major variance
Seguela-Arnaud et al. BMC Plant Biology (2015) 15:215
levels of arabinose as hsr8-1 (Fig. 3b). Additional analyses
of cell wall composition of hypocotyls of dark-grown Col,
hsr8-1, hsr8-1pft1-2 and pft1-2 mutants seedlings were
conducted using Fourier Transform InfraRed spectroscopy
(FTIR) [19]. Figure 3c shows difference spectra relative to
wild-type Col, and Principle Components Analysis (PCA)
identified three principle components when mapped as
score loadings (Fig. 3d). PC1 explained ~80 % of the variation in cell wall composition between genotypes, showing
very broad variation across the spectra with positive loadings between 800 and 1200 cm-1 and depletion at 12001800 cm-1 relative to Columbia. Although PC2 and PC3
explained less variation (~15 and 4 % respectively), these
principle components identified variation in more specific
spectra between genotypes. In PC2, the positive loading
between 1120 and 1097 cm-1 may reflect variation in
xyloglucan and pectin respectively between genotypes
[19]. PC3 identifies positive loadings between 1660 and
1776 cm-1, possibly reflecting differences in waxes and
phenolic composition [19]. Additional file 1: Figure S1 are
scatter plots comparing PC1, PC2 and PC2 between the
mutants. There were significant differences between each
of the genotypes for each of the three PCs.
Page 5 of 13
Col
hsr8-1
A
pft1-2 phyA-201 phyB-1
hsr8-1 hsr8-1
hsr8-1
B
C
Suppression of hsr8-1 by pft1-2 is not dependent on the
phyA, phyB or jasmonate pathways
MED25/PFT1 was first identified as a positive regulator
of flowering in response to sub-optimal light conditions,
and pft1 mutants display slightly longer hypocotyls in far
red light and a late flowering phenotype in long days
[16]. As mutants with longer hypocotyls were identified
in our screen, and because phyA has been implicated in
sugar responses [20], we assessed the role of phytochrome signalling pathways in the suppression of hsr8-1
sugar hypersensitivity. Neither the phyA-201 [21] nor
the phyB-1 [22] mutations suppressed the hsr8-1 dark
development phenotype (Fig. 4a). Seedlings were also
grown under constant white light (Fig. 4b) and constant
far-red light (Fig. 4c) to confirm that the phyA-201hsr8-1
and phyB-1hsr8-1 double mutants displayed characteristic phyA and phyB phenotypes, unlike the pft1-2hsr8-1
double mutant.
PFT1 is a regulator of the jasmonate (JA) signalling pathway [23]. As cell wall defects can trigger defence responses
through the jasmonate signalling pathway [24, 25], we
tested whether JA-dependent defence responses were activated in hsr8-1 and if pft1-2 suppressed hsr8-1 sugar hypersensitivity through the JA signalling pathway. Expression of
VSP1, VSP2 and ERF1, which are strongly up regulated by
JA, was not up- regulated in hsr8-1 compared to Col in
dark-grown seedlings (Additional file 1: Figure S2). This
showed that the JA pathway was not induced in hsr8-1
in response to its cell wall defect. Crosses to the JA- insensitive mutant coi1-16 [26] confirmed this; the coi1-
D
Col
hsr8-1
coi1-16
hsr8-1
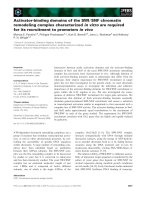
Fig. 4 PFT1 acts independently of phyA and phyB and the jasmonate
response pathway in the suppression of the hsr8-1 hypocotyl elongation
phenotype. a Sugar-hypersensitive dark development of Col, hsr8-1,
hsr8-1pft1-2, phyA-201hsr8-1, phyB-1hsr8-1 mutants. Seedlings were
grown vertically in the dark for 14 days on MS medium containing
1 % glucose. b Hypocotyl phenotypes of Col, hsr8-1, hsr8-1pft1-2,
phyA-201hsr8-1, phyB-1hsr8-1 mutants grown in white light. Seedlings
were grown 7 days on MS sugar free medium under constant white
light. c Hypocotyl phenotypes in far-red light of Col, hsr8-1, hsr8-1pft1-2,
phyA-201hsr8-1, phyB-1hsr8-1 mutants. Seedlings were grown 4 days on
MS sugar free medium under constant far-red light. d Sugar
hypersensitive hypocotyl elongation of Col, hsr8-1, coi1-16hsr8-1
mutants. Seedlings were grown as in (a)
16hsr8-1 double mutant had the same short hypocotyl
phenotype as hsr8-1 (Fig. 4d). Therefore suppression of
the hsr8-1 short hypocotyl phenotype by pft1-2 is
Seguela-Arnaud et al. BMC Plant Biology (2015) 15:215
independent of its role in the JA and phytochrome signalling pathways.
Microarray analysis of pft1-2-dependent gene expression
PFT1 encodes subunit 25 of the Mediator complex, a conserved regulator of transcription in eukaryotes [17, 27].
We therefore assessed the extent to which PFT1 controls
gene expression in response to glucose in light grown
seedlings, and also how it controls gene expression during
dark development in Col and hsr8-1 genetic backgrounds.
For glucose-responsive gene expression, three independent replicates of pft1-2 and wild-type light-grown 7 day
old seedlings were collected 6 h after 3 % glucose or 0 %
glucose treatment. Two-way ANOVA (Analysis of
Variance) (Additional file 2) revealed that 1438 genes were
differentially expressed in response to 3 % glucose in Col
and 1346 genes in pft1-2 (Fig. 5a), of which 931 genes
were differentially expressed in response to glucose in
both genotypes. A total of 92 genes had fold changes between -2 and +2, and 47 genes were induced >2 fold by
glucose in wild-type Col. Nineteen of these showed no
significant glucose- dependent induction in pft1-2 and
28 showed strongly reduced glucose- dependent induction in pft1-2 (Fig. 5b and c). The expression of five general categories of genes were either completely or
partially dependent on PFT1 for increased expression in
response to glucose. Expression of six genes involved in
the regulation, biosynthesis and transport of anthocyanins required PFT1, including the central regulator
MYB75/PAP1 [28]. Five genes encoding uptake transporters of nitrate, phosphate and sulphate, and the
phosphate uptake regulator SPX3, also required
PFT1 for increased expression in response to glucose
[29, 30]. Seven genes encoding enzymes (primarily
cytochrome P540s) in the biosynthesis of glucosinolates required PFT1 for their expression in response
to glucose. Of the four MYB transcription factor
genes involved in regulating glucosinolate (GSL) biosynthesis [31, 32], MYB28/HAG1 required PFT1 for
increased expression. Thirteen genes encoding a
wide variety of stress responsive genes required
PFT1 for expression in response to glucose. These
include two COR (COld Regulated)-related genes,
NCED3 involved in ABA biosynthesis, the AFP1 gene
encoding an ABI5 binding protein, the heat-shock
transcription factor HSFA2, a PIRIN gene involved in
ABA signaling, bZIP44 involved in regulating proline
dehydrogenase, and ECA2 encoding an ER Ca2+
transporter involved in stress responses. Finally, several genes encoding proteins involved in cell expansion required PFT1 for their glucose-responsive
expression, including two Lipid Transfer Proteins
(LTPs) involved in membrane modifications, and
Page 6 of 13
Expansin 4, which is involved in cell wall extension
[33, 34].
To confirm and extend these microarray analyses, we
measured the influence of PFT1 on the expression of a
small set of well- characterised glucose-responsive genes
identified previously in microarray experiments [35]. QRTPCR analysis showed that the glucose-induced genes
APL3, BAM, GBSS1, GPT2 and PDC1 all had reduced expression in pft1-2 (Additional file 1: Figure S3A-S3E), and
confirmed the microarray data showing reduced expression of APL3 and BAM. The expression of genes encoding
enzymes in the anthocyanin synthesis pathway (FLS, CHS
and TT6) was also assessed by Q-RTPCR, and they all
showed reduced expression in pft1-2 (Additional file 1:
Figure S3F-3H). Finally, anthocyanin levels were reduced
to 45 % of wild-type levels in pft1-2 (Additional file 1:
Figure S2I), confirming the important role of PFT1 in
the expression of regulators and enzymes of anthocyanin synthesis.
Gene expression in 14-day old dark-grown seedlings of
Col, hsr8-1, hsr8-1pft1-2 and pft1-2 was measured in
three independent RNA samples using microarray analysis. Two-way ANOVA analysis (Additional file 3) identified 76 genes that were ≥2 fold up- or down- regulated
in hsr8-1 compared to Col, and 44 genes were differently
regulated between hsr8-1 and hsr8-1pft1-2. There were
29 genes in common that were differentially regulated
in hsr8-1 vs Col and hsr8-1 vs hsr8-1pft1-2. These
genes were clustered according to their expression patterns (Fig. 5d and e). Of the 15 genes that were significantly down- regulated in hsr8-1 compared to Col and
up- regulated in pft1-2hsr8-1 compared to hsr8-1 (that
is, requiring PFT1 for repressing their expression in
hsr8-1), 10 encode proteins involved in cell wall formation, cuticle formation and cell expansion. These
include XTH17 and XTH20, encoding xyloglucan endotransglycosidase/hydrolase enzymes that cleave and rearrange xyloglucans [36]), and IRX9 encodes a xylosyl
transferase involved in xylan synthesis [37]. EXPB5 and
EXP5 encode the cell wall proteins expansin B3 and
expansin 5 that promote cell wall expansion, CER1 encodes an enzyme of cutin formation, FLA11 encodes a
fascilin-type arabinogalactan protein involved in cell adhesion, RTM encodes a mannose-binding lectin, and JAL22
encodes an ER-Golgi transporter that may be involved in
the transport of cell wall components to the plasma membrane. The expression of three genes encoding peptidases
involved in programmed cell death in xylem, XCP1, XCP2
and the metacaspase-encoding gene MC9 was reduced in
hsr8-1 and increased in hsr8-1pft1-2. Similarly the expression of two stress-induced genes, HVA22 and GSTU6 encoding glutathione-S-transferase, was reduced in hsr8-1
compared to Col, and increased in hsr8-1pft1-2 compared
to hsr8-1.
Seguela-Arnaud et al. BMC Plant Biology (2015) 15:215
Page 7 of 13
Fig. 5 Microarray analyses of gene expression in Col, hsr8-1, pft1-2 and hsr8-1pft1-2 seedlings. a Venn diagram of glucose- induced genes in Col
and pft1-2. b Hierarchical clustering of 19 genes showing no induction in response to glucose in pft1-2 compared to Col. c Hierarchical clustering of 28
genes showing reduced induction in response to glucose in pft1-2 compared to Col. d Hierarchical clustering of 15 genes that were down- regulated in
hsr8-1 compared to Col, and up- regulated in hsr8-1pft1-2 compared to hsr8-1 in dark grown seedlings. These genes require PFT1 for repression in response
to hsr8-1. e Hierarchical clustering of 14 genes that were up- regulated in hsr8-1 compared to Col, and down- regulated in hsr8-1pft1-2 compared to hsr8-1
in dark grown seedlings. These genes require PFT1 for induction in response to hsr8-1
Seguela-Arnaud et al. BMC Plant Biology (2015) 15:215
MED8 is also required for the expression of selected
genes encoding cell wall components but is a repressor
of glucose-induced gene expression
The Mediator complex in Arabidopsis is composed of at
least 27 subunits [17], therefore we examined other subunits in addition to PFT1/MED25 for a potential role in
sugar- and cell elongation- mediated gene expression.
med8 mutants exhibited similar phenotypes to pft1-2
with respect to pathogen responses, flowering time and
organ size [39, 40]. Furthermore, the yeast homolog of
MED8 was shown to be involved in sugar signalling [41].
To test the involvement of MED8, hsr8-1 was crossed
with a loss of function T-DNA insertion med8 mutant,
and hypocotyl length in dark developed seedlings was
analysed. As shown in Fig. 6a, med8 suppresses the hsr81 short hypocotyl phenotype to the same extend as pft12 (compare with Fi. 1a). We therefore measured expression of the same set of four PFT1-responsive cell wallrelated genes shown in Additional file 1: Figure S4 in
hsr8-1 and med8hsr8-1 in dark grown seedlings.
Figure 6b and c shows that expression of two of these
four, PME17 and PME41, was substantially reduced in
med8hsr8-1 compared to hsr8-1. Analysis of glucose- induced gene expression in light- grown med8 seedlings
showed an opposite effect to that observed in the pft1-2
Col
hsr8-1 med8 med8
hsr8-1
D
C
140
700
600
500
400
**
**
80
60
40
20
0
200
100
0
Col hsr8-1 med8 med8
hsr8-1
**
140
120
100
Col hsr8 med8 med8
hsr8-1
E
300
250
200
150
100
50
0
Col med8 pft1-2 med8
pft1-2
40
20
0
**
Relative CHS mRNA levels
350
60
1800
450
**
**
80
Col med8 pft1-2med8
pft1-2
F
400
**
300
160
120
100
**
800
180
160
Relative BAM mRNA levels
Relative PME41 mRNA levels
Relative PME17 mRNA levels
B
A
Relative APL3 mRNA levels
The expression of a diverse set of 14 genes was increased in hsr8-1 compared to Col and decreased in
hsr8-1pft1-2 compared to hsr8-1 (Fig. 5e). These genes
required PFT1 for their increased expression in hsr8-1.
Three members of the light-dependent short hypocotyl
(LHS1, 4 and 10) gene family, encoding conserved nuclear proteins of the ALOG (Arabidopsis LSH1 and
Oryza G1) family of transcription factors [38], and five
genes encoding enzymes of methionine- and aliphatic
glucosinolate biosynthesis [31] required PFT1 for increased expression in hsr8-1. Three genes encoding the
cell wall hydroxyproline rich glycoprotein Extensin 3,
laccase involved in lignin biosynthesis, and β-glucosidase
33 also required PFT1 for increased expression in hsr8-1
compared to Col. Finally HKT1, encoding a protein involved in sodium retrieval from xylem, was expressed in
a similar pattern.
To extend these analyses, q-RTPCR analyses of genes
encoding cell wall components and enzymes with increased expression in hsr8-1 compared to Col [9] was carried out in the double mutant pft1-2hsr8-1. These analyses
showed that increased expression in hsr8-1 of EXT3,
EXT4, encoding cell wall glycoproteins, and PME17 and
PME41, encoding pectin methylesterases, was reduced in
hsr8-1pft2-1 (Additional file 1: Figure S4), confirming the
increased expression of EXT3 seen in microarray data and
extending the range of cell wall-related genes requiring
PFT1 in hsr8-1.
Page 8 of 13
1600
1400
1200
1000
800
**
600
400
200
0
Col med8 pft1-2 med8
pft1-2
Fig. 6 The MED8 subunit plays a role in sugar responsive growth
and gene expression. a Sugar hypersensitive dark development of
Col, hsr8-1, med8hsr8-1 and med8 mutants. Seedlings were grown
vertically in the dark for 14 days on MS medium containing 1 %
Glucose. b and c Quantitative Real-time PCR analysis of mRNA levels of
cell wall modifying encoding genes PME17 and AtPME41 in Col, hsr8-1,
med8hsr8-1 and med8. Seedlings are grown as described in (a) above.
Errors bars represent SD from three biological replicates. **, p < 0.01
comparing Col to hsr8-1, and med8 hsr8-1 to med8 (Student’s t- test).
Relative transcript levels (RTL) were calculated relative to the
transcript level of the reference gene TUB6 (At5g12250). d to f
Quantitative Real-time PCR analysis of BAM, APL3, and CHS mRNA
levels in Col, med8, pft1-2 and the double mutant med8pft1-2 in
response to glucose. Seedlings were grown on MS medium
supplemented with 0.5 % glucose in constant light. After 7 days,
the seedlings were transferred to glucose-free liquid MS medium
for 24 h and then treated for 6 h with 3 % Glucose. Errors bars
represent SD from three biological replicates. **, p < 0.01 comparing
Col to med8 and pft1-2 to med8 pft1-2 (D); **, p < 0.01 comparing pft1-2
to med8 pft1-2 (E); **, p < 0.01 comparing Col to med8 and pft1-2 to
med8 pft1-2 (F) (Student’s t- test). Relative transcript levels (RTL)
were calculated using transcript levels of the reference gene
TUB6 (At5g12250)
Seguela-Arnaud et al. BMC Plant Biology (2015) 15:215
mutant: the med8 mutant significantly enhances expression of three genes with well-characterised responses to
glucose, BAM, APL3 and CHS (Fig. 6d, e and f ). This increase was consistently less in the double mutant
med8pft1-2 in the analysed genes, suggesting that MED8
and PFT1 have opposing effects on glucose-induced
gene expression.
Discussion
A genetic screen for mutants that suppressed the short
hypocotyl phenotype of dark-grown hsr8-1 seedlings
identified eight soh mutants. One mutant, soh715hsr8-1,
had an intermediate hypocotyl length when grown in the
dark (Fig. 1a and b) and also suppressed hypersensitive
responses to glucose as assessed by gene expression and
anthocyanin accumulation (Fig. 1c and d). The elongated
cotyledonary petioles seen in hsr8-1 [9] were also partly
suppressed by the soh715 locus (Figs. 1a and 2b), but the
main phenotype studied was the large difference in
hypocotyl elongation, which was shown to be due to increased cell elongation (Fig. 3a). soh715 was identified as
PFT1 (Fig. 2b) [16], encoding a subunit of the Mediator
transcription complex [27] and confirmed by the double
mutant hsr8-1pft1-2 (Fig. 2c), which was used in subsequent analyses. pft1 mutants exhibit longer hypocotyls
in response to phytochrome-mediated signals [16, 42],
increasing signalling downstream of PhyA and genetically interact with HY5 [43]. Figure 4 shows that the
dark-development phenotypes of hsr8-1 were not
dependent on phyA or PhyB, and hsr8-1 did not significantly influence white- and far- red light responses. Furthermore, the dark development phenotypes of hsr8-1
were not dependent on jasmonate responses [23]. We
concluded that PFT1-mediated suppression of reduced
hypocotyl elongation in hsr8-1 was not dependent on
PFT1 functioning as part of phytochrome- and JA- mediated responses, suggesting PFT1 functions through a independent mechanism(s) to reduce hypocotyl cell elongation
during dark development of arabinose-deficient mutants.
The Mediator complex is a functionally conserved
regulator of gene expression composed of approximately
30 subunits, forming a complex that docks transcription
factors bound to enhancers with core promoter components such as RNA polymerase II [17, 27, 44]. Mediator
also has a structural role in chromatin by forming a
complex with cohesin that is associated with chromatin
looping of promoters [45]. PFT1/MED25 forms part of
the tail region of the complex that interacts with transcription factors, while MED8 is part of the head region
interacting with core promoter components [27]. In
metazoans, many diverse transcriptional regulatory networks converge on Mediator [27], with increasing evidence that different transcription factors interact with
different subunits of the tail region. In plants, PFT1/
Page 9 of 13
MED25 and MED8 are required for expression of JAresponsive and fungal resistance genes [23, 46] and have
antagonistic effects on organ size [40, 47]. PFT1/MED25
is also required for drought-responsive gene expression
[42] and is also directly involved in light responses and
promoting flowering [16, 43, 48]. The Mediator subunits
MED5a/5b repress expression of a set of phenylpropanoid and lignin biosynthetic genes [12, 13], and it was
suggested that MED5a/5b may play a direct role in relieving growth repression caused by the phenylpropanoid
mutant ref8-1 through a cell wall sensing pathway.
Cluster analyses were conducted to identify two sets of
genes in dark grown seedlings that were differentially
regulated in hsr8-1 compared to Col and in pft1hsr8-1
compared to hr8-1. These sets comprise genes that required PFT1 for increased or decreased expression in
hsr8-1 dark grown seedlings. Of the 15 genes with reduced expression in hsr8-1 compared to Col, and increased expression in hsr8-1pft1-2 compared to hsr8-1,
ten encoded proteins involved in cell wall formation
(Fig. 6a). Their expression profile shows that the expression of these genes is actively reduced in arabinose- deficient cell walls by PFT1, where they may limit cell wall
expansion and/or compensate for altered cell wall composition. Among these are genes for xyloglucan chain
modification (XTH17 and XTH20) [36, 49], and XTH17
which has xyloglucan endotransferase- hydrolase activity
[50] involved in wall strengthening and expansion in response to shade cues [51, 52]. Expression of genes encoding expansins 5 and B3 was also repressed by PFT1
in hsr8-1. These cell wall proteins promote cell wall extensibility, possibly by loosening xyloglucan-cellulose interactions [53].
Fourteen genes encoding regulatory proteins, biosynthetic enzymes and the cell wall protein Extensin 3 had
significantly elevated expression in hsr8-1 compared to
Col, and reduced expression in hsr8-1pft1-2 compared
to hsr8-1 (Fig. 5d). The expression of three genes encoding LSH1, 4 and 10, members of the ALOG family of
transcriptional regulators, was coordinately increased in
hsr8-1 in a PFT1-dependent pattern. Over-expression of
LHS1 led to reduced hypocotyl cell elongation [38], suggesting that PFT1-mediated expression of LSH family
members may directly reduce hypocotyl cell elongation
in hsr8-1. The increased expression of Extensin 3 and
Extensin 4 in hsr8-1 (Additional file 1: Figure S3) was
dependent on PFT1, suggesting that the deficient cell
walls in hsr8-1 mutants may be strengthened by extensins, and that the reduced expression of Extensin 3 and
Extensin 4 in hsr8-1pft1-2 may contribute to increased
cell wall extensibility associated with cell elongation.
In Col plants with normal cell walls, PFT1 was required for the increased expression of seven genes encoding proteins that are involved in cell wall extension
Seguela-Arnaud et al. BMC Plant Biology (2015) 15:215
and cell elongation in response to high glucose levels:
Expansin 4 encodes a protein that loosens the wall by
disrupting hydrogen bonds between cellulose and xyloglucan hemicelluloses [34] and LTP3 and LTP4 encode
proteins implicated in cell membrane deposition and cell
wall loosening [33]. PIF4 and PIF5 activate LTP3 and
Expansin B1 gene expression and promote cell elongation [54], and PhyB negatively regulates this in the light.
This is consistent with the known role of PFT1 in PhyB
responses [16, 43] and suggests PIF4 and PIF5 may function in concert with PFT1 to promote cell elongation in
response to light and glucose cues by activating LTP and
Expansin gene expression.
Glucose levels strongly influence plant growth, and a
key feature of glucose-mediated transcriptional responses involves the rapid coordinated expression of
genes encoding enzymes and transporters involved in
nutrient acquisition and the synthesis of secondary products and the co-expression of genes involved in ABA responses [35, 55]. Microarray analyses identified diverse
classes of genes whose glucose-induced expression was
fully or partly dependent on PFT1/MED25. These genes
encoded cell wall- and cell expansion- related proteins,
regulatory proteins and enzymes of anthocyanin, flavonoid and glucosinolate biosynthesis, regulators and transporters involved in nutrient uptake, ABA signaling and
biosynthetic proteins, and a variety of stress-responsive
proteins (Fig. 5b and c). Seven genes encoding enzymes
and regulatory proteins in the biosynthesis of glucosinolates [32] required PFT1 for increased expression in response to glucose. In the hsr8-1 mutant PFT1 was also
required for the expression of five genes encoding enzymes of glucosinolate synthesis, with MAM1 commonly
regulated by glucose. The function of glucosinolate production in hsr8-1 is not known, but the independence of
PFT1-mediated hsr8-1 phenotypes on JA indicates that
stress responses may not be involved [23]. Notably,
glucose-induced expression of MYB75, encoding a key
anthocyanin pathway regulator [28] was completely
dependent on PFT1. Recently MED5a and 5b have been
shown to repress phenylpropanoid pathway gene expression [12, 13], establishing the central role of Mediator in
integrating biosynthetic capacity in response to increased carbon supplies. Finally the PFT1- dependent
expression of genes encoding nitrate, phosphate and
sulphate transporters [56], and the phosphate uptake
regulator SPX3, further demonstrate an important coordinating role for PFT1/MED25 in balancing nutrient
supplies and carbon availability.
Reduced PFT1 function did not reconstitute wild-type
cell wall arabinose content in hsr8-1, as shown by cell
wall monosaccharide analyses (Fig. 3b), probably because hsr8-1 is a loss of function allele of MUR4, which
encodes the only known enzyme of UDP-arabinose
Page 10 of 13
synthesis in Arabidopsis [14]. Only large reductions in
cell wall arabinose and fucose led to reduced hypocotyl
elongation in the dark [9], which was rescued by low
concentrations of borate. Borate cross-links rhamnogalacturonan II and is thought strengthen the cell wall,
suggesting changes in cell wall composition and structure lead to reduced elongation in hsr8-1 [9]. Analyses
of cell wall polysaccharides using FTIR spectra of cell
wall material from dark-developing hypocotyls showed
complex quantitative changes in absorbance spectra in
hsr8-1 compared to wild-type Col, and in hsr8-1pft1-2
compared to pft1-2 and Col (Fig. 3c and d). Although
there were significant differences between genotypes
the major component of these differences showed variation across a broad range of wavelengths that precluded identification of specific polysaccharides with
altered levels.
Conclusions
Our analyses demonstrate a central role MED25 and
MED8 subunits of the Arabidopsis Mediator complex in
transcriptional responses involved in cell elongation, multiple biosynthetic pathways, stress responses, and nutrient
acquisition in response to altered carbon availability.
Methods
Plant material and growth conditions
All experiments were carried out in the Columbia genetic
background. The hsr8-1, hsr3 and hsr4 mutants were isolated as previously described (Li et al. [9]; Baier et al. [57]).
The suppressor mutants were isolated from an hsr8-1 fast
neutron mutagenized population (seeds were irradiated
with 30-40 grays at the HAS KFKI-Atomic Energy Research Institute, Hungary). Plants containing T-DNA insertions in PFT1 (SALK_129555), termed pft1-2, and
MED8 (SALK_592406), termed med8, were obtained from
The European Arabidopsis Stock Centre (NASC,
University of Nottingham, United Kingdom). Seeds
were surface sterilized and sown on Murashige and
Skoog (MS) medium containing 0.9 % agar and different glucose concentrations. Seeds were then stratified for 3 days at 4 °C and then grown in
continuous light at 22 °C. For dark development experiments, seeds were grown on MS medium containing 1 % glucose, exposed to light for 8 h and then
grown vertically in complete darkness for 2 weeks. For
glucose treatment experiments, seedlings were grown on
MS medium containing 0.5 % glucose for 7 days and
transferred in MS liquid medium without glucose. After
24 h, the medium was changed to MS medium containing
3 % glucose and seedlings were collected 6 h later. For
anthocyanin measurements, seedlings were grown on
solid MS medium containing 1 or 3 % glucose for 7 days.
Seguela-Arnaud et al. BMC Plant Biology (2015) 15:215
Genetic screen and cloning of the soh715 mutation
3200 M2 mutagenized lines were screened individually
for increased hypocotyl length, in comparison to hsr8-1,
when grown in the dark with 1 % glucose. Potential suppressor mutants were transferred to soil and the M3
progeny was rescreened. The soh715 mutation was
mapped by crossing to Landsberg erecta and F2 seeds
were screened for long hypocotyls as described above
and subsequently genotyped for homozygous hsr8-1
mutation using the LightCycler®480 System and Hybprobes® technology (Roche Applied Science and TIB
MOLBIOL GmbH). These plants were assumed to be
homozygous for the soh715 mutation and used for initial mapping of the mutation. Once the approximate location of the mutation was determined, total RNA of
hsr8-1 and soh715hsr8-1 were extracted using the
RNeasy plant mini kit (QIAGEN) and used for Affymetrix GeneChip array expression profiling to identify deleted genomic regions (Affymetrix, Santa Clara, CA,
USA). We identified a cluster of six consecutive downregulated genes in the soh715hsr8-1-mapped region on
chromosome 1 that may be due to a deletion. The
soh715hsr8-1 mutant was transformed with genomic
fragments containing the sequence of the six genes in
the deletion. Additional file 4: Table S3 describes the
primers used for cloning genomic fragments using the
TOPO® XL PCR Cloning kit (Invitrogen). Cloned genes
were subcloned in the pCAMBIA1300 binary vector
using the ApaI restriction site and used for Agrobacterium-mediated transformation. Transgenic T1 plants
were screened on 30 μg/mL hygromycin, and complementation of the soh715hsr8-1 long hypocotyl phenotype was assessed in the T2 generation.
Hypocotyl and anthocyanin measurements
Hypocotyl length was measured from 14-day old dark
grown seedlings (n = 30) by scanning plates and using
ImageJ software ( Anthocyanins
were extracted and quantified as described in [57].
Cell wall analysis
Cell walls were prepared from frozen samples by boiling
in 96 % ethanol for 10mins, homogenisation, repeated
methanol:chloroform (2:3 v/v) extraction, 80 % ethanol
extraction and dehydration in 96 % ethanol before drying at room temperature. Aliquots of 50 μg were dried,
treated with 2 M TFA (trifuoroacetic acid) for 1 h at
120 °C, and then dried again. Samples were then resuspended in 5 % (v/v) acetonitrile and injected into an
M-Scan High Performance Anion Exchange Chromatography system with Pulsed Amperometric Detection
(HPAEC-PAD). Monosaccharides were detected using
standards and values expressed as mole %. Fourier transform Infrared absorbance spectra were collected from
Page 11 of 13
800 to 4000 cm−1 using a Biorad FTS 175C spectrophotometer. Hypocotyl material was ground and clamped
against the diamond element. Two spectra from three biological replicates were obtained. Principle Components
Analyses were conducted using Genstat version 15.
Gene expression
Total RNA was extracted and DNase treated using the
RNeasy Plant mini kit (QIAGEN). 2 μg were used for reverse transcription (MMLV-RT, Invitrogen) with anchored oligo(dT)23. Quantitative real-time PCR was
performed with the LightCycler®480 system using the
LightCycler®480 SYBR Green I Master 2X (Roche Applied Science) and gene specific primers listed in
Additional file 4: Table S3. Primer specificity and efficiency was confirmed by standard and melting curve analyses. Relative transcript levels (RTL) were calculated
relative to the transcript level of the reference gene TUB6
(At5g12250) as follows: RTL = 1000*2-(Cptarget-CpTUB6).
Whole-genome transcriptome analysis was conducted by
hybridizing three biological replicate samples of total RNA
to Affymetrix GeneChip Arabidopsis ATH1 Genome arrays (Affymetrix, Santa Clara, CA, USA). All steps were
conducted at the Nottingham Arabidopsis Stock Centre.
Gene expression data were analysed using Partek Genomics Suite 6.6 software (Partek Incorporated, St Louis,
USA). The raw CEL files were normalized using the RMA
background correction with quantile normalization, log
base 2 transformation and mean probe-set summarization
with adjustment for GC content. Differentially expressed
genes (DEG) were identified by a two-way ANOVA, and
P-values were adjusted using the FDR (false-discovery
rate) method to correct for multiple comparisons. DEG
were considered significant if P-value was ≤ 0.05 at a foldchange (FC) of ≥ 2 with an FDR < 0.05. Hierarchical clustering in was performed using the default settings in
Partek. The average distance between all pairs of objects
in the two different clusters was used as the measure of
distance between the two clusters, and was measured
using Un-weighted Pair-Group Method using arithmetic
Averages. Clusters were then merged (agglomerated) until
all of the data (genes) were in one cluster.
Availablity of supporting data
Microarray data are available in the ArrayExpress database (www.ebi.ac.uk/arrayexpress) under accession number E-MTAB-2297.
Additional files
Additional file 1: Figure S1. Scatter plots of Principle Components 1, 2
and 3 identified from FTIR measurements of cell wall composition.
Figure S2. JA responsive genes are not up- regulated in hsr8.
Quantitative Real-time PCR analysis of VSP1, VSP2 and ERF1 mRNA
Seguela-Arnaud et al. BMC Plant Biology (2015) 15:215
levels in Col and hsr8. Seedlings were grown vertically in the dark
for 14 days on MS medium in the presence of 1 % glucose. Errors
bars represent SD from three biological replicates. **, p < 0.01 comparing
Col to hsr8-1 (Student’s t- test). Figure S3. Sugar- regulated gene expression
in the single mutant pft1-2. (A) to (E) Quantitative Real-time PCR analysis of
mRNA levels of the glucose-responsive genes APL3, BAM, GBSS1, GPT2, PDC1
in Col and pft1-2 in response to glucose. Seedlings were grown on MS
medium supplemented with 0.5 % glucose in constant light. After 7 days,
the seedlings were transferred for 24 h to glucose-free MS liquid medium
(solid bars) and then treated for 6 h with 3 % glucose (dashed bars). Errors
bars represent SD from three biological replicates. Data shown is
representative of three independent experiments. **, p < 0.01 comparing
glucose responses in Col to pft1-2 (Student’s t- test). (G) and (H) Quantitative
Real-time PCR analysis of mRNA levels of the anthocyanin biosynthesis
genes CHS, TT6 and FLS in Col and pft1-2 in response to glucose. Seedlings
were grown on MS medium supplemented with 0.5 % glucose in
constant light. After 7 days, the seedlings were transferred for 24 h to
glucose-free MS liquid medium (solid bars) and then treated for 6 h with
3 % glucose (dashed bars). Errors bars represent SD from three biological
replicates. Data shown is representative of three independent experiments.
**, p < 0.01 comparing glucose responses in Col to pft1-2 (Student’s t- test).
Relative transcript levels (RTL) were calculated relative to the transcript level
of the reference gene TUB6 (At5g12250). (I) Anthocyanin accumulation in
response to glucose in Col and pft1-2 in response to glucose. Seedlings
were grown in continuous light for 7 days on MS containing 1 % glucose
(solid bars) or 3 % glucose (dashed bars). Errors bars represent SD from three
biological replicates. **, p < 0.01 comparing glucose responses in Col to
pft1-2 (Student’s t- test). Data shown is representative of two independent
experiments. Figure S4. PFT1 regulates the expression of genes encoding
cell wall- related genes. Quantitative Real-time PCR analysis of genes
encoding the pectin methylesterases PME17 (A), PME41 (B), and the extensin
proteins AtEXT3 (C) and AtEXT4 (D) in Col, hsr8-1, pft1-2hsr8-1 and pft1-2.
Seedlings were grown vertically in the dark for 14 days on MS medium in
the presence of 1 % Glucose. Errors bars represent SD from three biological
replicates. Panels A-D **, p < 0.01 comparing Col to hsr8-1 (Student’s t- test);
panels B and D **, p < 0.01 comparing pft1-2 hsr8-1 to pft1-2 (Student’s
t- test). Relative transcript levels (RTL) were calculated using transcript levels
of the reference gene TUB6 (At5g12250). (PPTX 97 kb)
Additional file 2: ANOVA tables of glucose- responsive gene
expression in Col and pft1-2. (XLS 1314 kb)
Additional file 3: ANOVA tables of gene expression in dark grown
seedlings of Col, hsr8-1, hsr8-1pft1-2 and pft1-2. (XLS 68 kb)
Additional file 4: Primers used in gene amplification and Q-RTPCR.
(DOCX 100 kb)
Page 12 of 13
light conditions, and Dr Harry Brumer of the University of British Columbia
for providing seeds of an Arabidopsis xth31xth32 double mutant.
Author details
1
Cell and Developmental Biology Department, John Innes Centre, Colney
Lane, Norwich NR4 7UH, UK. 2INRA, Institut Jean-Pierre Bourgin, UMR1318,
ERL CNRS 3559, Saclay Plant Sciences, RD10, 78000 Versailles, France.
3
Nottingham Arabidopsis Stock Centre, University of Nottingham, School of
Biosciences, Loughborough LE12 5RD, UK. 4Department of Biochemistry,
University of Oxford, South Parks Rd, Oxford OX1 3QU, UK.
Received: 10 April 2015 Accepted: 13 August 2015
References
1.
2.
3.
4.
5.
6.
7.
8.
9.
10.
11.
12.
Abbreviations
ANOVA: Analysis of variance; ALOG: Arabidopsis LSH1 and oryza G1; BAM:
β-amylase; COR: Cold regulated gene; FTIR: Fourier transform infraRed
spectroscopy; GSL: Glucosinolate; JA: Jasmonic Acid; LTP: Lipid Transfer
Protein; MED25/PFT1 MEDIATOR25/PHYTOCHROME AND FLOWERING TIME 1;
PCA: Principal Component Analysis; PRL1: Pleitropic Regulatory Locus 1;
WAK: Cell Wall-Associated Kinase.
14.
Competing interests
The authors declare they have no competing interests.
15.
Authors’ contributions
MS-A and MWB designed experiments, MS-A, CS, HF and NM conducted
experiments, MC-U and SM conducted microarray experiments and analysed
data, and MWB and MS-A wrote the manuscript. All authors read and approved
the final manuscript.
Acknowledgements
This work was supported by a Marie Curie Fellowship to M.S-A. (PIEF-GA2009-236779) and BBSRC grants BB/F007582/1 and BB/J004588/1 (GRO) to
M.W.B. We thank Dr Thomas Simmons and Professor Paul Dupree of the
University of Cambridge for monosaccharide analyses, Dr Charlotte Miller
and Dr Rachel Wells of the John Innes Centre for FTIR analyses, Dr Kerry
Franklin of the University of Leicester for help with plant growth in different
13.
16.
17.
18.
19.
Somerville C, Bauer S, Brininstool G, Facette M, Hamann T, Milne J, et al.
Toward a systems approach to understanding plant cell walls. Science.
2004;306:2206–11.
Reiter W-D. Biosynthesis and properties of the plant cell wall. Curr Opin
Plant Biol. 2002;5:536–42.
Geisler DA, Sampathkumar A, Mutwil M, Persson S. Laying down the bricks:
logistic aspects of cell wall biosynthesis. Curr Opin Plant Biol. 2008;11:647–52.
McFarlane HE, Döring A, Persson S. The cell biology of cellulose synthesis.
Annu Rev Plant Biol. 2014;65:69–94.
Rolland F, Baena-González E, Sheen J. Sugar sensing and signaling in
plants: conserved and novel mechanisms. Annu Rev Plant Biol.
2006;57:675–709.
Sairanen I, Novak O, Pencik A, Ikeda Y, Jones B, Sandberg G, et al. Soluble
Carbohydrates Regulate Auxin Biosynthesis via PIF Proteins in Arabidopsis.
Plant Cell. 2013;24:4907–16.
Kohorn BD, Kobayashi M, Johansen S, Riese J, Huang L-F, Koch K, et al.
An Arabidopsis cell wall-associated kinase required for invertase activity and
cell growth. Plant J. 2006;46:307–16.
Hamann T, Bennett M, Mansfield J, Somerville C. Identification of cell-wall
stress as a hexose-dependent and osmosensitive regulator of plant
responses. Plant J. 2009;57:1015–26.
Li Y, Smith C, Corke F, Zheng L, Merali Z, Ryden P, et al. Signaling from an
Altered Cell Wall to the Nucleus Mediates Sugar-Responsive Growth and
Development in Arabidopsis thaliana. Plant Cell. 2007;19:2500–15.
Koncz C, Dejong F, Villacorta N, Szakonyi D, Koncz Z. The spliceosomeactivating complex: molecular mechanisms underlying the function of a
pleiotropic regulator. Front Plant Sci. 2012;3:9.
Wolf S, Hématy K, Höfte H. Growth Control and Cell Wall Signaling in Plants.
Annu Rev Plant Biol. 2012;63:381–407.
Bonawitz ND, Kim JI, Tobimatsu Y, Ciesielski PN, Anderson NA, Ximenes E,
et al. Disruption of Mediator rescues the stunted growth of a lignindeficient Arabidopsis mutant. Nature. 2014;509:1–17.
Bonawitz ND, Soltau WL, Blatchley MR, Powers BL, Hurlock AK, Seals LA,
et al. REF4 and RFR1, Subunits of the Transcriptional Coregulatory Complex
Mediator, Are Required for Phenylpropanoid Homeostasis in Arabidopsis. J
Biol Chem. 2012;287:5434–45.
Burget EG. The Biosynthesis of L-Arabinose in Plants: Molecular Cloning and
Characterization of a Golgi-Localized UDP-D-Xylose 4-Epimerase Encoded
by the MUR4 Gene of Arabidopsis. Plant Cell. 2003;15:523–31.
Mitra RM, Gleason CA, Edwards A, Hadfield J, Downie JA, Oldroyd GED, et al.
A Ca2+/calmodulin-dependent protein kinase required for symbiotic nodule
development: Gene identification by transcript-based cloning. Proc Natl
Acad Sci U S A. 2004;101:4701–5.
Cerdán PD, Chory J. Regulation of flowering time by light quality. Nature.
2003;423:881–5.
Bäckström S, Elfving N, Nilsson R, Wingsle G, Björklund S. Purification of a
plant mediator from Arabidopsis thaliana identifies PFT1 as the Med25
subunit. Mol Cell. 2007;26:717–29.
Jiang K, Sorefan K, Deeks MJ, Bevan MW, Hussey PJ, Hetherington AM. The
ARP2/3 complex mediates guard cell actin reorganization and stomatal
movement in Arabidopsis. Plant Cell. 2012;24:2031–40.
Largo-Gosens A, Hernandez-Altamirano M, Garcia-Calvo L, Alonso-Simon A,
Alvarez J, Acebes JL. Fourier transform mid infrared spectroscopy
applications for monitoring the structural plasticity of plant cell walls. Front
Plant Sci. 2014;5:303.
Seguela-Arnaud et al. BMC Plant Biology (2015) 15:215
Dijkwel PP, Huijser C, Weisbeek PJ, Chua NH, Smeekens SC. Sucrose control
20. of phytochrome A signaling in Arabidopsis. Plant Cell. 1997;9:583–95.
Nagatani A, Reed JW, Chory J. Isolation and Initial Chraracterisation of
21. Arabidopsis mutants that are deficient in Phytochrome A. Plant Physiol.
1993;102:269–77.
Koornneef M, Rolff E, Spruit CJP. Genetic Control of Light-inhibited
22. Hypocotyl Elongation in Arabidopsis thaliana (L.) Heynh. Z Pflanzenphysiol.
1980;100:147–60.
Kidd BN, Edgar CI, Kumar KK, Aitken EA, Schenk PM, Manners JM, et al. The
23. mediator complex subunit PFT1 is a key regulator of jasmonate-dependent
defense in Arabidopsis. Plant Cell. 2009;21:2237–52.
Ellis C, Turner JG. The Arabidopsis Mutant cev1 Has Constitutively Active
24. Jasmonate and Ethylene Signal Pathways and Enhanced Resistance to
Pathogens. Plant Cell. 2001;13:1025–33.
Cano-Delgado A, Penfield S, Smith C, Catley M, Bevan M. Reduced cellulose
25. synthesis invokes lignification and defense responses in Arabidopsis
thaliana. Plant J. 2003;34:351–62.
Devoto A, Nieto-Rostro M, Xie D, Ellis C, Harmston R, Patrick E, et al. COI1
26. links jasmonate signalling and fertility to the SCF ubiquitin-ligase complex
in Arabidopsis. Plant J. 2002;32:457–66.
Malik S, Roeder RG. The metazoan Mediator co-activator complex as an
27. integrative hub for transcriptional regulation. Nat Rev Genet. 2010;11:761–72.
Teng S. Sucrose-Specific Induction of Anthocyanin Biosynthesis in Arabidopsis
28. Requires the MYB75/PAP1 Gene. Plant Physiol. 2005;139:1840–52.
Lejay L, Tillard P, Lepetit M, Olive FD, Filleur S, Daniel-Vedele F, et al.
29. Molecular and functional regulation of two NO3- uptake systems by N- and
C-status of Arabidopsis plants. Plant J. 1999;18:509–19.
Koprivova A, Kopriva S. Molecular mechanisms of regulation of sulfate
30. assimilation: first steps on a long road. Front Plant Sci. 2014;5:589.
Guo R, Shen W, Qian H, Zhang M, Liu L, Wang Q. Jasmonic acid and
31. glucose synergistically modulate the accumulation of glucosinolates in
Arabidopsis thaliana. J Exp Bot. 2013;64:5707–19.
Gigolashvili T, Yatusevich R, Berger B, Müller C, Flügge U-I. The R2R3-MYB
32. transcription factor HAG1/MYB28 is a regulator of methionine-derived
glucosinolate biosynthesis in Arabidopsis thaliana. Plant J. 2007;51:247–61.
Nieuwland J, Feron R, Huisman BAH, Fasolino A, Hilbers CW, Derksen J, et al.
33. Lipid transfer proteins enhance cell wall extension in tobacco. Plant Cell.
2005;17:2009–19.
Goh H-H, Sloan J, Dorca-Fornell C, Fleming A. Inducible repression of
34. multiple expansin genes leads to growth suppression during leaf
development. Plant Physiol. 2012;159:1759–70.
Li Y. Establishing glucose- and ABA-regulated transcription networks in
35. Arabidopsis by microarray analysis and promoter classification using a
Relevance Vector Machine. Genome Res. 2006;16:414–27.
Eklöf JM, Brumer H. The XTH gene family: an update on enzyme structure,
36. function, and phylogeny in xyloglucan remodeling. Plant Physiol.
2010;153:456–66.
Wu AM, Hornblad E, Voxeur A, Gerber L, Rihouey C, Lerouge P, et al.
37. Analysis of the Arabidopsis IRX9/IRX9-L and IRX14/IRX14-L Pairs of
Glycosyltransferase Genes Reveals Critical Contributions to Biosynthesis of
the Hemicellulose Glucuronoxylan. Plant Physiol. 2010;153:542–54.
Zhao L, Nakazawa M, Takase T, Manabe K. Overexpression of LSH1, a
38. member of an uncharacterised gene family, causes enhanced light
regulation of seedling development. Plant J. 2004;37:694–706.
Kidd BN, Cahill DM, Manners JM, Schenk PM, Kazan K. Diverse roles of the
39. Mediator complex in plants. Semin Cell Dev Biol. 2011;22:741–8.
Xu R, Li Y. The Mediator complex subunit 8 regulates organ size in
40. Arabidopsis thaliana. Plant Signal Behav. 2012;7:182–3.
la Cera de T, Herrero P, Moreno-Herrero F, Chaves RS, Moreno F. Mediator
41. Factor Med8p Interacts with the Hexokinase 2: Implication in the Glucose
Signalling Pathway of Saccharomyces cerevisiae. J Mol Biol. 2002;319:703–14.
Elfving N, Davoine C, Benlloch R, Blomberg J, Brännström K, Müller D, et al.
42. The Arabidopsis thaliana Med25 mediator subunit integrates environmental
cues to control plant development. Proc Natl Acad Sci U S A.
2011;108:8245–50.
Klose C, Buche C, Fernandez AP, Schafer E, Zwick E, Kretsch T. The Mediator
43. Complex Subunit PFT1 Interferes with COP1 and HY5 in the Regulation of
Arabidopsis Light Signaling. Plant Physiol. 2012;160:289–307.
Conaway RC, Conaway JW. Function and regulation of the Mediator
44. complex. Curr Opin Genet Dev. 2011;21:225–30.
Page 13 of 13
Kagey MH, Newman JJ, Bilodeau S, Zhan Y, Orlando DA, van Berkum NL,
45. et al. Mediator and cohesin connect gene expression and chromatin
architecture. Nature. 2010;467:430–5.
Ou B, Yin K-Q, Liu S-N, Yang Y, Gu T, Wing Hui JM, et al. A high-throughput
46. screening system for Arabidopsis transcription factors and its application to
Med25-dependent transcriptional regulation. Mol Plant. 2011;4:546–55.
Xu R, Li Y. Control of final organ size by Mediator complex subunit 25 in
47. Arabidopsis thaliana. Development. 2011;138:4545–54.
Iñigo S, Alvarez MJ, Strasser B, Califano A, Cerdán PD. PFT1, the MED25
48. subunit of the plant Mediator complex, promotes flowering through
CONSTANS dependent and independent mechanisms in Arabidopsis. Plant
J. 2012;69:601–12.
Kaewthai N, Gendre D, Eklof JM, Ibatullin FM, Ezcurra I, Bhalerao RP, et al.
49. Group III-A XTH Genes of Arabidopsis Encode Predominant Xyloglucan
Endohydrolases That Are Dispensable for Normal Growth. Plant Physiol.
2012;161:440–54.
Zhu XF, Wan JX, Sun Y, Shi YZ, Braam J, Li GX, et al. Xyloglucan
50. Endotransglucosylase-Hydrolase17 Interacts with Xyloglucan
Endotransglucosylase-Hydrolase31 to Confer Xyloglucan
Endotransglucosylase Action and Affect Aluminum Sensitivity in
Arabidopsis. Plant Physiol. 2014;165:1566–74.
Miedes E, Suslov D, Vandenbussche F, Kenobi K, Ivakov A, Van Der Straeten D,
51. et al. Xyloglucan endotransglucosylase/hydrolase (XTH) overexpression affects
growth and cell wall mechanics in etiolated Arabidopsis hypocotyls. J Exp Bot.
2013;64:2481–97.
Sasidharan R, Chinnappa CC, Staal M, Elzenga JTM, Yokoyama R, Nishitani K,
52. et al. Light Quality-Mediated Petiole Elongation in Arabidopsis during Shade
Avoidance Involves Cell Wall Modification by Xyloglucan Endotransglucosylase/
Hydrolases. Plant Physiol. 2010;154:978–90.
Cosgrove DJ. Loosening of plant cell walls by expansins. Nature.
53. 2000;407:321–6.
de Lucas M, Davière J-M, Rodríguez-Falcón M, Pontin M, Iglesias-Pedraz JM,
54. Lorrain S, et al. A molecular framework for light and gibberellin control of
cell elongation. Nature. 2008;451:480–4.
Baena-González E, Sheen J. Convergent energy and stress signaling. Trends
55. Plant Sci. 2008;13:474–82.
Koprivova A, Calderwood A, Lee B-R, Kopriva S. Do PFT1 and HY5 interact in
56. regulation of sulfate assimilation by light in Arabidopsis? FEBS Lett.
2014;588:1116–21.
Baier M, Hemmann G, Holman R, Corke F, Card R, Smith C, et al.
57. Characterization of mutants in Arabidopsis showing increased sugar-specific
gene expression, growth, and developmental responses. Plant Physiol.
2004;134:81–91.
Submit your next manuscript to BioMed Central
and take full advantage of:
• Convenient online submission
• Thorough peer review
• No space constraints or color figure charges
• Immediate publication on acceptance
• Inclusion in PubMed, CAS, Scopus and Google Scholar
• Research which is freely available for redistribution
Submit your manuscript at
www.biomedcentral.com/submit