A longitudinal study of audit quality differences among independent auditorsA longitudinal study of audit quality differences among independent auditors
Bạn đang xem bản rút gọn của tài liệu. Xem và tải ngay bản đầy đủ của tài liệu tại đây (142.86 KB, 13 trang )
The current issue and full text archive of this journal is available on Emerald Insight at:
www.emeraldinsight.com/1859-0020.htm
JED
21,2
A longitudinal study of audit
quality differences among
independent auditors
234
Manh Dung Tran
National Economics University, Hanoi, Vietnam
Received 1 April 2019
Revised 2 July 2019
Accepted 20 July 2019
Khairil Faizal Khairi
University Sains Islam, Bandar Baru Nilai, Malaysia, and
Nur Hidayah Laili
University Sains Islam, Kuala Lumpur, Malaysia
Abstract
Purpose – The purpose of this paper is to investigate the differences of audit quality of financial statements
among auditors, including Big 4 and non-Big 4 auditors.
Design/methodology/approach – By employing cross-sectional analysis of compliance (a proxy of audit
quality) of goodwill impairment testing of listed firms in the context of Hong Kong, the variation of audit
quality of financial statements of auditees has been shown.
Findings – Audit quality of Big 4 auditors is viewed to be higher than that of non-Big 4 audit firms and the
homogeneity of audit quality among Big 4 auditors is not long accepted, but variation.
Practical implications – Even though unqualified opinions have been given on the auditors’ reports, the
quality of financial statements audit is a skeptical issue because of the high level of non-compliance of
goodwill impairment testing under International Financial Reporting Standards.
Originality/value – This study does emphasize the higher audit quality of financial statements of Big
4 auditors than that of non-Big 4 auditors and stresses the variation of audit quality among Big 4 auditors.
Keywords Hong Kong, Goodwill, Audit quality, HKAS 36
Paper type Research paper
1. Introduction
Audit quality is viewed as one of the most important issues in the audit activities (Kit, 2005)
and is defined as probability that financial statements are fairly presented when an
unqualified opinion is given (Simunic, 2003). The acceptance of big audit firm associated
with high audit quality for a long passage of time is given in a huge literature (DeAngelo,
1981; Balvers et al., 1988; Firth and Smith, 1992; Copley et al., 1994). However, that
acceptance is undermined by bankruptcy of some auditees and auditors as well.
In order to have a high audit quality, material misstatements should be detected basing on
technical competence and reported basing on independence of an auditor. In other words, high
audit quality relates to high information quality of financial reporting since financial statements
audited by high-quality auditors should be less likely to contain material distortions (Dang, 2004).
Currently, about 140 countries, including Hong Kong, switched to International Financial
Reporting Standards (IFRS)-based financial reporting framework. The adoption of IFRS
views is the most revolutionary financial reporting development and makes very difficult
for financial statement practitioners including accountants and auditors as well.
Journal of Economics and
Development
Vol. 21 No. 2, 2019
pp. 234-246
Emerald Publishing Limited
e-ISSN: 2632-5330
p-ISSN: 1859-0020
DOI 10.1108/JED-10-2019-0040
© Manh Dung Tran, Khairil Faizal Khairi and Nur Hidayah Laili. Published in Journal of Economics
and Development. Published by Emerald Publishing Limited. This article is published under the
Creative Commons Attribution (CC BY 4.0) licence. Anyone may reproduce, distribute, translate and
create derivative works of this article (for both commercial and non-commercial purposes), subject to
full attribution to the original publication and authors. The full terms of this licence may be seen at
/>
For the convergence of IFRS, Hong Kong has set up an own accounting framework,
Hong Kong Financial Reporting Standards (HKFRS), that came into effect from January 1, 2005.
Because of over-complexity and challenged requirements in HKFRS, there is a high possibility to
have potentials misstatements in the financial statements of listed firms in the early years after
HKFRS implementation. This also makes more difficult for an auditor to detect misstatements in
an audittee’s accounting system. So audit quality may be influenced in these circumstances.
Impairment of assets including goodwill impairment and its disclosure is viewed as one
of the most complicated issues in practices (Hoogendoorn, 2006). Forming financial
statements complying with the requirements of HKAS 36 “Impairment of Assets” or IAS 36
equivalent requires listed firms to employ some financial principles drawn from
discounting, forecasting and valuation models under potentially uncertain situations.
With different subjective assumptions relating to discount rates, growth rates and forecast
periods result in outcomes of present values that are discounted from future cash flows and
to evaluate which the best outcome is too difficult and have potential controversy.
Because assurance of an audit (audit quality) is likely to be positively associated with
compliance with standards (Copley et al., 1994), changes in disclosure of goodwill
impairment in the note to financial statements are likely to be the result of variations in
audit quality. So measurement of audit quality variations employed in this study is the
extent of compliance changes with the disclosure requirements of HKAS 36 in the data set of
time series. So the level of technical compliance with requirements of disclosures considers
as a surrogate for audit quality in relation to challenged and over-complicated items of the
goodwill impairment testing framework.
This study is structured as follows. Section 2 reviews the suitable literature of audit
quality. Section 3 describes the data sample collection and methodology employed in the
conduct of the research. Section 4 sets out a discussion of key results, while Section 5 shows
some key conclusions and implications of the study practice and potential further research.
2. Literature review
Audit quality is defined as the probability that an auditor detects and reports material
misstatements in the accounting system of an auditee (DeAngelo, 1981). It means that audit
quality is stated as probability that financial statements are free from material
misstatements (Palmrose, 1988). In that perception, audit quality includes two elements:
the first is generally explained to be related to the technical competence, and the second
bears on independence of an auditor (Caneghem, 2004).
However, the quality of an audit is not public information and cannot be directly
observed by financial statement users. So, evaluating audit quality is one of the most
controversial issues nowadays. Auditor size is by far one of the most frequently employed
as a proxy for audit quality in previous studies. DeAngelo (1981) demonstrates that larger
audit firms have more clients, more reputations and more to lose by failing to report
discovered misstatements in the financial statements than smaller audit firms have. So this
motivates big audit firms to work harder than non-big audit firms, and, ceteris paribus, more
efforts imply higher audit quality. DeF and Jiambalvo (1991) found that larger audit firms
incur costs to develop a reputation for adding value to the audit and are better able to detect
and inform material misstatements in the financial statements.
A series of empirical evidence is ostensibly consistent with the hypothesis that big
auditors provide higher audit quality than small ones. Moize (1997) suggests that big firms’
audit fees are higher than non-big firms’ audit fees. The reason is that higher audit fee is
related with a greater number of hours and hence a higher reputation implies a higher audit
quality. Becker et al. (1998) show that discretionary accruals of auditees with non-big
auditors are higher than that of clients with big auditors, meaning that higher audit quality
is more likely to successfully detect and prevent earnings management of audfitees.
Audit quality
differences
235
JED
21,2
236
Big audit firms have been found to have lower litigation occurrence rates than non-big
audit firms (Palmrose, 1988). Krishnan and Schauer (2000) conclude that the compliance of
Generally Accepted Accounting Principles (GAAP) reporting requirements of big audit firm
clients are higher than that of non-big audit firm clients and assume that extent of
compliance with GAAP is likely to be related to the probability of detecting and revealing
material misstatements.
There are more and more other huge literature also provide much empirical evidence for
asserting that auditor size is a proxy for audit quality. However, events of the bankruptcies
of many clients such as WorldCom and auditors as well as such as Arthur Anderson have
both reduced the good image of audit industry.
A small number of recent studies have begun to examine the possibility of differential
audit quality among large audit firms, rather than assuming that there is a homogeneous
audit quality among large audit firms. Fuerman (2004) looks into the possibility of audit
quality differentials among large audit firms by examining financial disclosures relating to
private securities class actions from 1996 to 1998 and finds that Arthur Andersen produced
audits of lower quality compared against the remainder of the Big 6 auditors, but
distinguishing audit quality among these audit firms was impossible. In contrast, Eisenberg
and Macey (2003) analyze the financial restatements performed by auditors and find no
evidence of audit quality differentials among large audit firms, including Arthur Andersen.
While audit quality literature is propensity to support the idea that audit quality
undertaken by large auditors outweighs that undertaken by small auditors, there is little
evidence to reveal audit quality change among big auditors. Because aspects of the
probability to discovering and reporting material misstatements are unobservable
(Krishnan and Schauer, 2000), so researchers have selected two approaches for
evaluating audit quality in empirical work, namely, indirect and direct methods.
The evaluation of audit quality on an indirect method tends to stem from a process of
comparing observed values for some accepted surrogates for quality among audit firms,
while attempts to measure direct audit quality through the process of the audit.
As analyzed above, the issue of audit quality variations among big audit firms as well as
big audit firms vs non-big audit firms reveals very importance and needs to be investigated.
Further, in countries where the adoption of the IFRS-based reporting framework has
coincided with other types of structural shifts influencing much on audit services,
significant emphasis has been directed toward auditors (Carlin et al., 2009). So the
implementation of IFRS represents a good point to be scrutinized including the issue of
goodwill impairment testing regime.
Measuring and reporting goodwill based on the IFRS framework produce significant
challenges to Hong Kong listed firms. Almost all listed firms will be influenced by the more
highly prescriptive impairment test under HKAS 36. With over-complex and challenged
requirements, issues of identifying, measuring and reporting goodwill and its impairment
are really difficult for listed firms to use. Under HKAS 36, listed firms are supposed to deal
with considerably expanded disclosure requirements in particular bearing on to method
employed for measuring the cash generating unit (CGU) recoverable amount, impairment
testing regime, including disclosures relating to key subjective assumptions.
Value of goodwill is impaired in case recoverable amount of portfolios of assets (known
as CGUs) lowers than carrying amount (book value) related to those assets. Recoverable
amount is defined as the higher of an asset’s or a CGU’s fair value less costs of disposal and
its value in use. It turns out that listed firms are required to select either a fair value or value
in use for estimating CGU-recoverable amount, and each method produces considerable
implications for the types of disclosures provided by listed firms.
HKAS 36 requires limited disclosures of the assumptions and processes adopted by a
firm which has chosen fair value as the benchmark for impairment testing, whereas more
specific and highly detailed disclosures are required listed firms to report when employing
value in use for determination of CGU recoverable amount.
The adoption of goodwill impairment has not produced significant changes to the format
and nature of information on the face of financial position statement and comprehensive
income statement; it has considerably changed to disclose information relating to goodwill
in the notes to the consolidated financial statements. These changes would have been
revealed in the accounting policies and specific notes for justifying the value of goodwill in
the financial position statement.
From an audit perspective, the IFRS framework results in overwhelming increases in
disclosures, and requires more involvement of auditors in achieving full compliance with
IFRS. Apparently, volume of audit work increases significantly due to complicated
provisions in IFRS as well as overwhelming information disclosures in the notes to the
financial statements.
Shifting to an IFRS-based regime for goodwill impairment has a big impact on
disclosures in the notes to the financial reports. The highly detailed disclosure requirements
in HKAS 36 represent a good opportunity to look into the compliance levels that were
undertaken by listed firms, and provide insights of audit quality differentials among
auditors. Since goodwill impairment testing is the one used to identify misstatements in the
accounting system of an auditee, the extent of compliance is likely to be directly correlated
with the probability of discovering and reporting material misstatements in the accounting
system, or audit quality.
3. Research methodology
The study consists of the first three years of financial reporting pursuant to HKAS 36
in Hong Kong. The Worldscope Datastream database was used to identify the population
of firms listed on the Hong Kong Stock Exchange (HKEx) in the first three years
adoption of HKFRS.
In constructing the final research sample, a number of steps were undertaken. First,
firms are required to be the members in main board of HKEx as at December each year.
Second, commence with the largest of these firms (based on the market capitalization) and
move to each smaller company. Third, choose listed firms which have goodwill balances as
their asset bases in the consolidated financial statements and applied HKFRS in each year.
As a result, there are 161 listed firms with market value of $4,431bn in the first time
(accounting for 54.61 percent in total market values), 249 with market capitalization of
$8,349bn (about 63.02 percent) in the second time and 264 with market values of $12,922bn
(about 62.93 percent) in the third time.
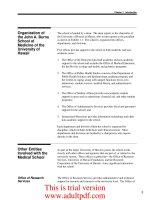
Table I shows the number of firms audited by auditors, and by industry sectors in
the multi-year data set. There was no evidence in the multi-year data set of significant
variations pertaining to the number of firms audited by auditors. The number of clients
for each auditor in the multi-year data set is uneven, with PricewaterhouseCoopers
(PWC) dominating in the each year sample, followed by Deloitte, Ernst and Young (EY),
and KPMG, and other auditors (or non-Big 4 auditors) with minimal share in the
research sample.
A crucial issue is the extent to which auditees comply with over complex technical
provisions of a new and challenged standard. Potential interests of CGU issue, discount rate
and growth rate disclosures should be investigated under HKAS 36. A cross-sectional
procedure were applied to the sample data.
First, sample firms were sorted by audit firm identity, according to whether they
employed a value in use method to estimation of CGU recoverable amount, a fair value less
costs of disposal method, a combination of methods (i.e. the use of value in use in some
CGUs and use of fair value in others), or failed to disclose the method used.
Audit quality
differences
237
1st time
3
6
5
2
2
18
11.2
Sectors
Consumer goods and conglomerate
Financials
Telecommunication and services
Materials and industrial goods
Utilities, energy and construction
Total (n)
Percentages in each year (%)
Table I.
Number of firms
audited by sectors
1st time
48
16
47
20
30
161
100
3rd time
77
25
62
37
63
264
100
3rd time
4
9
6
7
4
30
11.4
No. of firms
2nd time
73
24
69
29
54
249
100
KPMG
2nd time
5
8
7
4
7
31
12.5
1st time
13
4
23
5
11
56
34.8
1st time
13
3
8
9
10
43
26.7
PWC
2nd time
17
3
30
5
17
72
28.9
Deloitte
2nd time
22
6
11
11
17
67
26.9
3rd time
21
4
24
6
21
76
28.8
3rd time
16
5
13
11
18
63
23.9
1st time
6
0
2
1
2
11
6.8
1st time
13
3
9
3
5
33
20.5
Non-Big 4
2nd time
11
0
11
2
4
28
11.2
EY
2nd time
18
7
10
7
9
51
20.5
238
Sectors
Consumer goods and conglomerate
Financials
Telecommunication and services
Materials and industrial goods
Utilities, energy and construction
Total (n)
Percentages in each year (%)
3rd time
15
0
9
5
8
37
14.0
3rd time
21
7
10
8
12
58
22.0
JED
21,2
Second, the firms in the research sample were classified by audit firm identity, according to
whether they allocated all goodwill values to the defined CGUs, or whether they allocated
partially goodwill values to CGUs, or whether their disclosures were not given so it was
impossible to determine how or if value of goodwill had been allocated to defined CGUs.
Third, the sample firms were filtered by audit firm, according to the relationship between
the number of CGUs defined for the purpose of goodwill impairment testing and the number
of operating segments for the purpose of segment information reporting.
Fourth, the sample firms were sorted by audit firm, according to the quality of discount
rate disclosure in the goodwill impairment testing process. Data were stratified into four
categories, namely, multiple discount rates, single discount rate, range of discount rates and
no effective disclosure:
(1) Firms categorized in the first category, i.e. “multiple discount rate,” appeared to fully
comply with the disclosure requirements of HKAS 36 by disclosing unique rates
applicable to each of their various CGUs. This type of disclosure fully complies with
the standard requirements and provides a higher assurance of process quality
through different discount rates to each defined CGU.
(2) Firms in the second category, i.e. “single discount rate,” revealed that they defined
blanket whole of company discount rate for all defined CGUs for estimating CGU
recoverable amount in the discounted cash flow model. This did not appear to align
with the requirements that a discount rate unique to each defined CGU and each
CGU risk was arguably different.
(3) Firms were assigned in the third category disclosed a range of discount rates which
had been employed for estimating the CGU recoverable amount in the discounted cash
flow model. Because of lacking a specific discount rate to each defined CGU, it is
questionable whether disclosure of this category meets the requirements of HKAS 36.
(4) Allocation of firms in the fourth category signified that the firms failed to provide
inadequate discount rate disclosure and, in consequence, provided no meaningful
information for financial statement users to evaluate the robustness of goodwill
impairment testing process. Therefore, these firms were judged to have poor
disclosures and not to comply with the disclosure requirements of HKAS 36.
(5) The sample firms were filtered by audit firm identity, according to the quality of
growth rate disclosure. Data was stratified according to a very similar taxonomy to
that described pertaining to discount rates, i.e. multiple growth rates, single growth
rate, range of growth rates and no effective disclosure. The first category
represented the highest level of disclosure, and the fourth the poorest.
4. Results and discussion
The interest of this research focuses on audit quality variations among auditors based on
the listed firms’ compliance with disclosure requirements relating to goodwill impairment
under HKAS 36. The first question in understanding the process of goodwill impairment
testing is the selection of valuation approach for estimating recoverable amount of assets
assigned to CGUs.
Under HKAS 36, the recoverable amount of an asset or a CGU is the greater of its fair
value less costs to sell, determined basing on market-based evidence, and its value in use,
determined basing on a discounted cash flow model.
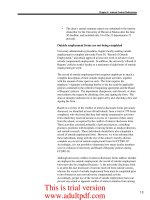
Table II shows the frequency of method used for estimating recoverable amount of an
asset or a CGU, either fair value or value in use or mixed method (combination of the fair
value and value in use), and no effective disclosure in the multi-year data set.
Audit quality
differences
239
JED
21,2
240
Sectors
Fair value
Value in use
Mixed method
No effective disclosure
Total (n)
Proportions of firms where
no effective disclosure (%)
Sectors
Table II.
Methods employed to
determine recoverable
amount of CGUs
Fair value
Value in use
Mixed method
No effective disclosure
Total (n)
Proportions of firms where
no effective disclosure (%)
Deloitte
2nd
time
1
58
3
5
67
3rd
time
2
58
2
1
63
1st
time
1
27
4
1
33
EY
2nd
time
2
42
2
5
51
3rd
time
1
52
1
4
58
1st
time
2
12
–
4
18
2.3
7.5
1.6
3.0
9.8
6.9
22.2
3.2
3.3
1st
time
–
43
1
12
56
PWC
2nd
time
–
61
5
6
72
3rd
time
1
64
4
7
76
3rd
time
1
34
–
2
37
1st
time
3
132
5
21
161
Total
2nd
time
6
213
10
20
249
3rd
time
8
234
7
15
264
21.4
8.3
9.2
5.4
13.0
8.0
5.7
1st
time
–
42
–
1
43
Non-Big 4
1st
2nd
time
time
–
1
8
24
–
–
3
3
11
28
27.3
10.7
KPMG
2nd
time
2
28
–
1
31
3rd
time
3
26
–
1
30
There was little evidence of a substantial variation of using a fair value or value in use
approaches among clients of audit firms in the multi-year data set. Consistent with extant
literature, the approach of value in use dominated in the initial IFRS adoption year and
continued to dominate thereafter in the gradually increasing tendency. On the contrary, the
fair value was applied by the small number of audit firm clients in the multi-year data set in
the slightly increasing change. A small proportion of audit firm clients applied mixed
method, combination of the fair value and value in use approaches, except clients of KPMG
and other auditors.
A slightly falling tendency belongs to audit firm clients that failed to disclose method
used for determining CGU recoverable amount. These clients were judged not to comply
with disclosure requirements of HKAS 36. As a result, impairment testing process was
impossible to be conducted.
Specifically, the non-compliant rates of not disclosing method used for calculating CGU
recoverable amount belonging to clients of Deloitte, EY, PWC were in the fluctuation
manners, whereas the non-compliance levels of not disclosing method belonging to clients of
other audit firms and KPMG were in the decreasing tendency, in general. From this analysis,
it appeared that clients of other auditors have higher levels of non-compliance with
disclosure requirements in comparison with clients of Big 4 auditors, especially Deloitte.
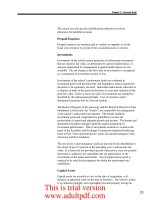
The next analytical procedure employed was to compare the reported value of goodwill on
the consolidated financial statements with the sum of the amounts of goodwill allocated to
defined CGUs of reporting sample firms of audit firms. As set out in Table III, there was evidence
of insignificant variations of using methods among audit firm clients in the multi-year data set.
The majority of firms fully complied with the disclosure requirements in the increasing
manner, from 64 percent of total year sample in the first-year adoption, to about 72 percent
in the second time, and 75 percent in the third time (in case it was possible to have matched
data between value of goodwill on the balance sheet and the sum of goodwill allocated to
CGUs). Only some cases belonging to clients of Deloitte, EY and KPMG that goodwill value
allocated partially to defined CGUs and discrepancies between goodwill value and the sum
of goodwill allocated to CGU were considered to be immaterial.
Meanwhile, a high proportion of audit firm clients provided no information bearing on
the relationship between goodwill values and value of goodwill allocated to defined CGUs.
Sectors
Fully compliant
Ostensibly compliant
Non-compliant
Proportions of firms where no
compliant (%)
Sectors
Fully compliant
Ostensibly compliant
Non-compliant
Proportions of firms where no
compliant (%)
Deloitte
1st
2nd
3rd
time
time
time
37
57
56
–
–
1
6
10
6
1st
time
18
1
14
EY
2nd
time
34
1
16
14.0
14.9
1st
time
32
–
24
42.9
1st
time
10
–
8
KPMG
2nd
time
22
1
8
3rd
time
38
1
19
3rd
time
22
1
7
9.5
42.4
31.4
32.8
44.4
25.8
23.3
PWC
2nd
time
45
–
27
3rd
time
56
–
20
1st
time
6
–
5
Non-Big 4
2nd
time
21
–
7
3rd
time
26
–
11
1st
time
103
1
57
Total
2nd
time
179
2
68
3rd
time
198
3
63
37.5
26.3
45.5
25.0
29.7
35.4
27.3
23.9
Audit quality
differences
241
Table III.
CGU allocation
compliance by
auditors
On the whole sample, proportions of clients where non-compliance with disclosure
requirements were in the decreasing tendency, i.e. 35 percent in the first time, 27 percent in
the second time and 24 percent in the third time.
The non-compliance levels of not showing relationship between goodwill balances and
goodwill allocated to CGUs in the fluctuation manners belong to clients of Deloitte, KPMG
and PWC, in the increasing tendency belong to clients of EY and in the decreasing tendency
involve clients of other audit firms. It appears from the data in Table III that the lowest noncompliance rate belongs to the clients of Deloitte in comparison with remaining audit firm
clients, including other audit firm clients.
The next analysis technique provides more evidence of compliant levels of audit firm
clients bearing on CGU aggregation, which is illustrated in Table IV. The data show the
relationship between the number of CGUs and the number of business segments in the
multi-year data set.
There was evidence of unsubstantial variations of audit firm clients pertaining to the
relationship between the number of CGUs and the number of segments in the time series.
Sectors
Deloitte
EY
KPMG
1st 2nd 3rd 1st 2nd 3rd 1st 2nd 3rd
time time time time time time time time time
6
10
8
2
4
7
2
6
4
12
11
18
2
6
7
5
3
3
21
36
32
17
27
28
3
14
16
4
10
5
12
14
16
8
8
7
CGUWsegments
CGU ¼ segments
CGUosegments
No effective disclosure
Proportion of firms where CGUsosegments or
no effective disclosure (%)
58.1
Sectors
68.7
PWC
1st 2nd
time time
8
8
11
19
17
21
20
24
CGUWsegments
CGU ¼ segments
CGUosegments
No effective disclosure
Proportion of firms where CGUsosegments or
no effective disclosure (%)
66.1
62.5
58.7
87.9
80.4
75.9
61.1
71.0
76.7
Non-Big 4
3rd 1st 2nd 3rd
time time time time
12
0
1
3
16
1
4
4
33
5
16
20
15
5
7
10
Total
1st 2nd 3rd
time time time
18
29
34
31
43
48
63
114 129
49
63
53
63.2
69.6
90.9
82.1
81.1
71.1
68.9
Table IV.
Segments and CGU
aggregation by
auditors
JED
21,2
242
Clearly, the percentages of each year audit firm clients-defined fewer number of CGUs than
the number of segments and provided no effective information pertaining to the number of
CGUs were much higher than that of audit firm clients-defined number of CGUs equal or
higher than the number of segments.
Specifically, the proportion of firms where CGUs lower than segments or no effective
disclosure was in the fluctuation belonging to clients of Deloitte, PWC, and in the increasing
trend involving clients of KPMG, in the decreasing trend belonging to clients of EY and
other audit firms. The data show that clients of other audit firms have highest rates of noncompliance compared to Big 4 audit firms, especially Deloitte. This suggests a higher risk of
CGU aggregation relating to other audit firm clients than that in clients of Big 4 firms,
particularly Deloitte.
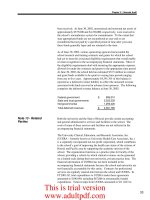
Other technique of analytical procedure is employed for identifying audit firm bearing on
the quality of discount rate disclosure for estimating the CGU-recoverable amount in the
multi-year data set, which is exhibited in Table V. The data show that there was little
evidence of material changes in the various approaches applied by audit firm clients in the
multi-year data set. The dominated method applied pertaining to the discount rate was a
single discount rate for all defined CGUs, even though each CGU has different inherent risk
characteristics, followed by the using of multiple discount rates and the providing no
effective disclosure and range of discount rates.
Overall, a high proportion of audit firm clients reporting no effective disclosure in
relation to discount rate has a falling tendency. The highest level of non-compliance
pertaining to discount rate involves clients of PWC in comparison with remaining audit firm
clients, particularly Deloitte.
The data also show that clients of audit firms employed unusually low discount rate.
Specifically, on the whole discount rate was 1.4 percent in the first-year adoption, 3.8 percent
in the second time and 2.6 percent in the third time. Applying lower mean discount rates in
the model of discounted cash flow would result in overestimating present values
(recoverable amounts), and, consequently, reduce the chance to recognize impairment
expenses in the accounting period, and to increase accounting profit recognized in the
consolidated financial statements.
A scrutiny of data to growth rates employed in the discounted cash flow model for
estimating recoverable amount of each CGU in the multi-year data set. It is striking that the
non-compliant levels of long term growth rate with disclosure requirements were very high,
but in the slightly decreasing tendency, i.e. 73 percent in the first time, 72 percent in the
second time and 67 percent in the third time.
The highest percentage of non-compliance with disclosure requirements pertaining to
growth rate belongs to clients of other auditors in comparison with clients of Big 4 audit
firms, particularly KPMG. By not disclosing long term growth rate, terminal values cannot
be calculated and the accuracy of present values in the model of discounted cash flow is
questionable.
Table VI shows the growth rate employed for testing impairment regime. The average
estimated growth rates employed by other auditor clients were higher than that chosen
by Big 4 auditor clients, particularly Deloitte and EY. By using higher growth rates in
the model of discounted cash flow, other things being equal, would increase the
determined recoverable amount of CGU assets, and reduce the chance of recognizing
goodwill impairment expenses, and increase the possibility of reporting accounting
profit in a given year.
In addition, average estimated forecast horizon chosen by other audit firm clients were
also higher than that selected by Big 4 audit firm clients of audit firms, particularly PWC.
By choosing the average forecast period higher than the stipulated forecast period in the
HKAS 36, justifications have not been pointed by reporting sample clients.
1st time
1
39
2
–
0.0
4.13
15.00
8.65
8.96
1st time
5
23
2
14
31.8
5.00
17.00
10.00
9.85
Sectors
Multiple explicit discount rate
Single explicit discount rate
Range of discount rates
No disclosure
Proportion of firms where no disclosure (%)
Minimum discount rate (%)
Maximum discount rate (%)
Median discount rate (%)
Mean discount rate (%)
Sectors
Multiple explicit discount rate
Single explicit discount rate
Range of discount rates
No disclosure
Proportion of firms where no disclosure (%)
Minimum discount rate (%)
Maximum discount rate (%)
Median discount rate (%)
Mean discount rate (%)
3rd time
11
44
2
3
5.0
5.00
22.36
10.00
11.26
3rd time
8
39
6
15
22.1
2.60
20.00
10.44
10.93
Deloitte
2nd time
7
47
5
2
3.3
3.80
23.50
9.00
9.55
PWC
2nd time
7
34
2
23
34.8
4.50
17.93
10.00
9.77
1st time
–
5
1
2
25.0
5.58
18.00
14.00
11.58
1st time
6
15
2
8
25.8
1.40
18.30
6.50
7.98
Non-Big 4
2nd time
2
18
2
2
8.3
5.50
23.13
11.13
11.20
EY
2nd time
5
31
3
5
11.4
4.00
25.00
9.00
9.56
3rd time
2
27
5
–
0.0
4.68
20.00
10.78
11.48
3rd time
8
36
4
5
9.4
3.10
23.70
10.00
9.68
1st time
15
88
8
26
19.0
1.40
18.30
9.50
9.17
1st time
3
6
1
2
16.7
4.50
17.80
9.93
9.18
3rd time
2
16
3
5
19.2
5.00
25.90
10.88
10.79
Whole sample
2nd time
3rd time
24
31
148
162
14
20
37
28
16.6
11.6
3.80
2.60
25.80
25.90
9.83
10.00
9.84
10.80
KPMG
2nd time
3
18
2
5
17.9
4.20
25.80
9.80
9.96
Audit quality
differences
243
Table V.
Analysis of discount
rates used to test
impairment (value in
use and mixed method
used only)
1st time
3
8
1
32
72.7
0.00
13.00
3.70
4.61
Sectors
Multiple explicit growth rate
Single explicit growth rate
Range of growth rates
No disclosure
Proportion of firms where no disclosure (%)
Minimum growth rate (%)
Maximum growth rate (%)
Median growth rate (%)
Mean growth rate (%)
Table VI.
Analysis of growth
rates used to test
impairment (value in
use and mixed method
used only)
1st time
1
5
–
36
85.7
0.00
6.90
0.00
1.88
Deloitte
2nd time
1
10
1
49
80.3
−1.00
9.00
1.50
2.54
PWC
2nd time
6
9
4
47
71.2
0.00
20.00
2.00
3.47
3rd time
3
14
5
46
67.6
0.00
15.60
3.40
3.99
3rd time
5
11
2
42
70.0
0.00
26.76
2.75
3.40
1st time
–
–
–
8
100.0
n/d
n/d
n/d
n/d
1st time
3
8
–
20
64.5
0.00
10.00
0.00
1.85
EY
2nd time
3
10
1
30
68.2
0.00
14.00
1.25
3.11
Non-Big 4
2nd time
–
5
1
18
75.0
2.00
7.00
4.00
4.30
3rd time
1
8
1
24
70.6
0.00
21.00
3.00
6.13
3rd time
4
16
–
33
62.3
0.00
12.00
3.90
3.29
1st time
9
27
1
100
73.0
0.00
13.00
3.00
3.11
1st time
2
6
–
4
33.3
0.00
6.54
4.65
3.52
KPMG
2nd time
3rd time
3
2
8
7
1
–
16
17
57.1
65.4
0.00
0.50
6.54
8.00
3.03
5.00
3.32
4.94
Whole sample
2nd time
3rd time
13
15
42
56
8
8
160
162
71.7
67.2
−1.00
0.00
20.00
26.76
2.88
3.40
3.25
3.99
244
Sectors
Multiple explicit growth rate
Single explicit growth rate
Range of growth rates
No disclosure
Proportion of firms where no disclosure (%)
Minimum growth rate (%)
Maximum growth rate (%)
Median growth rate (%)
Mean growth rate (%)
JED
21,2
5. Conclusion
This research is conducted for finding evidence which might reveal variations in audit
quality among auditors (Deloitte, EY, KPMG, PWC and other audit firms) in the multi-year
data set. The methodology applied in this study focused on the nature and quality of
disclosures in relation to the goodwill impairment testing process under HKAS 36.
Basing on accumulated evidence obtained from the sample of listed firms in
Hong Kong in three years after HKFRS adoption, including HKAS 36. By testing the basic
disclosure requirements pertaining to goodwill impairment such as method used, CGU
aggregation and specific disclosure requirements in relation to related assumptions such
as variables of discount rates and growth rates in the discounted cash flow model, the
research found that there was systematically non-compliant levels and poor disclosure
quality pertaining to goodwill impairment among clients of auditors in the multi-year data
set after HKFRS adoption.
Taking an overview of the whole sample, variations of non-compliant rates with
disclosure requirements pertaining to goodwill impairment was small and in the
slightly decreasing tendency in the time series. Taking specific audit firm clients in each
year sample, the highest rates of non-compliance with disclosure requirements pertaining
to goodwill impairment stick to clients of other audit firms in comparison with clients of
Big 4 auditors. Out of Big 4 auditors, clients of Deloitte were judged, on the whole, to be
the best practice disclosure bearing on goodwill impairment testing process. There
have been alternative positions of higher levels of non-compliance among clients of
EY, KPMG and PWC.
Apparently, the extent of compliant rates with HKFRS, including HKAS 36, is likely to be
positively related to the probability of detecting and reporting material misstatements in the
accounting system of a company. Variations in disclosure of goodwill impairment of audit
firm clients are likely to be the result of audit quality variations in the multi-year data set.
Based on the falling tendency of non-compliance levels with disclosure quality bearing on
goodwill impairment, audit quality in the following years is judged to be higher than that in
the previous years. Evidence obtained in this research may contribute to the literature by
supporting the proposition that quality of Big 4 auditors is seen to be higher than that of
non-Big 4 audit firms and audit quality among Big 4 auditors is subject to variation.
References
Balvers, R.J., Macdonald, B. and Miller, R.E. (1988), “Underpricing of new issues and the choice of
auditor as a signal of investment banker reputation”, The Accounting Review, Vol. 63 No. 4,
pp. 605-622.
Becker, C.L., Defond, M.L., Jiambalvo, J. and Subramanyam, K.R. (1998), “The effect of audit quality on
earnings management”, Contemporary Accounting Research, Vol. 15 No. 1, pp. 1-24.
Caneghem, T.V. (2004), “The impact of audit quality on earnings rounding-up behaviour: some U.K.
evidence”, European Accounting Review, Vol. 13 No. 4, pp. 771-786.
Carlin, T.M., Finch, N. and Laili, N.H. (2009), “Investigating audit quality among Big 4 malaysian
firms”, Asian Review of Accounting, Vol. 17 No. 2, pp. 96-114.
Copley, P.A., Doucet, M.S. and Gaver, K.M. (1994), “A simultaneous equations analysis of quality
control review outcomes and engagement fees for audit of recipients of federal financial
assistance”, The Accounting Review, Vol. 69 No. 1, pp. 244-256.
Dang, L. (2004), “Assessing actual audit quality”, PhD thesis, Drexel University, PA.
Deangelo, L.E. (1981), “Audit size and audit quality”, Journal of Accounting and Economics, Vol. 3 No. 3,
pp. 183-199.
Defond, M.L. and Jiambalvo, J. (1991), “Incidence and circumstances of accounting errors”, The
Accounting Review, Vol. 66 No. 3, pp. 643-655.
Audit quality
differences
245
JED
21,2
246
Eisenberg, T. and Macey, J.R. (2003), “Was Arthur Andersen different? An empirical examination of
major accounting firms’ audits of large clients”, Journal of Empirical Legal Studies, Vol. 1,
pp. 263-300.
Firth, M. and Smith, A. (1992), “Selection of auditor firms by companies in the new issue market”,
Applied Economics, Vol. 24 No. 2, pp. 247-255.
Fuerman, R.D. (2004), “Audit quality examined one large CPA firm at a time: mid-1990s empirical
evidence of a precursor of Arthur Andersen’s collapse”, Corporate Ownership and Control, Vol. 2
No. 1, pp. 137-148.
Hoogendoorn, M. (2006), “International accounting regulation and IFRS implementation in Europe and
beyond – experiences with first-time adoption in Europe”, Accounting in Europe, Vol. 3 No. 1,
pp. 23-26.
Kit, F.Y. (2005), Evidence of Audit Quality Differences among Big Five Auditors: An Empirical Study,
City University of Hong Kong, Kowloon Tong.
Krishnan, J. and Schauer, P.C. (2000), “The differentiation of quality among auditors: evidence from the
not-for-profit sector”, Auditing: A Journal of Practice and Theory, Vol. 19 No. 2, pp. 9-25.
Moize, P. (1997), “Auditor reputation: the international empirical evidence”, International Journal of
Auditing, Vol. 1 No. 1, pp. 61-74.
Palmrose, Z.-V. (1988), “An analysis of auditor litigation and audit service quality”, The Accounting
Review, Vol. 63 No. 1, pp. 55-73.
Simunic, D.A. (2003), Audit Quality and Audit Firm Size: Revisited, The University of Bristish Columbia,
Vancouver.
Corresponding author
Manh Dung Tran can be contacted at:
For instructions on how to order reprints of this article, please visit our website:
www.emeraldgrouppublishing.com/licensing/reprints.htm
Or contact us for further details: