Báo cáo y học: "Autofluorescent Proteins as Photosensitizer in Eukaryonte"
Bạn đang xem bản rút gọn của tài liệu. Xem và tải ngay bản đầy đủ của tài liệu tại đây (3.39 MB, 9 trang )
Int. J. Med. Sci. 2009, 6
365
I
I
n
n
t
t
e
e
r
r
n
n
a
a
t
t
i
i
o
o
n
n
a
a
l
l
J
J
o
o
u
u
r
r
n
n
a
a
l
l
o
o
f
f
M
M
e
e
d
d
i
i
c
c
a
a
l
l
S
S
c
c
i
i
e
e
n
n
c
c
e
e
s
s
2009; 6(6):365-373
© Ivyspring International Publisher. All rights reserved
Research Paper
Autofluorescent Proteins as Photosensitizer in Eukaryontes
Waldemar Waldeck
1
, Gabriele Mueller
1
, Manfred Wiessler
2
, Manuela Brom
3
, Katalin Tóth
1
and Klaus Braun
2
1. German Cancer Research Center, Dept. of Biophysics of Macromolecules, INF 580, D-69120 Heidelberg, Germany
2. German Cancer Research Center, Dept. of Medical Physics in Radiology, INF 280, D-69120 Heidelberg, Germany
3. German Cancer Research Center, Core Facility Light Microscopy, INF 581, D-69120 Heidelberg, Germany
Correspondence to: Dr. Klaus Braun, German Cancer Research Center (DKFZ), Dept. of Medical Physics in Radiology, Im
Neuenheimer Feld 280, D-69120 Heidelberg, Germany. Tel: +49 6221 42 2495; Fax: +49 6221 42 3326.
Received: 2009.09.10; Accepted: 2009.11.25; Published: 2009.12.01
Abstract
Since the discovery of the green fluorescent green protein (GFP) in 1961 many variants of
fluorescent proteins (FP) were detected. The importance was underlined by the Nobel price
award in chemistry 2008 for the invention, application, and development of the GFP by
Shimomura, Chalfie and Tsien. GFP, first described by Shimomura now is indispensible in the
scientific daily life.
Since then and also in future fluorescent proteins will lead to new applications as reporters
in cell biology. Such FPs can absorb visible day-light and predominantly one variant of the red
fluorescent protein, the KillerRed protein (KRED) emits active electrons producing reactive
oxygen species (ROS) leading to photokilling processes in eukaryotes. KRED can be acti-
vated by daylight as a photosensitizing agent. It is quite obvious that the KRED’s expression
and localization is critical with respect to damage, mutation and finally killing of eukaryotic
cells. We found evidence that the KRED’s cytotoxicity is ascendantly location-dependent
from the cell membrane over the nuclear lamina to the chromatin in the cell nucleus. Day-
light illumination of cells harbouring the KRED protein fused with the histone H2A, a
DNA-binding protein which is critical for the formation of the chromatin structure results in
cell killing. Therefore the H2A-KRED fusion protein can be considered as an appropriate
candidate for the photodynamic therapy (PDT). This finding can be transferred to current
photodynamic approaches and can enhance their therapeutic outcome.
Key words: Melanoma; fluorescent Proteins; KillerRed; Photo-Dynamic-Therapy (PDT); ROS; Skin
Tumors; subcellular Localization; topical Application
Introduction
Without doubt oxygen is considered as a pivotal
element for the existence of aerobic life on earth. But
in the last forty years, evidences indicated increas-
ingly Janus-faced behaviors of this element
1-3
for the
following reasons: Under certain conditions, oxygen
may produce reactive species, even free radicals re-
sponsible for different molecular cell response like
cellular stress
4,5
. Despite all undesired consequences
provoked by these oxygen’s properties, these facts
were not yet in the focus of the scientific discussion
and still poorly understood during the last few years
as illustrated comprehensively
6
. The paradox of the
oxygen atom depending on its peculiar electronic
structure is the existence as a free radical, because the
outer valence shell contains one unpaired electron.
After combining two oxygen atoms to form molecular
oxygen no formation of a spin-pair is possible and
resulting in a formation of a bi-radical which allows a
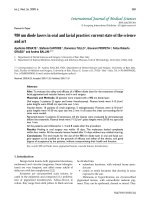
stepwise one electron reduction as depicted in Figure
1
. Up to this point it’s just a non-enzymatic pathway
Int. J. Med. Sci. 2009, 6
366
of oxygen reduction results in the generation of dif-
ferent highly reactive intermediates referred as reac-
tive oxygen species (ROS).
Additionally, reactive nitrogen species, such as
nitric oxide and peroxynitrite, are biologically rele-
vant O
2
derivatives increasingly being recognized as
important in vascular biology potential
7
. Starting with
O
2
the first one-electron reduction leads to the super-
oxide anion radical formation (
•
O
2
-
). After addition of
an electron and two protons the highly active species
hydrogen peroxide is built. The addition of a further
electron results in the hydroxyl radical formation si-
multaneously releasing a hydroxide anion. The fourth
electron addition produces a water molecule. This
indicates the role of oxygen as a basis in collecting
electrons
8
.
2 O
2
.
H
2
O
2
H
2
O
O
2
+
ROS
[Ca
2+
]
Activation of
Transcription Factors
AP-1; NFkB
MMPs
Increase of DISULFIDE potential
Activation of
Transcription Factors
Activated PTP
Inactivated PTP
Contraction
Migration
Inflammation
ECM
Cell Growth
Apoptosis
Survival
2 O
2
e
-
e
-
2 H
Figure 1 The figure exemplifies the generation of ROS
and their influence on downstream targets in vascular cells.
ROS influence a multifaced range of cellular activities e.g. of
protein tyrosine phosphatases (PTP). ROS influence gene
and protein expression by activating transcription factors,
such as NFκB and AP-1. ROS stimulate Ca
2+
channels
leading to increased [Ca
2+
]. ROS influence matrix metallo-
proteinases (MMPs), modulating extracellular matrix pro-
tein (ECM) degradation.
(Modified according to Touyz and
Filomeni) [Touyz, R. M. Antioxid. Redox. Signal. 2005, 7
(9-10), 1302-1314; Filomeni, G.; et al. Biochem. Pharmacol.
2002, 64 (5-6), 1057-1064].
A look behind the origination of aerobic life and
the impact of the oxygen could contribute to a better
understanding of the oxygen paradox. Despite all
barren and hostile circumstances, the aerobic life on
earth began under simultaneous evolution of efficient
anti ROS-weapon systems like antioxidants and
scavengers by which all creatures are extensively en-
dowed. The intracellular redox state is determined by
the contribution of different redox couples, at which
each couple can exchange electrons in such a way
that, by giving or accepting reducing equivalents,
may represent cofactors in redox enzymatic reactions.
Furthermore, the activator protein 1 (AP-1) the nu-
clear factor-κB (NF-κB) and protein tyrosine phos-
phatases (PTPs) are considered as excellent examples,
as illustrated in Figure 1
9
. The consequences of oxy-
gen activation in human bodies are indeed increas-
ingly observed but only partly recognized, in spite of
extensive scientific research on theoretical, experi-
mental and clinical domains
10
.
In contrast to the prokaryotes the impact of "re-
active oxygen species" on the behavior of eukaryotes
seems to be better investigated, as shown by searching
on the NCBI database PubMed from 07 10 2009. Using
the search terms like “eukaryotes” and "reactive oxygen
species" cited 1993 for the first time until today, 142
hits were found which it’s not very extensive. Espe-
cially the fact that 44 articles thereof were published
in the last two years suggests an increased scientific
interest on pharmacologically inactive molecules
which are converted after activation by daylight to
photosensitizing agents and which are able to dam-
age, mutate and finally kill eukaryotic cells.
It is documented that fluorescent compounds
which absorb daylight around 500 to 700 nm can emit
active electrons producing ROS
11
which in turn in-
duce cell killing of prokaryotic cells.
Fluorescent proteins (FPs)
12
stand for a group of
ROS producers. They are originally represented by
green fluorescent protein (EGFP)
12
which is consid-
ered as a promising source of excellent tools for suc-
cessful live-cell imaging
13
. Indeed hampering features
like quenching effects which can change the EGFP’s
fluorescent properties were observed
14,15
. Addition-
ally an oxidant-induced cell death in yeast and in
saccharomyces cerevisiae is documented
16,17
. In com-
parison, in case of radical or reactive oxygen forma-
tion, the amount of data investigations about pro-
karyotes and eucaryotes expressing FPs is still mod-
erate. Further investigations of the impact of ROS on
the acceleration of cellular aging initiated by cellular
stress should be extendet to healthy and neoplastic
eukaryotes. To investigate ROS influence on cells, we
expressed the fluorescent KillerRed (KRED) protein
18
from stably transfected plasmids (described in the
methods part) in the human HeLa cervix carcinoma,
and the human DU145 prostate cancer cell lines.
Our plasmids coding for this red protein contain
the sequence of the hydrozoan chromoprotein
anm2CP gene (GenBank, accession number AY485336)
originating from an Anthomedusa, which transcribes
and translates the KillerRed protein (KRED)
19
. As
shown in the literature this KillerRed protein is sup-
posed to produce enough ROS to kill half of the
transfected human kidney cells, after 10 minutes il-
Int. J. Med. Sci. 2009, 6
367
lumination. Localizing the KRED protein to mito-
chondria resulted in an increased cytotoxic efficiency
with the greatest extent after 45 minutes
20
.
This KRED protein, comprehensively described
by the Bulina and Lukyanov groups, is exemplified as
the first genetically encoded photosensitizer
18
.
Our intention was to find out whether FPs with
different light absorption properties reveal the same
ROS producing capacity and looked for a dependency
of their intracellular localizations.
Therefore we carried out cell death studies by
FP-imaging where the reporter proteins were placed
on different intracellular structural locations. We ob-
served in HeLa cervix carcinoma and DU 145 human
prostate cancer cells stably expressing KRED day-
light-induced cell toxicity with the confocal laser
scanning microscopy (CLSM).
Cell toxic effects caused by KRED after white
light exposition are already documented in eukaryo-
tes
20
but data concerning the different damaging sen-
sitivity to visible light depending on the location of
the reporter remain to be answered. Our data indicate
different FP’s toxicity, depending on its intracellular
localization.
Material & Methods
Plasmid vectors constructions
For the investigation of the subcellular localiza-
tion dependant cell toxicity FP-induced we used the
following purchasable and recombined fu-
sion-vectors. As a reference the pEGFP vector was
used (Figure 2).
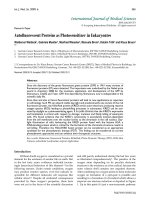
a) pEGFP vector
Figure 2 The figure displays the physical map of the
pEGFP a red-shifted variant of the WT GFP optimized for
higher fluorescence and higher expression in mammalian
cells. GenBank Acc. No.: #U55762. (Details see Clontech
user manual
vectors/PT3027-5.pdf)
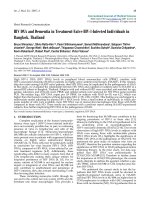
b) pKillerRed vector - Free KRED protein
Figure 3 This physical map shows the body of the
pKillerRed mammalian expression vector encoding the red
fluorescent protein KillerRed alone in eukaryotic (mam-
malian) cells (Evrogen FP961; GenBank Acc. No.:
AY969116). (Details see Evrogen user manual
/>lated_products.shtml)
c) pKillerRed-mem vector - Membrane-located KRED
protein
Figure 4 The figure illustrates the pKillerRed-mem a
mammalian expression vector which encodes mem-
brane-targeted KillerRed (Cat. No.: #FP966). (Details see
Evrogen user manual
/>lated_products.shtml) shows the mem sequence.
Int. J. Med. Sci. 2009, 6
368
d) pKillerRed Lamin B1 vector - Lamin B1-localized
KRED protein
Figure 5 Physical map of the vector expressing the fusion
protein KRED-Lamin B1. The Lamin B1 was inserted
into the MCS. (The Lamin B1 sequence was kindly provided
by Harald Herrmann, this institute)
e) pH2A Histone-KillerRed vector - Histone
H2A-localized KRED protein
Figure 6 Physical map of the vector expressing the his-
tone fusion protein H2A-KRED. The histone H2A was
inserted into the MCS.
Transfection
HeLa cervix carcinoma and DU 145 human
prostate cancer cells were transfected with plasmids
expressing differently coloured autofluorescent pro-
teins according to the Fugen HD’s user manual
(Roche, Germany). Stable transformations with the
mentioned plasmid constructs were generated over
weeks by selection pressure in cell culture with 500
µg/ml G-418 (Geneticin) final concentration. Clones
were picked, cultured and used in the experiments.
Cell culture
Cell clones were cultured and maintained in
RPMI medium (Gibco, USA) supplemented with FCS
10% (Biochrom, Germany) and L-glutamin 200 mM
(Biochrom, Germany) at 37°C in a humid 5% CO
2
at-
mosphere. The cultures were visibly green, yellow or
red. Near confluency, the cells were washed with
HBSS (Hank’s balanced salt concentration, PAN,
Germany). After trypsinization (0.5%) the cells were
harvested in RPMI with 2% FCS and centrifuged (800
U/ min, 5 minutes; Hereaus, Germany). After resus-
pension of the cell pellet in HBSS the cell number was
adjusted with HBSS to 1 × 10
6
cells × ml
-1
for further
experiments.
Illumination of the KRED expressing cells
HeLa and DU 145 cells, grown in RPMI-medium
were transferred to quartz cuvettes (HELLMA, Ger-
many). These cuvettes were placed under one
full-spectrum sunlight bulb with 32 Watt
(www.androv-medical.de) in a distance of 1 cm.
The illumination took place at room tempera-
ture; the quartz cuvettes were placed on an alumin-
ium block, cooled by a fan to keep the room tem-
perature. The 32 Watt bulb has a measured intensity
of 20.000 lux in a 1cm distance, which reflects a nor-
mal daylight in a cloudy summer
21
. We used the fol-
lowing time points: 15, 30, 60, 90, 120, and 180 minutes
for the measurements of the clones. Transfected cells
were examined under identical conditions, controls
were measured without illumination.
Subcellular localization of the FPs by confocal
laser scanning microscopy (CLSM)
To perform confocal laser scanning microscopic
(CLSM) studies, DU 145 and HeLa cells (2 × 10
4
) were
seeded into chambered cover class (Nunc 8-Well,
Lab-Tek™) for microscopic inspection. Next day, the
cells were transfected with Fugen HD as described
above and incubated at 37°C in a 5 % CO
2
atmosphere.
The pictures were taken 24 h later directly, without
washing, to demonstrate intracellular localization and
distribution of the fluorescent proteins and fusion
proteins (FPs) as well as the apoptotic and dead cells
using a Leica TCS SP5 microscope. The optical slice
thickness was 700 nm. The excitation wave-length of
543 nm was used to detect fluorescence signals
(553-670 nm with a maximum at 610 nm). To increase
the contrast of the optical sections, 12–20 single ex-
posures were averaged. The image acquisition pa-
rameters were adapted to show signal intensities in
accordance with the visible microscopic image.
Int. J. Med. Sci. 2009, 6
369
Results & Discussion
It is well known that ROS is able to damage and
finally kill cells. Our first intention was to clarify
whether different FPs producing different amounts of
ROS kill the host cells after illumination with normal
daylight. Using the proteins (Green and Yellow or
Red which achieved the maximal cell killing) we in-
tended to investigate the influence of the intracellular
localization on this cell killing effect. Therefore we
first compared the survival of EGFP, EYFP, KRED
expressing HeLa cells after illumination with white
light. In this first attempt the cell survival was related
to the tested FPs. The graphs indicate a different de-
crease of the cell number (cell tightness) expressed as
a percentage depending on the time course of the il-
lumination (Figure 7), also shown in Table 2 as
counted colo
nies. The amount of HeLa cells stably
transfected with pEGFP showed a slight decrease
from 158 to 148 after 120 min illumination; during the
illumination time up to 120 min the cell number was
consistent with the control’s cell number. The HeLa
cells transfected with pEYFP featured a higher sensi-
tivity against daylight illumination. Already a de-
crease from 162 cells after 30 minutes illumination
time to 121 cells after 180 minutes illumination was
observed. HeLa cells transfected with pKRED exhib-
ited a clear linear decrease of the cell number from 155
to 103 from 30 up to 180 minutes illumination time
course.
Figure 7 The graph demonstrates the influence of the
illumination time on the cellular phenotype and displays the
relative number of morphologically intact HeLa cells.
Table 1 All cells with the different FPs were illuminated for
the given time periods and counted. The control is set to
100%.
0 30 60 90 120 180 [min]
165 165 165 165 165 165 Control
165 167 163 164 158 148 HeLa - EGFP
162 161 156 143 143 121 HeLa - EYFP
155 150 138 126 119 103 HeLa - KRED
In the next experiments we focused on the in-
fluence of the intracellular localization of KRED.
The quantitative difference maybe influenced by
differences in the absorptions coefficients, spectral
inhomogeneity of the incident light or in different
ROS building capacities and should be subject of fur-
ther investigations. Here we investigated the cytotox-
icity of the photodynamic effects caused by KillerRed
and especially by its fusion proteins like the
KRED-mem (Figure 8) locating the FPs to membrane,
the KRED-L
amin B1 (Figure 9) variant with location
to the nuc
lear surrounding lamin structure, and the
histone H2A-KRED located in the chromatin structure
(Figure 10). The CLSM pictures show clearly the de-
tected KRED.
For a time course in cell killing we used HeLa
and DU 145 cells both stably transfected with the
above mentioned protein expressing KRED con-
structs. Cell survival was calculated by the decrease of
the cell number expressing different FPs after illumi-
nation for increasing time periods measured. The
current cell numbers are listed in Figure 11 and in
Table 2.
Table 2
The percentage value corresponding to the cell
numbers of the different cell lines is exhibited.
0 30 60 90 120 180 [min]
160 160 160 160 160 160 DU 145 Control
160 160 160 160 160 160 HeLa Control
165 163 154 143 138 122 DU 145-KRED-mem
158 131 120 93 81 71 HeLa-KRED-mem
155 150 138 126 119 103 DU 145-KRED-Lamin
160 149 137 121 125 98 HeLa-KRED-Lamin
158 Incapable to measure DU 145-H2A-KRED
160 Incapable to measure HeLa-H2A-KRED
In Table 2 the impact of the local position of
KRED on th
e viability of two different eukaryotic
tumor cell lines HeLa and DU 145 is described. Values
for cell lines with histone H2A-KRED are missing.