Study of elemental depth distribution in the material TiO2/SiO2/Si by rutherford backscattering spectrometry (RBS)
Bạn đang xem bản rút gọn của tài liệu. Xem và tải ngay bản đầy đủ của tài liệu tại đây (2.52 MB, 8 trang )
Communications in Physics, Vol. 29, No. 3SI (2019), pp. 393-400
DOI:10.15625/0868-3166/29/3SI/14328
STUDY OF ELEMENTAL DEPTH DISTRIBUTION IN THE MATERIAL
TiO2 /SiO2 /Si BY RUTHERFORD BACKSCATTERING SPECTROMETRY
(RBS)
T. V. PHUC1,2,3,† , M. KULIK3,4 , A. P. KOBZEV3 AND L. H. KHIEM1
1 Institute
of Physics, Vietnam Academy of Science and Technology, Hanoi, Vietnam
University of Science and Technology, Vietnam Academy of Science and Technology,
Hanoi, Vietnam
3 Frank Laboratory of Neutron Physics, Joint Institute for Nuclear Research, Dubna, Russia
4 Institute of Physics, Maria Curie-Skłodowska University, Lublin, Poland
2 Graduate
† E-mail:
Received 22 August 2019
Accepted for publication 28 September 2019
Published 15 October 2019
Abstract. In this study we investigated depth distributions of elements in the multilayer structures
of TiO2 /SiO2 /Si before and after ion irradiation. The samples were implanted with Ne+ , Ar+ ,
Kr+ and Xe+ ions. For each implantation the multilayer structures were irradiated by the ions
with energies of 100, 150, 200 and 250 keV. The elemental concentrations in the samples were
analyzed by the Rutherford Backscattering Spectrometry (RBS) method. It was found that the
transition layers existed between the TiO2 and SiO2 layers. Formation of these layers derived from
the ion beam mixing that was occurred at TiO2 /SiO2 interface after irradiation process. The depth
profiles show that thickness of the transition layers increased with the growing energy and atomic
mass of the implanted ions.
Keywords: Rutherford Backscattering Spectrometry (RBS), Multilayer structures.
Classification numbers: 68.49.Sf; 61.72.Ww; 68.65.Ac. .
I. INTRODUCTION
Implantation is the most typical application of ion beams in materials modification, this
technology is widely used for doping of semiconductors as well as for the synthesis of buried
compound layers. It is not only the implanted atom modifies the material, but also the energy
deposited into the solid may result in significant changes. Ion beam mixing is one well known
c 2019 Vietnam Academy of Science and Technology
394
STUDY OF ELEMENTAL DEPTH DISTRIBUTION IN THE MATERIAL . . .
example of such effect. This phenomenon is the interaction of ions with target atoms that takes
place at the interface separating two different materials. During this process the target atoms can
be displaced from their lattice sites and relocated to the new positions if they were bombarded by
the ions with high enough energy. The atomic displacements caused by ion produce the collision
cascade effects and lead to the formation of transitional areas which may significantly influence to
material structure and their properties. Therefore, analyzing the effects induced by ion beam on
the interface modification has become an important research area and attracted the attention of a
lot of research on various materials by different methods [1–4].
Among various photocatalysis, TiO2 is one of the most studied materials due to its advantages such as large chemical stability, avirulence and strong photo-induced oxidation. TiO2 as a
photocatalyst has been widely applied in the environmental and energy fields, such as self-cleaning
surfaces, air and water purification systems, sterilization, gas sensor, hydrogen evolution and dyesensitized solar cell [5–10]. However, TiO2 has large band gaps at 3.2 eV, 3.02 eV and 2.96 eV
for the anatase, rutile and brookite phases, respectively [11]. So that photocatalytic effects are
restricted only for the ultraviolet region of the light spectrum. In recent years, numerous studies
have shown that TiO2 supported on SiO2 exhibits an enhanced photocatalytic activity that makes
TiO2 /SiO2 particularly attractive for catalytic application [12-14]. In this work, the modification
at interfaces of TiO2 /SiO2 /Si structures after implantation as a function of energy and atomic mass
of the implanted ions using RBS method will be presented.
II. EXPERIMENT
RBS is the nuclear analytical method widely applied for the near surface layer of solid characterization. This method allows to determine composition, concentration and depth distribution
of the elements that exist in the studied samples based on the basic concept of the elastic collision
such as kinematic factor, scattering cross-section and the energy loss of particles. The wide use
of RBS is due to its high sensitivity (typically in ppm for heavy elements and few at.% for the
light elements ). Depth profiles of the elements in studied samples can be calculated on the RBS
spectra, with a great depth resolution in nanometer range RBS is not only used for thin monolayer analysis but also for investigation of the multi-layer structures and the interface between the
materials [15].
In this study there were two groups of studied samples of similar structures of TiO2 /SiO2 /Si,
the thickness of TiO2 and SiO2 layers of the samples in the second group was smaller than that
in the first group. Each group included 4 subgroups of samples implanted with four different
noble ions Ne+ , Ar+ , Kr+ and Xe+ . There were
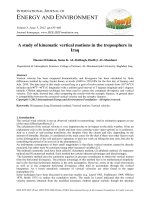
four samples in each subgroup that were irradiated by the same species of ion with different enFig. 1. The experimental set-up of RBS
ergies of 100, 150, 200 and 250 keV. Ion implanmethods. α is the angle between direction
tation process was performed on the UNIMAS ion
of incident beam and the normal of sample surface, θ is the backscattering angle
implanter being at the disposal of Maria Curieof ions after collisions.
Skłodowska University [16]. For each implantation, fluency of the incident ion beam was the
T. V. PHUC et al.
395
same at 3 × 10⁶ (ions/cm2 ), the beams were perpendicular to surface normal of the samples. Depth
distribution of elements in the samples before and after irradiation was investigated using the RBS
method. The RBS experiments were carried out on the EG-5 accelerator at the Frank Laboratory
of Neutron Physics, JINR [17]. He+ ion beam with the energy of 1.5 MeV was used, the beam
was directed to the samples under the incident angle α = 60˚ towards the normal of the sample
surface. The RBS spectra were collected at the scattering angle α = 170˚ (Fig. 1) with energy
resolution of spectrometric measurements was 15 keV. The elemental composition, their content
and depth distribution were calculated using the SIMNRA code [18].
III. RESULTS AND DISCUSSION
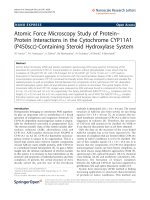
Figure 2 shows the typical RBS spectra collected from the samples in the first group before
and after implantation with Ne+ ions at different energies of 100, 150, 200 and 250 keV. In these
figures the vertical and slanted arrows indicate He+ ions backscattered on the nucleons of the
elements in the surface and in the sublayers respectively. There were the new peaks near the energy
550 keV associated with the presence of Ne+ ions in the samples after implantation. The significant
reduction in the yields was found at the energy range related with O and Si for all spectra after
irradiation. This effect corresponds to the presence of the doping ions result in decrease of O and
Si concentration.
Energy of Ne
ions [keV]
Ne
15
SiCrystalline substrate
SiSilicon oxide layer
Yield/1000 [Counts]
O
+
Ti Titanium oxide layer 10
250
200
150
100
Virgin
5
a)
0
400
600
800 1000 1200
Energy of incident ions [keV]
En
er g
y[
ke
V]
250
200
150
100
Virgin
Fig. 2. The RBS spectra collected from the samples in the first group that were virgin
and implanted with Ne+ ions at the different energies 100, 150, 200 and 250 keV.
It was observed that the left edges of the peaks related to Ti atoms which indicate for
Ti at the interface of TiO2 /SiO2 were shifted to both higher and lower energy range when the
energy of incident ions were increased. In most cases, the edges shifted to the lower energy due
to displacement of Ti atoms into the SiO2 layers. Shifting of the edges to higher energy range
can be explained by sputtering phenomenon. Besides that, shifting of the borders related with
Si atoms to the higher energy was observed as well. This was associated with the displacement
of Si atoms in the SiO2 layers toward the TiO2 layers through the interface. All of these effects
STUDY OF ELEMENTAL DEPTH DISTRIBUTION IN THE MATERIAL . . .
15
SiCrystalline substrate
O
SiSilicon oxide layer
+
Energy of Kr
ions [keV]
10
Ti Titanium oxide layer
250
200
150
100
Virgin
Kr
5
c)
Yield/1000 [Counts]
396
0
En
er
gy
[k
eV
]
250
200
150
100
Virgin
400
600
800
1000
1200
Energy of incident ions [keV]
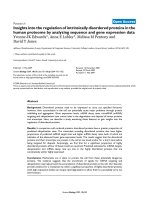
Fig. 3. The RBS spectra collected from the samples in the second group that were virgin
and implanted with Kr+ ions at the different energies 100, 150, 200 and 250 keV.
indicate to displacement of Ti and Si atoms at interface into the neighbor layers that made the real
thickness of TiO2 and SiO2 layers reduced. Moving of the displacements atoms leaded to forming
of the transition area, when the ions energy was increased the thickness of TiO2 and SiO2 layers
decrease results in broadening of the transition areas between these materials. The similar effects
were also observed in the cases that the samples implanted with Ar+ , Kr+ and Xe+ ions.
The RBS spectra collected from samples in the second group that were virgin and implanted
with Kr+ ions are shown in Fig. 3. It was observed that these spectra possess the effects similar
with cases the samples implanted by Ne+ , Ar+ , Xe+ such as reducing of the bounds, appearance
of new peaks and shifting of the borders after implantation. These effects were also observed in
the spectra collected from the samples in the first group. However, there was significant difference
in degree of changes between two groups of samples due to the difference in thickness of TiO2
and SiO2 layers.
By using SIMNRA code, the noticeable changes in the thickness of near-surface layers of
the samples in both groups were determined. The relative changing thickness of the layers before
and after ion irradiation were described by the equation (1). Since the atomic density of the layers
was not known exactly, it was impossible to transform units of thickness from the atomic density
into a nanometer scale. The thickness of the layers in the samples therefore was determined by the
SIMNRA code with the unit of atoms/cm2 , as follows
tim − tvir
rt =
,
(1)
tvir
where tr is the relative changing thickness of the layers,
tim is the thickness of the layers after implantation,
tvir is the thickness of the layers in the virgin samples before implantation.
The relative changing thickness rt for the TiO2 , transition and SiO2 layers of the samples
in the first group that were implanted with Ne+ , Ar+ Kr+ and Xe+ ions are shown in Figs. 4a,
T. V. PHUC et al.
397
a)
TiO2
Transition layer
SiO2
0.2
0.1
0.0
-0.1
100
150
200
Energy [keV]
TiO2
Transition layer
SiO2
0.6
0.4
250
c)
0.2
0.0
-0.2
100
150
200
Energy [keV]
250
Relative changing of thickness [a.u]
0.3
Relative changing of thickness [a.u]
Relative changing of thickness [a.u]
Relative changing of thickness [a.u]
4b, 4c and 4d, respectively. It was observed that the thickness of TiO2 and SiO2 layers decreased,
accompanied by an increase thickness of transition layers when the energy of implanted ions was
increased. This effect can be explained by growing of displacement atoms in the mixing area when
the ion energies get higher. Appearance of disorders made the transition area expanded and led to
the narrowing of TiO2 and SiO2 layers. The similar situations were observed in all cases when the
samples were implanted with Ne+ , Ar+ Kr+ and Xe+ ions. However, degree of changing thickness
of transition layers increased respectively due to the fact that the atomic mass of implanted ions
got heavier. In the case of the samples implanted with Ar+ and Xe+ ions, although rising up of the
fitting lines indicates to SiO2 layers can be seen, it is evident that the whole of this lines located
in the negative values of the vertical axis. This effect shows that the thickness of the SiO2 layers
decrease more than that of the virgin samples but with a declining degree when the ion energy
grown.
b)
TiO2
0.2
Transition layer
SiO2
0.0
-0.2
-0.4
100
0.4
0.3
150
200
Energy [keV]
250
d)
TiO2
Transition layer
SiO2
0.2
0.1
0.0
-0.1
100
150
200
Energy [keV]
250
Fig. 4. Relatively changing thickness of TiO2 , transition and SiO2 layers of two samples
in the first group that were implanted with Ne+ (a), Ar+ (b), Kr+ (c) and Xe+ (d) ions.
In order to investigate changes of the layers with different thicknesses after ion irradiation,
the samples in the second group were measured. For this group, thickness of TiO2 and SiO2 layers
398
STUDY OF ELEMENTAL DEPTH DISTRIBUTION IN THE MATERIAL . . .
TiO2
0.4
Trasition layer
SiO2
a)
0.2
0.0
-0.2
100
150
200
Energy [keV]
c)
TiO2
0.6
250
Transition layer
SiO2
0.4
0.2
0.0
-0.2
100
150
200
Energy [keV]
250
Relative changing of thickness [a.u]
0.6
Relative changing of thickness [a.u]
Relative changing of thickness [a.u]
Relative changing of thickness [a.u]
of the samples was lower than that of the samples in the first group. The relative changing thickness
of the layers as a function of energy of the noble ions Ne+ Ar+ , Kr+ and Xe+ is shown in Figs.5a,
5b, 5c and 5d, respectively. The variation thickness of the layers of the samples in the second group
was similar with the first group. It was also observed that thickness of TiO2 and SiO2 decreased
while that of transition layer increased with the growing implanted ion energy. However, in the
case samples in both groups were implanted with the same type of ion, the thickness of transition
layers of the samples in the second group was increased more than that of the first group. This
effect can be explained by energy loss of the ions penetrating in thin TiO2 films of samples in the
second group less than the ions moving through the thick TiO2 layers of the samples in the first
group. Thus, the remaining higher energy created more disorders at the transition area between
the TiO2 and SiO2 layers.
TiO2
Transition layer
SiO2
0.3
0.2
b)
0.1
0.0
-0.1
-0.2
100
150
200
Energy [keV]
250
d)
TiO2
Transition layer
TiO2
1.5
1.0
0.5
0.0
-0.5
100
150
200
250
Energy [keV]
Fig. 5. Relatively changing thickness of TiO2 , transition and SiO2 layers of two samples
in the second group that were implanted with Ne+ (a), Ar+ (b), Kr+ (c) and Xe+ (d) ions.
Figure 6 shows the relative changing thickness of TiO2 (a) transition (b) and SiO2 (c) layers
of the samples in the first group as a function of the atomic mass of the irradiated ion at different
T. V. PHUC et al.
399
100
150
200
250
0.0
-0.1
-0.2
-0.3
20
40 60 80 100 120 140
Atomic mass [amu]
0.6
100
150
200
250
0.5
0.4
0.3
0.2
0.1
0.0
20
40 60 80 100 120 140
Atomic mass [amu]
Relative changing of thickness [a.u]
0.1
Relative changing of thickness [a.u]
Relative changing of thickness [a.u]
energies. It can be seen that the thickness of the TiO2 layer tends to decrease when the ion mass
got heavier. However, the relation was not linear like the relative change of thickness as a function
of energies. Thickness of TiO2 layer decreased slightly in the case the samples were implanted
with Ne+ , Ar+ and Xe+ ions, the variation was greatest in the cases of Kr+ implantation. The
growing of atomic mass of ions made more disorders in samples and resulted in an increase in
thickness of transition layers. The thickness of transition layers increased slightly in the case of
Ne+ and Ar+ ions irradiation, reached the greatest changes with the Kr+ ions and reduced degree
when the samples was implanted with Xe+ . For SiO2 layers the thickness was almost stable when
the samples were irradiated with Ne+ and Xe+ ions, decreased slightly with Kr+ , and reached the
largest drop in the case of Ar+ implantation.
0.1
0.0
-0.1
100
150
200
250
-0.2
-0.3
-0.4
-0.5
20
40 60 80 100 120 140
Atomic mass [amu]
Fig. 6. The relative changing thickness of TiO2 (a) transition (b) and SiO2 (c) layers of
the samples in the first group as a function of the atomic mass of the irradiated ions with
different energies.
100
150
200
250
-0.05
-0.10
-0.15
-0.20
-0.25
20 40 60 80 100 120 140
Atomic mass [amu]
1.5
1.0
100
150
200
250
0.5
0.0
20 40 60 80 100 120 140
Atomic mass [amu]
Relative changing of thickness [a.u]
0.00
Relative changing of thickness [a.u]
Relative changing of thickness [a.u]
The relative change of the thickness of TiO2 , transition and SiO2 layers as a function of the
atomic mass of the irradiated ions with different energies for the samples in the second group can
be seen in Fig. 7.
0.05
100
150
200
250
0.00
-0.05
-0.10
20 40 60 80 100 120 140
Atomic mass [amu]
Fig. 7. The relative changing thickness of TiO2 (a) transition (b) and SiO2 (c) layer of
the samples in the second group as a function of the atomic mass of the irradiated ions
with different energies.
400
STUDY OF ELEMENTAL DEPTH DISTRIBUTION IN THE MATERIAL . . .
IV. CONCLUSIONS
In this study, the elemental depth distribution of the multilayer material TiO2 /SiO2 /Si was
investigated using RBS method. After irradiation of TiO2 /SiO2 /Si samples with the noble ions at
different energies, the concentration of the elements and structure of the near-surface layers were
changed. The transition layers were formed at the interfaces due to ion beam mixing phenomenon.
It was founded that thickness of the TiO2 and SiO2 layers decreased while that of transition layers
increased with the growing energy and atomic mass of the implanted ions. The similar situation
was observed for the structures with different thicknesses, however, it was noticed that the degree
changing thickness of the thin layers was greater than that of thick layers after irradiation process.
ACKNOWLEDGEMENTS
This work was partly supported by Vietnam Academy of Science and Technology for senior
researchers under project number NVCC05.03-/19-19.
REFERENCES
[1]
[2]
[3]
[4]
[5]
[6]
[7]
[8]
[9]
[10]
[11]
[12]
[13]
[14]
[15]
[16]
[17]
[18]
S. K. Ghose, D. K. Goswami, B. Rout, and B. N. Dev, Appl Phys Lett 79 (4) (2001) 467.
R. Nagel, K.Weyrich, D.H.H.Hofmann, A.G.Balogh, Nucl Instrum Meth B 178 (2001) 315.
Garima Agarwal, Pratibha Sharma, Ankur Jain, Chhagan Lal, D. Kabiraj, I.P. Jain, Vacuum 83 (2009) 397.
Qing Su, Lloyd Price, Lin Shao, M. Nastasi, Metals 6 (11) (2016) 261.
K. Nakata, A. Fujishima, J Photoch Photobio C, 13 (3) (2012) 168.
X. Zhang, A. Fujishima, M. Jin, A.V. Emeline, T. Murakami, J. Phys. Chem. B 110 (2006) 25142.
Manoj A. Lazar, Shaji Varghese, Santhosh S. Nair, Catalysts 2 (4) (2012) 572.
Nhung Le TT, H. Nagata, A. Takahashi, M. Aihara, T. Okamoto, T. Shimohata, K. Mawatari, M. Akutagawa, Y.
Kinouchi, M. Haraguchi, J Med Invest 59 (1) (2012) 53.
J. F. Guayaquil-Sosa, Alan Calzada, Benito Serrano, Salvador Escobedo, Hugo de Lasa, Catalysts 7 (11) (2017)
324.
Ari A. Mohammed, Alan S. Said Ahmad, Wafaa A. Azeez, Advances in Materials Physics and Chemistry 5 (9)
(2015) 361.
W. Wunderlich, T. Oekermann, L. Miao J. Ceram, Journal of Ceramic Processing Research 5 (4) (2004) 343.
S. Girish Kumar, L. Gomathi Devi, J. Phys. Chem. A, 115 (46) (2011) 13211.
M. Bellardita, M. Addamo, A. Di Paola, G. Marc`ı, L. Palmisano, L. Cassar, M. Borsa, Journal of Hazardous
Materials 174 (1-3) (2010) 707.
Hossein Ijadpanah-Saravi, Mehdi Zolfaghari, Ahmad Khodadadi, Patrick Drogui, Desalination and Water Treatment 57 (31) (2016) 14647.
W.K. Chu, J.W. Mayer, M.A. Nicolet, Backscattering Spectrometry, Academic Press, New York San Francisco
London, 1978.
M. Turek, S. Prucnal, A. Drozdziel, K. Pyszniak, Nucl. Instrum. Methods Phys. Res. B 269 (7) (2011) 700.
Tran Van Phuc, M. Kulik, A. P. Kobzev, Le Hong Khiem, Communications in Physics 27 (4) (2017) 279.
M. Mayer, SIMNRA User’s Guide, Report IPP 9/113, Max-Planck-Institut f¨ur Plasmaphysik, Garching, Germany,
1997.