A decision support system for farm regional planning
Bạn đang xem bản rút gọn của tài liệu. Xem và tải ngay bản đầy đủ của tài liệu tại đây (302.69 KB, 16 trang )
Yugoslav Journal of Operations Research
15 (2005), Number 1, 109-124
A DECISION SUPPORT SYSTEM FOR FARM REGIONAL
PLANNING
I. PAPATHANASIOU1, B. MANOS1,
Μ. VLACHOPOULOU2, I. VASSILIADOU1
1
Department of Agricultural Economics, Aristotle University of Thessaloniki,
Thessaloniki, Greece
2
Department of Applied Informatics, University of Macedonia,
Thessaloniki, Greece
Received: September 2003 / Accepted: October 2004
Abstract: This paper presents a Decision Support System (DSS) for planning of farm
regions in Greece. The DSS is based on the development possibilities of the agricultural
sector in relation with the agricultural processing industries of the region and aims at the
development of farm regions through a better utilization of available agricultural
recourses and agricultural industries.
The DSS uses Linear and Goal Programming models and provides for different goals
alternative production plans that optimize the use of available recourses. On the other
hand, the alternative plans achieve a better utilization of the existent agricultural
processing industries or propose their expansion by taking into account the supply and
demand of agricultural products in the region.
The DSS is computerized and supported by a set of relational data bases. The
corresponding software has been developed in Microsoft Windows platform, using
Microsoft Visual Basic, Microsoft Access and LINDO.
For demonstration reasons, the paper includes an application of the proposed DSS in the
region of Servia Kozanis in Northern Greece.
Key words: Decision support systems, farm regional planning.
110
I. Papathanasiou, et al. / A Decision Support System for Farm Regional Planning
1. INTRODUCTION
This paper describes in short a DSS developed in the context of a research
project concerning the planning of farm regions, based on the development possibilities
of the agricultural sector in relation with the agricultural processing industries in the
region.
The corresponding research was divided into two parts. The paper follows the
same structure. The first part presents in short the system scheduling, the data needed, the
selection and development of required models, the development and the computerization
of the DSS for planning of farm regions. The second part presents an application of the
proposed DSS in the region of Servia Kozanis in Northern Greece for demonstration
reasons.
Specifically, based on the existing planning of the primary agricultural sector
and the agricultural processing industries of a region, the following methodology was
followed:
Review of the literature in the field of farm and land management, farm
planning, optimal allocation of resources and development of farm regions,
System scheduling, analysis of needs in hardware and software, plan of work,
Collection of micro and macro, economic and technical data,
Design of the development model of the region (Linear Programming model and
Goal Programming model),
DSS scheduling and development,
Application of DSS in the region of Servia Kozanis in Northern Greece. DSS
validation and verification.
2. SYSTEM SCHEDULING
The conceptual components of the DSS for planning of farm regions are a User
Support Base, a Data Base and a Model Base (Barber 1976, Berlo 1993, Manos and
Voros 1993, Manos et al. 2004, Vassiliadou et al. 2000).
The Data Base is divided into sub-bases, including information for a farm
region such as:
Primary agricultural sector
Available agricultural resources
¾ Land
¾ Livestock
¾ Labor
¾ Capital
¾ Machinery
Contribution of fix and variable costs in the total cost
Agricultural enterprises and technical-economic coefficients
¾ Agricultural enterprises
¾ Required labor
I. Papathanasiou, et al. / A Decision Support System for Farm Regional Planning
111
¾ Required machinery
¾ Required variable costs
Gross margin and profit of agricultural enterprises
Secondary sector – Agricultural processing industries of the region
Agricultural processing industries of the region according to its category
Investment costs
Capacity
Products’ and raw materials’ supply and demand
The Model Base includes all the necessary and suitable models for achieving the
following desired results:
Calculation of economic results for each agricultural enterprise and for the
entire farm region
Optimization of the use of the available resources in each agricultural
enterprise and in the entire farm region
Optimization of economic results
Sensitivity analysis of the various parameters (technical and economic) on
the economic result, etc.
More specifically, the Model Base includes Operational Research models and
specifically a Linear Programming and a Goal Programming model. It also includes some
basic models used by the DSS for the calculation of technical coefficients and economic
results. These results, which are stored in data files of the DSS Data Base, are:
Economic results
¾ Gross margin
¾ Production expenditures
¾ Profit, incomes
Rate of utilization of resources
¾ Rate of utilization of labor
¾ Rate of utilization of machinery
Rate of utilization of agricultural processing industries of the region
3. DATA
The DSS requires the collection of both micro economic – technical (source
data) and macro economic (source and secondary data) that will feed its Data Base.
Macro economic data concerning the primary agricultural sector are the
following:
Land: area according to its category (cultivated area, grassland, forest, and
irrigated or dry area), production plants of a four – year term (production enterprises,
hectares and age and variety of perennial plants as well).
Livestock: Livestock breeding of the region (variety of livestock population,
age, number of stock – farms, the market value per capita.
112
I. Papathanasiou, et al. / A Decision Support System for Farm Regional Planning
Labor: Active population in the agricultural sector of the region.
Capital: Machinery according to its category (type, year and initial cost,
horsepower HP) buildings by category (type, capacity, year and initial cost of
construction) land reclamation works by category (type, year and initial cost of
construction).
As far as the secondary sector and the agricultural processing industries are
concerned, the following macro economic data are necessary:
Agricultural Processing Industries: Both the agricultural processing industries
of the region and the general county according to its category (processed products, line
production), investment costs, operational costs, capability (maximum capability by
product, annual quantities of processed products, annual quantities of raw materials) and
Supply and demand of products, agricultural equipment and raw materials.
The micro economic and technical data must be gathered in accordance with the
Ministry of Agriculture Book – keeping from an adequate sample of farms and their
production enterprises, which represent the region’s production plan. These micro
economic and technical data are related with the following: Yields, product prices,
necessary seeds – fertilizers – pesticides etc., necessary labor force and necessary
machinery and all those necessary technical and economic data needed in order to
estimate the gross margin, the variable cost and the gross profit of each production
enterprise.
4. DESIGN AND DEVELOPMENT OF THE LINEAR MODEL
The DSS includes a Linear Programming model and a Goal Programming
model which are used for the better utilization of available agricultural recourses and
agricultural industries of a region (Barnard and Nix 1993, Bernardo et al. 1992, Hazell
and Norton 1986, Jeffrey et al. 1992, Lee et al. 1995, Manos and Kitsopanidis 1988,
Manos 1991, Manos and Gavezos 1995, Onta et al. 1991).
The Linear Programming model in matrix notation has the following form:
max cx – dw
subject to:
Αx – Rw >=< b
x, w >=0
where:
x = the vector of both crop and livestock enterprises
w = the vector of resources activities
c = the vector of gross margins of both crop and livestock enterprises
d = the vector of variable costs of resources activities
A = the matrix of input - output coefficients of both crop and livestock enterprises
R = the matrix of input - output coefficients of activities of resources
b = the vector of the maximum available quantities or the minimum required quantities of
production factors
I. Papathanasiou, et al. / A Decision Support System for Farm Regional Planning
113
The model has been designed and developed in order to include in the objective
function all the necessary production enterprises and all the activities of resources such as
family and seasonal labor, tractor, harvesting machinery and variable capital whereas
their total variable cost is automatically subtracted from the optimum production plan’s
total gross profit.
The model formulation allows the input of all the constraints concerning land,
total area or area by category and production enterprise, livestock breeding, labor,
machinery, variable cost and the capacity of agricultural processing industries. This
structure is in accordance with the relevant theoretical knowledge and the typical
practice, concluding in an optimum – scientifically and technically – production plan,
which is also feasible and has practical application.
The model determines the optimal allocation of resources and outcomes to the
optimum production plan. It also provides the sensitivity analysis in the objective
function coefficients and the maximum available or the minimum required quantities of
the resources. It also provides an analysis of marginal productivity and marginal cost of
agricultural factors.
This model also gives the opportunity of parametric analysis of the objective
function or in the constraints, out-coming to alternative production plans.
Finally, this model is applicable on one hand, for its solution as a Mixed Integer
Programming model in regard to factors’ non-divisibility, such as livestock and
machinery and on the other hand as a Goal Programming Model providing near optimum
production plans.
4.1. Activities and constraints
The activities of the model are divided into two categories: The activities of
agricultural enterprises and the activities of resources. The model may include up to 105
activities and specifically up to 53 annual and perennial crops, up to 6 livestock
enterprises and up to 32 resources’ activities.
The constraints refer to the land, livestock, labor, machinery, number of the
agricultural processing industries and variable costs. The model may include up to 123
constraints and specifically up to 53 land constraints for crops, up to 3 constraints for
livestock, up to 7 constraints for processing industries, up to 33 constraints for
agricultural machinery, up to 25 constraints for labor and 2 constraints for variable
capital. Constraints have been set for each agricultural enterprise and for the entire region
as well. The determination of the upper and the lowest limits is in accordance with the
relevant theoretical knowledge and the technical – economic conditions (quota for
tobacco, regions’ rights for wheat, concession for beets, etc.). As far as labor is
concerned constraints have been set for the one provided by the family members and the
seasonal labor provided outside of the family. The same constraints have been set for
tractors and the proposed production plan can use tractors outside of the region at any
time of the year as long as the regions’ tractors are inadequate. As long as the harvesting
machinery is concerned their utilization is based on the maximum number of owned
available machinery. As far as the activities of agricultural processing industries are
concerned, the constraints are related with the maximum quantity of raw materials that
can be processed. Additionally, for the milk processing industries one more constraint is
used to determine the proportion between sheep’s and goats’ milk for the production of
I. Papathanasiou, et al. / A Decision Support System for Farm Regional Planning
114
the end product per unit. Finally there are two constraints that refer to the capital, one for
the owed available capital and one for the borrowed capital.
The objective function of the Linear Programming is a linear function of all
activities of agricultural enterprises and resources. The objective function represents the
total gross profit of the production plan in the region of concern.
Total gross profit of the regions’ production plan is maximized under the
aforementioned constraints.
All data needed for the linear model are fed automatically by the Data Base of
DSS. These are either primal data or data processed before by the models of the Model
Base of DSS (see sections 2 and 5).
4.2. Optimum and alternative production plans
The DSS gives the optimum production plan and alternative production plans,
makes sensitivity analysis and comparison, from the technical - economic point of view,
between the existing and the proposed production plans. Specifically:
Comparison between the existing and the proposed production plan
Comparison of the rate of utilization of labor
Comparison of the rate of utilization of machinery
Comparison of the economic results
Marginal analysis: marginal productivity and marginal costs of resources
Sensitivity analysis of the optimum production plan
Parametric analysis - achievement of alternative production plans
5. DSS’S COMPUTERIZATION
The DSS is fully computerized. The corresponding software has been developed
in the platform of Microsoft Windows 98 using Microsoft Visual Basic, Microsoft
Access and LINDO (release 6.01) for Windows (Schrage 1997). It is supported by a set
of relational data bases permitting modern and quick operations by using Select Query
Language (SQL).
The presentation of the outcoming results is based on DataBase Grids, where
data are locked so as to prevent false input on behalf of the user. However, it is possible
to change or add inputs wherever is necessary.
The user interface uses the multiple document information technique (MDI).
This technique permits the users to keep open many Windows with different information
making available the easy and quick control of work.
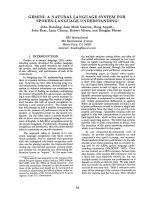
Printings are based on Crystal Reports interface that permit quick formatting of
print outs (some screens of the DSS are given below).
THE MENU
The menu of DSS is divided into three sub menus: General Information, Files
and Linear Model. Specifically the sub menus are:
I. Papathanasiou, et al. / A Decision Support System for Farm Regional Planning
115
Menu: General Information
This menu includes general information about the codification of all factors,
farm enterprises, machinery, land reclamation works, population and products.
The following selections are available in the form of windows:
a) «Crop enterprises»
b) «Livestock enterprises»
c) «Categories of machinery»
d) «Categories of buildings and land improvements»
e) «Population data»
f) «Districts of the region under study»
g) «Products from crop enterprises»
h) «Products from livestock enterprises»
i) «Exit»
Menu: Files
This menu includes all the necessary technical and economic information for the
region under study and its districts. These data are divided into different categories so
that it is possible to both describe the existent situation and achieve optimal and
alternative production plans.
The following selections are available:
a) «Land of crop enterprises»
b) «Livestock capital»
c) «Available machinery»
d) «Available buildings and land improvements»
e) «Available human labor»
f) «Available mechanical labor»
g) «Requirements of crop enterprises in human and mechanical labor»
h) «Requirements of livestock enterprises in human and mechanical labor»
i) «Variable capital of crop enterprises»
j) «Variable capital of livestock enterprises»
k) «Economic data of crop enterprises»
l) «Economic data of livestock enterprises»
m) «Gross return for each district»
n) «Synthesis of fixed and variable capital»
o) «Production expenses and coefficients»
p) «Returns, profits and incomes»
q) «Exit»
Menu: Linear Model
This category includes all operations about the design, formulation,
development and evaluation of linear models as well as the presentation of the final
economic results.
116
I. Papathanasiou, et al. / A Decision Support System for Farm Regional Planning
The following selections are available:
a) «Formulation of linear program»
b) «Close the linear program»
c) «Development of optimum production plans»
d) «Evaluation of production plans»
e) «Comparison of results of existent and optimum plan»
f) «Comparison of profits, returns and incomes of existent and optimum plan»
It is noted that the linear model is open as regards the number of constraints and
variables in the sense that the user may add or subtract variables and constraints
according to the needs that he meets.
6. DSS APPLICATION
In this section we present an application of the given DSS in practice.
Specifically, the DSS was applied to farm planning of the region of Servia Kozanis in
Northern Greece. The region consists of one Municipality (Servia) and four Communities
(Platanorema, Avles, Goules and Kranidia) with a total population of 6,678 people. The
cultivated area of the whole region is 38.522 stremmas (1 hectare = 10 stremmas).
The production plan of the region includes annual and perennial crops such as
wheat, barley, maize, tobacco, sugar beets, vegetables, vineyards, plum tress, apple trees,
peaches, nuts, cherries and almond trees. There are 448 farms in the whole region which
means an average farm size of 86 stremmas. There are also reared 26,288 sheep and
goats and 571 cows. The available labor of the whole region is 755 man units.
The invested capital in the primary agricultural sector of the region is about 24
million euro, 65.3% of which is fixed (buildings, machinery, perennial crops, land
improvements) and 34.7% variable (seeds, fertilizers and medicine, seasonal human and
mechanical labor, machinery oil, variable capital for animals). The fixed capital does not
include the value of the land. The gross return in the total region is about 12.4 million
euro, which is due by 58.4% to plant production and 41.6% to animal production. The
main sources of this return are tobacco (15.0%), maize (14.3%), wheat hard (6.1%),
potatoes (4.7%), peaches (2.5%), sugar beets (2.7%), sheep (22.7%), goats (9.5%) and
cows (9.4%) (Table 1).
For the processing of the produced agricultural products in the region there are
various small and medium size industries and mainly for milk, peaches, apples, cherries
and potatoes. The capacity and the needs of them are considered in the linear model.
The data base and sub bases of the DSS were fed by primal and secondary data
collected by the associates of the Department of Agricultural Economics and the
Development Agency of Western Macedonia (ANKO S.A.). The DSS automatically
processed all the data and produced all technical and economic coefficients (in about 40
tables) described in sections 2, 3 and 5 above. All results are presented by district (in our
case Servia, Platanorevma, Avles, Goules and Kranidia) and in total. Among them the
data needed to feed the linear model are included.
I. Papathanasiou, et al. / A Decision Support System for Farm Regional Planning
117
Table 1: Existent and optimum production plan for the whole region
Enterprises
Existent
Optimum
Plant production
Area (stremmas)
Vineyards (for wine)
533
625
Almond trees
71
95
Maize
10,081
10,081
Plum trees
62
92
Sugar beets
1,216
240
Tobacco
1,465
1,153
Water melons
268
268
Walnut trees
100
128
Barley
1.260
99
Lucern
4.262
6,185
Apples
232
279
Potatoes
552
35
Leeks
0
250
Peaches
474
567
Rye
430
364
Wheat hard and then Eggplants
0
250
Wheat soft
2,745
3,880
Wheat hard non-irrigated
4,497
6,136
Wheat hard irrigated
6,688
0
Beans
45
0
Fallow
3,541
0
Total
34,981
30,726
Crops for feedstuffs
Maize
0
65
Wheat hard
0
1,229
Barley
0
5,885
Lucern
0
614
Total
0
7,795
Animal production
Number of heads
Sheep (feedstuffs bought)
15,308
14,649
Sheep(feedstuffs self-produced)
0
659
Goats (feedstuffs bought)
10,980
0
Goats (feedstuffs self-produced)
0
10,980
Cows (feedstuffs bought)
571
571
Cows (feedstuffs self-produced)
0
0
In continuation the linear model was applied. As we mentioned above, this
model is included in the model base of the DSS and automatically is fed by the data base
118
I. Papathanasiou, et al. / A Decision Support System for Farm Regional Planning
and sub bases. In the case of the whole region the linear model included 105 variables
and 123 constraints.
The solution of the model gave an optimum crops plan with a better reallocation
of production resources (land, labor, machinery and variable capital). The rates of
employment for human and mechanical labor present important improvements. The
optimum plan achieves 4.9% higher gross return than the existent one, 5.0% lower
production expenses, 18.9% higher agricultural income and 24.0% higher return to labor.
The optimum plan also achieves 11.1% return to capital against 3.4% of the existent plan
(Table 2).
Table 2: Economic results of existent and optimum plan for the whole region
Existent
Optimum
Increase / decrease
Profits/ returns
plan
plan
(%)
Gross return
12,395,778
12,999,025
4.9
Production expenses
12,679,644
12,040,351
-5.0
Profit / loss
-283,866
958,673
437.7
% of gross return
-2.29%
58.53%
60.8
% of production expenses
-2.24%
141.11%
60.8
Stremmas
38,522
38,522
per stremma
-7,4
24,9
437.7
Return to land
794,052
2,145,705
170.2
per stremma
20.6
55.7
170.2
Return to labor
5,734,062
7,107,776
24.0
per day
22,4
27,1
21.3
Return to capital
3.39%
54.26%
50.9
Agricultural income
7,624,785
9,069,546
18.9
No of farms
448
448
Agricultural income per farm
17,020
20,245
18.9
The DSS was also used to estimate the marginal productivity of agricultural
resources as well as to make sensitivity analysis (both for activities and resources) and
check the stability of the optimum plan (See screen below).
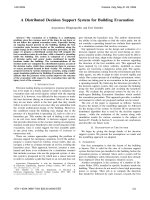
Moreover the DSS was used for parametric investigations of resources
availability that becomes automatically by the Parametric Linear model. This model e.g.
was used to examine the impacts of availability of annual or monthly labor on its
productivity (Figure 1) and on agricultural income. It is also used to investigate the
impacts on livestock breeding from an increase of capacity of corresponding milk
processing industry.
Finally, the DSS was used to simulate different scenarios by Goal Programming.
The model has the possibility to achieve specific goals, e.g. to find alternative production
plans which achieve predetermined levels of gross margin near the optimum one.
I. Papathanasiou, et al. / A Decision Support System for Farm Regional Planning
119
Marginal productivity of labor
(euro/unit)
700
600
500
400
300
200
100
0
755
758
858
863
876
916 1.034 1.064 1.158 1.164 4.000
Man units
Figure 1: Variations of labor productivity
7. CONCLUSIONS
Disposing all conceptual and necessary components, the DSS presented above is
a suitable tool for farm regional planning. It is a computerized simple and friendly tool
for the decision makers of farm regions helping them in finding the optimum allocation
of the available resources and better utilization of agro-processing industry. Extra
advantages of the proposed DSS help the decision makers in doing parametric
investigations and simulating different scenarios.
The proposed DSS stores source and secondary data, processes them and
calculates all technical and economic coefficients of the region by different categories, by
sub region and in total. At a second stage, the DSS achieves the optimum crops plan of
the region and the optimum utilization of available agricultural resources taking in
account the development possibilities of the agricultural sector, the supply and demand of
the agricultural products and the capacity of agro-processing industry of the region.
Moreover, the decision makers can investigate the impacts on optimum plan and
income from the variations of available resources and/ or crops and resource prices. In
addition, the decision makers can achieve alternative near optimum plans with
predetermined levels of total gross margins. These characteristics of the DSS are due to
the Parametric and Goal Programming models that are embodied in the DSS.
REFERENCES
Barber, G., "Land use plan design via interactive multi objective programming", Environment
and Planning, 8 (1976) 625.
[2] Barnard, C.S., and Nix, J.S., Farm Planning and Control, Cambridge University Press, 1993.
[3] Berlo, J.M., "A decision support tool for the vegetable processing industry; an integrative
approach to market, industry and agriculture", Agricultural Systems, 43 (1) (1993) 91-109.
[4] Bernardo, D.J., Engle, D.M., Lochwiller, R.L., and McCollum, F.I., "Optimal vegetation
management under multiple - use", Journal of Range of Management, 45 (5) (1992) 462-469.
[1]
120
[5]
[6]
[7]
[8]
[9]
[10]
[11]
[12]
[13]
[14]
[15]
I. Papathanasiou, et al. / A Decision Support System for Farm Regional Planning
Hazell, P.B.R., and Norton, R.D., Mathematical Programming for Economic Analysis in
Agriculture, University of California, Berkeley, 1986.
Jeffrey, G., Gibson, R., and Faminow, G., "Nearly optimal L.P. as a guide to agricultural
planning", Agricultural Economics, 8 (1) (1992) 1-19.
Lee, D.J., Tipton T., and Leung P.S., "Modelling cropping decisions in a rural developing
country; a multiple - objective programming approach", Agricultural Systems, Oxford,
Elsevier Applied Science, 49 (2) (1995) 101-111.
Manos, B., and Kitsopanidis, G., Mathematical Programming Models for Farm Planning,
Oxford Agrarian Studies, vol. XVII, 1988.
Manos, B., "Farm planning with multiple objectives. An application of compromise
programming in Greece", Agricultura Mediterranea, 121 (1991) 224-238.
Manos, B., and Voros, M., "A decision support system for poultry producers", Proceedings of
9th World Farm Management Congress, Budapest, 1993.
Manos, B., and Gavezos E., "A multiobjective programming model for farm regional planning
in northern Greece", Quarterly Journal of International Agriculture, 34 (1) (1995).
Manos, B., Bournaris, Th., and Silleos, N., Antonopoulos, V., and Papathanasiou, J., "A
decision support system approach for rivers monitoring and sustainable management",
Environmental Monitoring and Assessment, 96 (1-3) (2004) 85-98.
Onta, P.R., Gupta, A.D., and Paudyal, G.N., "Integrated irrigation development planning by
multi - objective optimization", International Journal of Water Resources Development, 7(3)
(1991) 185-193.
Schrage, L., Optimization Modeling with LINDO, Duxbury Press, 1997.
Vassiliadou, I., Vlachopoulou, M., Tzortzios, S., and Manos, B., "A computerised model for
the development of agricultural regions", Proceedings of 2nd Special Conference of Hellenic
Operational Research Society «Information Systems in Agricultural Sector», Chania, 2000.
I. Papathanasiou, et al. / A Decision Support System for Farm Regional Planning
Files
Lin ear M od el
G en eral Inform ation
C rop en terpris es
Livestoc k en terpris es
C ateg ories of m ac hin ery
C ateg ories of b uildings an d land im provem en ts
P op ulation d ata
D istricts of th e reg ion
P rod ucts from crop enterpris es
P rod ucts from lives tock enterpris es
Inq uiries
P ILO T MO DEL
Files
Files
Linear M odel G eneral Inf orm ation
Land of crop enterpris es
Livestoc k c apital
A vailable m ac hinery
A vailable buildings and land improvem ents
A vailable hum an labor
A vailable m ec hanic al labor
R equirem ents of crop enterpris es in hum an and m ec hanic al labor
R equirem ents of lives toc k enterpris es in hum an and m ec hanic al labor
V ariable c apital of crop enterpris es
V ariable c apital of livestoc k enterpris es
Econom ic data of crop enterpris es
Econom ic data of lives toc k enterpris es
G ross return for eac h district
S ynthes is of fixed and variable c apital
Production expens es and c oefficients
R eturns, profits and inc om es
E xit
121
122
I. Papathanasiou, et al. / A Decision Support System for Farm Regional Planning
F iles L in
ear
odod
elel
Lin
e arMM
G e n er al Infor m ation
O ptim u m pro d uc tion plan s
E valu ation of p r oduc tion p lans
C om p aris on of r es ults of e xis tent and op tim u m plan
C om p aris on of pr ofits , r eturns an d inc om es of exis te nt and optim um plan
Files Linear Model
General Information
Land of crop enterprises
District
AVLES
TOTAL AR AVLES
GOULES
Crop enterprises
KRANIDIA
PLATANOREMA
SOFT W HEAT IRRIGATED
HARD WHEAT DRY
SERVIA
HARD WHEAT IRRIGATED
BARLEY DRY
RYE DRY
MAIZE IRRIGATED
BEANS IRRIGATED
TOBACCO IRRIGATED
SUGAR BEETS IRRIGA TED
LUCERN IRRIGATED
POTATOES IRRIGATED
PEARS IRRIGATED
PLUMS IRRIGATED
MAIZE AND SPINACH IRR.
HARD WHEAT & EGGPLANTS IRR.
HARD W HEAT & PEPPRS IRR.
HARD W HEAT & BEANS IRR
Totals (stremmas)
I. Papathanasiou, et al. / A Decision Support System for Farm Regional Planning
F iles
Lin ear M od el
G en er al Inf or m ation
S yn th es is of fixed an d v ariab le c apital
D is tric t
A V LE S
TOT AL ARE A
C om p uta tio n
T otal c apital
V ariab le
c apital
F ixed c ap ital
L and Im pr ov em en ts
S eeds
A gric u ltur al C ons t.
F ertiliz ers
P er enn ial P lantations
P es tic id es
Lives toc k
F u el-lub ric ants M ac h .
M ac h in er y
F u el-lub ric ants R es t
R es t E xp en ditur es
Lives toc k var . c ap.
P rint
H u m an L ab or
M ec h an ic al L ab or
Files Linear Model
General Information
Returns, profits and incomes
District
Computation
AVLES
TOTAL AREA
Gross Return
Production Expenditures
Loss/Profit
% Gross Return
% Production Exp.
Stremmas
per Stremma
Return to land
per Stremma
Return to labor
per 8-hour
Return to Capital
Agricultural Income
123
I. Papathanasiou, et al. / A Decision Support System for Farm Regional Planning
124
Files Linear Model
General Information
Evaluation of production plans
COMMENTS
MAXIMUM INCOME
PRESENT PERMISSIBLE PERMISSIBLE
VALUE
INCREASE
DECREASE
VARIABLES
Corn Outside Network, irrigated, Normal Cultivation
Corn Inside Network, Irrigated, Normal Cultivation
W heat Hard Outside Network, Dry, Normal Cultivation
W heat Hard Inside Network, Dry, Normal Cultivation
W heat Hard Outside Network, Irrigated, Normal Cultivation
W heat Hard Inside Network, Irrigated, Normal Cultivation
Barley Outside Network, Dry, Normal Cultivation
Barley Inside Network, Dry, Normal Cultivation
Rye Outside Network, Dry, Normal Cultivation
Rye Inside Network, Dry, Normal Cultivation
W heat Soft Outside Network, Dry, Normal Cultivation
INFINITY
INFINITY
INFINITY
INFINITY
INFINITY
INFINITY
INFINITY
INFINITY
PLAN OPENING
COMPUTATION
Files
Linear M od el
RESULTS
VARIABLES
SENSITIVITY AN. VAR.
CONSTRAINTS
SENSITIVITY AN. CON.
PARA
G en eral Inform ation
C om p aris on res ults
C R O P EN T ER PR IS ES
EX IST EN T PLAN (St) O PT IMU M PL AN (St)
LU C ER N IR R IG AT ED
V IN E YAR D S D R Y
R YE D R Y
AL MO N D T R EES IR R IG AT ED
M A IZE IR R IG AT ED
M A IZE & S P IN AC H IR R IG AT ED
PEAR S IR R IG AT ED
PLU MS D R Y
PLU MS IR R IG AT ED
O LIV ES D R Y
SU G AR B EET S IR R IG AT ED
T O BAC C O IR R IG AT ED
W AT ER MELO N S IR R IG AT ED
PO T AT O ES IR R IG AT ED
W ALN UT S IR R IG AT ED
C H ER R IE S IR R IG AT ED
BAR L EY D R Y
C ABB AG ES IR R IG AT ED
PLAN SEL EC T IO N
EX. AN D O PT IMU M PL AN
PR O D . O F C R O P EN T .
EX. AN D O PT IMU M PL AN
PR O D . O F LIV. E N T .
PR IN T