Logistics development in finnish and swedish companies with respect of russia and four asian countries: Traffic flow and warehousing analysis from current situation and likely development
Bạn đang xem bản rút gọn của tài liệu. Xem và tải ngay bản đầy đủ của tài liệu tại đây (566.81 KB, 49 trang )
Olli-Pekka Hilmola & Bulcsu Szekely
LOGISTICS DEVELOPMENT IN FINNISH AND SWEDISH COMPANIES
WITH RESPECT OF RUSSIA AND FOUR ASIAN COUNTRIES:
TRAFFIC FLOW AND WAREHOUSING ANALYSIS FROM
CURRENT SITUATION AND LIKELY DEVELOPMENT TRENDS
LAPPEENRANTA
UNIVERSITY OF TECHNOLOGY
Lappeenrannan teknillinen yliopisto
Digipaino 2006
LAPPEENRANNAN TEKNILLINEN YLIOPISTO
TUOTANTOTALOUDEN OSASTO
LAPPEENRANTA UNIVERSITY OF TECHNOLOGY
DEPARTMENT OF INDUSTRIAL ENGINEERING AND MANAGEMENT
TUTKIMUSRAPORTTI
RESEARCH REPORT
175
LAPPEENRANTA UNIVERSITY OF TECHNOLOGY
Department of Industrial Engineering and Management
Kouvola Research Unit
Research Report 175
Olli-Pekka Hilmola & Bulcsu Szekely
Logistics Development in Finnish and Swedish Companies with
Respect of Russia and Four Asian Countries: Traffic Flow and
Warehousing Analysis from Current Situation and Likely
Development Trends
ISBN 952-214- 283-2 (paperback)
ISBN 952-214- 284-0 (pdf)
ISSN 1459-3173
1
ABSTRACT
It is evident that nowadays the centre of world trade is slowly shifting its place to Asia in
general and to China in particular. Especially in manufacturing terms the change is
obvious and this fact puts a significant pressure on cost efficient and lead time wise
supply chain solutions. At the same time there is a massive imbalance in the traffic flows
between continents. This is in most cases due to the supply chain strategies large
multinational companies opt for. Many of them optimize their network by embracing
“local sourcing” to achieve control and responsiveness in their supply chains. As a
consequence, plenty of manufacturing units in Europe must use expensive raw materials
and semi-finished items. The critical factors in most cases are related to transportation,
warehousing costs on the one hand and waste of time as a result of delays on the other.
The optimal decision has to be reached considering the choice between centralized and
decentralized inventory policies together with the choice of choosing the right
combination of transportation modes. From Asia to Europe to ship goods via sea is cheap,
but takes very long time – in some cases even eight weeks. In contrast air transport is
expensive and poses limits to the size and weights of the products. Still there is a third
option that would seem to be the solution: railways transport is more advantageous in
terms of cost wise in comparison to air transport and provides shorter lead times when
looking at the choice of sea containers.
In this scrutiny we are to analyze the situation by taking under consideration large
enterprises of Finland and Sweden. On the bases of this investigation we track the way of
how the market shares between transportation modes will evolve in the future and cast a
detailed view on traffic flows between Europe, Russia, South-Korea, India, China, and
Japan. Alongside we show estimations on the development of transportation and
warehousing of these companies in the forthcoming years. Based on our survey results,
we identify that pure transportation costs will not change that greatly in the next five
years, and sea and road transports are the most favoured modes. However, air transports
will face small decrease in popularity, where railways will gain small increase in
transportation share. Issues regarding to emerging markets, we identify that especially
China and Russia will face increasing volumes in amount of containers transported, while
India has a bit less significant increase. Our research also reveals that transportation
unbalance will persist with Russia; Swedish as well as Finnish companies mostly exploit
export based strategy in the future too. In the warehousing issues we identify that amount
of smaller warehouses is likely to continue small decline in the future, and the interest
will shift to larger warehousing facilities. Interestingly, Finnish companies have more
warehouses in Central and Eastern Europe, as compared to Swedish companies, which
are concentrating more on Western Europe. Both of the countries have largest presence in
home country. As selecting warehouse location, companies emphasize issues such as low
distribution costs, proximity of assembly/manufacturing units, inbound logistics
integration, and available third party logistics connections. In the end of our research
report we speculate that warehousing locations will not that greatly change due to the
structure of ports and connections. We also suggest some avenues for further research.
Keywords:
International transportation, transportation modes, emerging markets,
warehousing
2
TIIVISTELMÄ
On selvää, että tänä päivänä maailmankaupan painopiste on hiljalleen siirtymässä Aasiaan ja varsinkin Kiina on ollut huomion keskipisteessä. Erityisesti valmistavien yritysten
perspektiivistä muutos on ollut merkittävä ja tämä tosiasia kasvattaa yrityksissä paineita
luoda kustannustehokkaita toimitusketjuratkaisuja, joiden vasteaika on mahdollisimman
lyhyt. Samaan aikaan kun tarkastellaan kuljetusvirtoja, huomattaan että maanosien välillä
on suuri epätasapaino. Tämä on enimmäkseen seurausta suurten globaalisti toimivien
yritysten toimitusketjustrategioista. Useimmat näistä toimijoista optimoivat verkostonsa
turvautumalla ”paikalliseen hankintaan”, jotta he voisivat paremmin hallita
toimitusketjujaan ja saada näitä reagointiherkimmiksi. Valmistusyksiköillä onkin monesti
Euroopassa pakko käyttää kalliita raaka-aineita ja puolivalmisteita. Kriittisiksi tekijöiksi
osoittautuvat kuljetus- ja varastointikustannukset sekä näiden seurauksena hukka-aika,
joka aiheutuu viivästyksistä. Voidakseen saavuttaa optimiratkaisun, on tehtävä päätös
miten tuotteet varastoidaan: keskitetysti tai hajautetusti ja integroida tämä valinta
sopivien kuljetusmuotojen kanssa. Aasiasta Pohjois-Eurooppaan on halpaa käyttää
merikuljetusta, mutta operaatio kestää hyvin pitkään – joissain tapauksessa jopa kahdeksan viikkoa. Toisaalta lentokuljetus on sekä kallis että rajoittaa siirrettävien tuotteiden
eräkokoa. On olemassa kolmaskin vaihtoehto, josta voisi olla ratkaisuksi: rautatiekuljetus
on halvempi kuin lentokuljetus ja vasteajat ovat lyhyemmät kuin merikuljetuksissa.
Tässä tutkimuksessa tilannetta selvitetään kyselyllä, joka suunnattiin Suomessa ja
Ruotsissa toimiville yrityksille. Tuloksien perusteella teemme johtopäätökset siitä, mitkä
kuljetusmuotojen markkinaosuudet tulevat olemaan tulevaisuudessa sekä luomme kuvan
kuljetusvirroista Euroopan, Venäjän, Etelä-Korea, Intian, Kiinan ja Japanin välillä.
Samalla on tarkoitus ennakoida sitä, miten tarkastelun kohteena olevat yritykset aikovat
kehittää kuljetuksiaan ja varastointiaan tulevien vuosien aikana. Tulosten perusteella
näyttää siltä, että seuraavan viiden vuoden kuluessa kuljetuskustannukset eivät
merkittävissä määrin tule muuttuman ja meri- sekä kumipyöräkuljetukset pysyvät
suosituimpina vaihtoehtoina. Kuitenkin lentokuljetusten osuus laskee hiukan, kun taas
rautatiekuljetusten painotus kasvaa. Tulokset paljastavat, että Kiinassa ja Venäjällä
kuljetettava konttimäärä kasvaa; Intiassa tulos on saman suuntainen, joskaan ei niin
voimakas. Analyysimme mukaan kuljetusvirtoihin liittyvä epätasapaino säilyy Venäjän
kuljetusten suhteen: yritykset jatkavat tulevaisuudessakin vientiperusteista strategiaansa.
Varastoinnin puolella tunnistamme pienemmän muutoksen, jonka mukaan pienikokoisten
varastojen määrät todennäköisesti vähenevät tulevaisuudessa ja kiinnostus isoja varastoja
kohtaan lisääntyy. Tässä kohtaa on mainittava, että suomalaisilla yrityksillä on enemmän
varastoja Keski- ja Itä-Euroopassa verrattuna ruotsalaisiin toimijoihin, jotka keskittyvät
selkeämmin Länsi-Euroopan maihin. Varastoja yrityksillä on molemmissa tapaukissa
paljolti kotimaassaan. Valitessaan varastojensa sijoituskohteita yritykset painottavat
seuraavia kriteereitä: alhaiset jakelukustannukset, kokoamispaikan/valmistustehtaan
läheisyys, saapuvan logistiikan integroitavuus ja saatavilla olevat logistiikkapalvelut.
Tutkimuksemme lopussa päädymme siihen, että varastojen sijoituspaikat eivät muutu
satamien rakenteen ja liikenneyhteyksien takia kovinkaan nopeasti.
Avainsanat: Kansainväliset kuljetukset, kuljetusmuodot, tulevaisuuden markkinat,
varastointi
3
TABLE OF CONTENTS
1. Introduction
4
2. Literature Review – World Trade, Traffic Flows and Major Continents
6
3. Literature Review – Business Logistics
11
4. Research Methodology
16
5. Empirical Data Analysis
18
6. Discussion
29
7. Conclusions
34
References
35
Appendices
40
4
1. Introduction
Most often traffic flows between regions, their respective currency valuations, and in the
end economic prosperity is not equally distributed (Ohmae 1985). This leads to the
situation where traffic is seldom in balance between major economies, and currency
crises affect to the transportation flows enormously. For example, United Nations (1999a)
estimated that South-Korean port of Busan experienced from empty container handling
significantly during Asian economic (and currency) crisis occurred in 1997. Based on
Krugman’s (2005) findings, world faces every 19th month currency crisis, and eventually
traffic flows and logistics systems will pay the price (rapid enlargement of trade
unbalance between regions, increasing amounts of empty transports). Even if the world
trade has developed favourably during the recent years, the unbalance between continents
still exist – as world trade continues to grow, this situation has only enlarged. As US is
developing more service and knowledge economy, and Asia serves their manufacturing
power, the traffic is very unbalanced between these two continents (United Nations 2005a
& 2005b). Similar situation is reported to be found from Europe as well; Russia exports
extensively raw materials to west, using sea and rail, while their imports are mainly
driven by road transports via Finland, and Baltic States (Kilpeläinen 2004). So, it could
be argued that traffic balance is one factor, and transportation mode selection is another.
This mode unbalance is not the minor issue; so far economic growth has favoured sea
containers and air transports, but concurrently railways have been unable to respond on
international transportation demand. However, railways have been under agenda of
several international traffic development projects (United Nations 1999a & 1999b;
Molnar & Ojala 2003).
Research problem in this paper concerns the North-European countries, Finland and
Sweden, and their logistical operations with Russia and Asian countries. We are
interested about countries, which have significance in the trade and economic growth,
and could be reached, if alternatives would be further developed, with all different
transportation modes. So, from Asia we have picked China, Japan, South-Korea and
India. The last country in the list, India, does not necessarily represent the most feasible
alternative to plain rail or road transports from e.g. Europe, but major parts of the needed
journey could be completed through Russia, by near of Kazakhstan (with either train or
5
road), ending up to Iranian harbour and continuing from there towards Mumbai harbour
in India (Molnar & Ojala 2003).
This paper is structured as follows: In the second section we will review the world
trade development, traffic flows and unbalanced nature of world transports. Our literature
review concludes that developed countries (US, Japan and EU-15) still hold the
significance in the world economy, but in transportation, the growing number of
transactions indicates that “the fast phase” developing countries have already taken the
lead. In the third section of our research we review literature of location decision of
warehouses, business logistics and supply chain management issues. As theory suggest,
shorter supply chains as well as more centralized warehouses are increasing trend in
global operations. As large world-wide corporations are the major cause of traffic flows
in a world context, we have gathered empirical material with a survey from largest
companies from Finland and Sweden. We will review the research methodology of this
questionnaire in the fourth section of this research report. Empirical part is analyzed in
the fifth section, and we find that with several items our questionnaire supports previous
research, but our analyzed answers reveal that companies are planning to implement
relatively small amount of actions with regard to traffic unbalance, and integration of
developing countries into their manufacturing/customer network. Transportation volumes
are significantly increasing towards Russia and China, but also India. In warehousing
side, we identify that location between Swedish and Finnish companies differ. Overall,
there is small tendency that amount of smaller warehouses will decline, while larger ones
are being favoured. We also present findings from warehousing location selection criteria
from respondent companies. In the fifth discussion section we will speculate whether
warehousing location will change at all in the future; this is justified with preliminary sea
port network analysis from Finland, Sweden, Central Europe and Russia. In the final
section we will conclude our research, and propose further avenues for it.
6
2. Literature Review – World Trade, Traffic Flows and Major Continents
As Figure 1 shows, world GDP has increased steadily during the last 50 years. However,
this means that as the world trade is increasing by a higher magnitude compared to GDP,
the amounts of transportation, especially international, also increases. The relationship
between world trade and GDP growth was for a long time near of 1.5, meaning that every
time the world GDP grew with one percent, trade increased with 1.5 times. However, as
globalization turned real during 1990’s, this relationship has only fostered, so nowadays
the multiplier is 2.5 (United Nations 2005b). So, it is not surprising to find out that all the
other three transportation modes, namely road, sea and air freight have increased their
total transportation amount for decades. From these three most popular alternatives, air
freight has been predicted to grow annually by 6.2 percent (Boeing 2005), nearly without
any limits. Also infrastructure research related to transportation models supports this
mode; infrastructure in air freight transportation is constantly increasing, while e.g. road
transportation has started to fall (Marchetti 1988), and rail infrastructure has been on the
constant decline for several decades. Sea transportation was revolutionized after the
1950’s with container transports, and volumes have followed similar rates with air
freight; United Nations (2005b) estimates that the growth was 8.5 % per year during 80’s
and 90’s, while in the forthcoming years we could expect slightly lower growth rates, 6.6
%. However, it is important to note that in railroad freights, although there exist a
demand for increased international transportation, the proportional share and absolute
amount of railroad freights have been in constant decline, e.g. in Europe. A number of
different authors argue that this decline has been due to the collapse of
communism/socialism, and overall changed production structures as European economies
have developed via agriculture to industrial and further on to information/service
economies. We can not argue against these factors; however, the reason for this declining
development in the business side has mostly been the lack of international cross-border
scheduled routes as well as the flexibility to connect railway freights to other
transportation modes.
7
Figure 1.
World trade and GDP development. Source: World Trade Organization
Although, the developing nations, like China as well as India are showing remarkable
growth rates, our world is still organized in a rather triad manner. Like Ohmae (1985)
argued that fifteen original members of EU, USA and Japan rule the world, as we think it
through of world’s GDP. This is still the story, as Table 1 illustrates: Total GDP from
these countries is still near of 70 %, while during 80’s this figure was five percentage
points higher. So, the developing world is getting richer, but with rather slow speed (in
absolute terms), and formerly mentioned three regions still make the most important
economic decisions in the world, and hold their significance in transportation flows.
However, within the next five years, we could expect that these rapidly developing
economies are taking even larger share from world economy, and also traffic flows. This
has already occurred in the sea transportation side; from TOP20 container ports (United
Nations 2005a: p. 76), 12 are located in Asia, and six in China alone. Correspondingly
only seven ports from the economic triad make the list, three from both US as well as
Europe, and one from Japan. Change has been enormous; three decades ago (during year
1976) North America and Europe had above 60 % share from container traffic (Rodrigue
1997). During 90’s situation changed so, that Asia took the similar amount proportional
8
share from container transports. It is good to remember that volume of container
transports have multiplied more than four times during these 20 years.
Table 1.
European Union 15 countries, USA and Japan, and their respective Gross
Domestic Products, comparison to world total. Source: Statistics Finland
(2006).
1999
8,648,231
9,268,425
4,471,201
2000
7,996,255
9,816,975
4,750,191
2001
8,044,712
10,127,950
4,167,494
2002
8,784,353
10,469,600
3,980,206
2003
2004
10,684,165 12,274,554
10,971,250 11,734,300
4,299,732 4,671,198
2005 (est.)
12,672,476
12,452,417
4,672,291
Total
Percent from total
22,387,857
72.77%
22,563,421
71.55%
22,340,156
71.59%
23,234,159
71.71%
25,955,147 28,680,052
71.68%
70.08%
29,797,184
67.84%
Whole World
30,767,197
31,535,529
31,203,983
32,400,683
36,211,676 40,925,893
43,920,000
EU-15
USA
Japan
Transportation traffic imbalance has been under interest in the continental
perspective, since the starting of Japanese exports to US with significant manner in 60’s
and 70’s. This in the end resulted in the legislation that e.g. Japanese car manufacturers
were forced to establish own factories (could be characterized as screw-driving assembly
places) to US soil to prevent increasing import taxes. However, traffic imbalance has
continued in US case with both Asia, but as well with Europe. As Figure 2 illustrates, sea
container traffic alone is three times higher from Asia to US than vice versa. However, in
year 2004 from Europe sea container traffic was above 50 % more than from US to
Europe. It should be remembered that the valuation of US currency was in relatively low
levels, as compared to Euro and Japanese Yen, and “traffic unbalance” should be at
relatively low level then (since it favours US manufacturing units). Thus, until last year
Chinese Yuan was having fixed rate with respect of US dollar, and simplistically
speaking China and US were the same “common” trade area. Interestingly, European and
Asian container traffic is nearest of balance, although, Europe does export more to Asia
than other way around. Imbalances in world traffic flows lead into increased
transportation costs, since empty transports increase significantly. For example, United
Nations (2005) have estimated that during previous years empty container movement has
been on the range of 20 to 22 % in the world scale. In the end it is good to remember that
large world-wide corporations hold the key in transport decisions; their internal material
9
movements account majority from foreign trade of US, Japan and Europe (Barros &
Hilmola 2003).
TE
U
M
TE
U
5.
6
M
M
8.
4
3
4.
U
TE
Figure 2.
M
Europe
8
.7
11
TE
U
Asia
3 M TEU
1.8 M TEU
USA
Trade imbalance between three major continents is great, container
transports (Twenty-feet Equivalent Units) in year 2004. Source: United
Nations (2005b)
Among continents, traffic unbalance exists also between countries; for example,
Finnish-Russian traffic could be considered as one good example. Kilpeläinen (2004)
estimated that road transit traffic from Finland to Russia was 17.5 times larger than vice
versa. So, basically trucks traveled empty from Russia to Finland, in order to take the
load from some harbour (e.g. Hamina, Kotka, Helsinki or Hanko), and continue with full
load to Russia. Traffic unbalance problem is created by the structure of Russian national
economy and well-developed Northern-Europe; prestigious raw material base favors sea
(54 % from the value of Russian import to Finland) and rail (22 %) as transportation
modes, and ignores road transportation (9 %). In contrary Finnish export relies on the
road transportation side (86 % from the value of Russian import to Finland), and rail as
well as sea has much smaller share (approx. 6-7 % share each). As a solution, some of the
local development programmes have chosen rail transportation as a key to unbalanced
10
traffic problem. For example, Innorail in Kouvola, Finland, has attracted shareholders
from Russia, China and Japan to develop Trans-Siberian Railway to serve container
traffic between Finland, Russia and China (as well as near-by Asian countries). It is a
well-evident fact that further development of the Russian distribution system is in larger
extend dependent on railways, and interestingly rail container traffic between Finland and
Russia has increased in seven years by five times to 100,000 TEU. However, during year
2006 this traffic has slowed down, due to the reason of increased tariffs. In the end of
90’s United Nations (1999a) estimated that below 5 % of container transports between
Europe and Asia uses railway route through Russia, and at the moment this figure is
nearer to 1 %.
11
3. Literature Review – Business Logistics
Issues relating to centralization and decentralization have been considered as one of the
most important issues in business logistics, particularly concerning physical distribution
and multinational manufacturing companies. In practice the issue of inventory
centralization/decentralization is closely related to the problem of inventory push/pull
deployment and to make to order/make to stock options to achieve as short time-to
market lead time as possible (Wanke & Zinn 2004: 466, Lemoine & Skjoett-Larsen 2004:
794). However, cost efficiency and economies of scale in manufacturing are not costless
due to “global delivery responsibility”. Most companies prefer to have decentralized
inventory systems to centralized one in their supply chains (Rajesh & Fu 2005: 598).
Multinationals with several different product families and a “decentralized” distribution
inventory structure could observe increase of inventory and transportation costs, and fill
rates can be quite low as well (see the illustration in Figure 3 in below for four product
families and two alternative distribution policies). The constrains may well turn into
negative risks and cause in reality lost capacity, transport and subcontracting premiums
and suboptimal use of labor (Disney et al. 2006: 152). This is the case especially in
Russia (see for example Toikka & Ivanova 2006: 40-41).
The effect of distribution centralization has long been an area of logistics research. In
the 1970’s, a classical work in this area was published (Maister 1976), arguing that
inventory will decline according to the “square root law”. Mathematically, the new
inventory level can be calculated as given below.
INV = 1- [(m/n)]
where
INV = inventory reduction due to centralization
m
= number of locations after consolidation
n
= number of locations before consolidation
Source: Maister, 1976
THE SQUARE ROOT LAW
(1)
12
This simple formula relies on numerous assumptions, as one might expect. For
instance, demand for different product families is assumed to be independent from each
other, total demand also remains constant, and so on (see Evers & Beier 1993 for a full
list). These assumptions can also be quite unrealistic, for instance the independence
among demand patterns (products may have positively or negatively correlated demands)
and so on. However, the purpose of including the equation in here is that it shows a
simple relationship between spatial decisions concerning warehouse location and the only
costs that are additive from the micro to the macro-level, i.e. inventory costs. In short,
space will seriously affect inventory costs and these costs will propagate through the
economy through the supply chains (see also Buxey 2006). In the hypothetical example
given in Figure 3, total inventory should decline about 50 percent due to centralization. In
addition, there should be an increase in blue-collar worker productivity at the warehouse,
increased invested capital returns, all due to the economies of scale.
Product
family I
Manufacturing
unit I
Product
family II
Manufacturing
unit II
Product
family III
Manufacturing
unit III
Product
family IV
Manufacturing
unit IV
Product
family I
Manufacturing
unit I
Product
family II
Manufacturing
unit II
Product
family III
Manufacturing
unit III
Product
family IV
Manufacturing
unit IV
Figure 3.
Asia Pacific &
Australia
Europe
Africa
Americas
Asia Pacific &
Australia
Distribution
center/”hub”
Europe
Africa
Americas
Multinational with four different product families, with specialized
manufacturing locations. Distribution can be either decentralized (above)
or centralized (below).
Sources: Albino & Garavelli (1993); Garavelli (2001)
13
In practice, shifts to centralized distribution are more often driven by external
pressure (e.g. customer service improvements) than simply an emphasis to decrease costs
and inventory investment. Discussion around square root law has continued since 1970’s
(see for instance, Das & Tyagi 1999; Hammel, Phelps & Kuettner 2002). Zinn, Levy &
Bowersox (1989) argued that the square root law is only a special case of the “portfolio
effect” shown in Equation 2 below. The most impressive decline in inventory investment
would be achieved when two different product families have negatively correlated
demand but the same standard deviation.
PE = 1 −
M 2 + 1 + 2 Mρ12
(2)
M +1
where
PE
Si
M
ρ12
=
=
=
=
portfolio effect
Standard deviation for product family i, i=1,2
S1/S2 , and
S1≥S2 S2≠0
correlation coefficient between product families 1 and 2
Source: Zinn, Levy & Bowersox, 1989.
Portfolio Effect Equation
Another recent model developed for the supply chain at business level has to do with
the demand amplification effect (see for example Korovyakovsky & Szoltysek 2006: 43,
Jäger & Ujvari 2006: 67, Lorentz & Riihinen 2006: 93, Towill 2005: 555). Demand
amplification is important in the sense that nowadays supply chains are increasingly
controlled via demand (Hesse & Rodrigue 2004: 175). This argumentation is generally
based on Forrester (1958), but numerous other researchers have further developed and
applied this theory (Towill, Naim & Wikner 1992; van Ackere, Reimer Larsen &
Morecroft 1993; Lee, Padmanabhan & Whang 1997; Lee & Whang 2000; Helo 2000;
Holweg & Pil 2001; Shapiro 2002; Swensson 2003; Dejonckheere et al. 2004; Zhang
2004). Generally, information sharing within the supply chain (or production system) is
the key factor for enhanced performance, and shorter, more responsive as well as
simplified supply chain/network structure. Benefits include lower levels of inventory,
14
higher delivery accuracy, lower total cost and higher revenue, all a result from smaller
demand variation, or alternatively, due to better information among parties (see for
example Mason et al. 2005: 142, Lasserre 2004: 82)
35
30
25
20
15
10
5
0
1
10 19 28 37 46 55 64 73 82 91 100 109 118 127 136 145 154 163 172 181 190 199
Customer
Figure 4.
Retail
Distributor
Wholesaler
Manufacturing
Forrester Effect (demand amplification, as customer demand increases
from four to eight in period of 101) with a Single Four-Staged Supply
Chain (Retailer-Distributor-Wholesaler-Manufacturer).
Fig. 4 illustrates the “demand amplification effect” within a supply chain. In this fourstaged supply chain, as “information distortion” continues to develop further, the two
final stages (wholesaler & factory) face dramatic changes. Demand from the factory itself
(fourth stage in this supply chain) is between zero and thirty units per time unit, meaning
that lead-times for placed orders change dynamically (if inventory levels are limited). In
this small chain, the effect goes through the retail, distribution and manufacturing sectors
but it could of course touch many sectors in the economy. Some preliminary evidence
from bullwhip effect on economics could be found from Ramey (1989); five different
recessions were analyzed in this research work, and retail, wholesale as well as
manufacturing inventories decreased nearly in all of the occasions. However,
interestingly Ramey (1989) found that labor is in several industrial sectors more flexible
15
resource as compared to different inventory types (raw materials/components, work in
process, finished), while work in process represents the most flexible inventory type.
16
4. Research Methodology
As North-European countries are so important for Asian traffic flows, we decided to
complete survey for the largest Finnish and Swedish companies. We chose TOP500 lists
from both of these countries (in Finland we used local business newspaper Talouselämä
and in Sweden Affärsdata database), and searched contact information for logistics
decision makers in these largest companies (similar questionnaire strategy in logistics has
been used before by Häkkinen et al. 2004). However, all 1000 companies were not
targeted with a survey, since financial companies (funds, investors, banks), service
companies, insurance companies, and electricity production and distribution companies
were basically out of our interest (simply, no significant traffic flows). Also during the
questionnaire we learned that a number of large retail companies, due to centralized and
outsourced purchasing, do not have any connection to traffic flow decisions, and were
unable to answer into our questionnaire. Also some other unhappy occasions happened,
i.e. order driven machine manufacturers (engineering to order or make to order
production control) argued that they are unable to estimate cargo flows in the five year
respect, and twenty feet containers are not a valid measurement unit for them. In number
of situations also large manufacturers argued that their logistical flows are controlled
from France, Germany or US, and therefore Swedish and Finnish representatives do not
have any knowledge, what the actual traffic flows are (as these business units are part of
larger global conglomerate). So, after these we were having all in all around 750
companies, which presented our target group in the questionnaire.
In the questionnaire we used a web-based survey format, meaning that all the answers
were collected through three identical web-pages (in Finnish, Swedish and English;
please see English version in Appendix C). We contacted companies mostly by email,
either directly to the logistics director or to the corporate communication or general
contact address. This email contact list required relatively large amount of work, since all
the addresses were collected via web search engine. As we started our questionnaire, and
sent first request for answers, we were amazed that even info addresses reached logistics
managers and directors. So, email forwarding works pretty well in Finland as well as in
Sweden! Two additional reminders for answering were sent after the first contact letter,
and in total we received 72 answers from population of 750. So, this corresponds to just
17
below 10 % response rate, which is rather conventional for web-based surveys (Häkkinen
et al. 2004). Five answers from 72 were entirely empty, so in reality total number of
responses was 67 (8.9 %). However, it should be reminded that our questionnaire was
rather long, and contained numerous detailed question areas (questionnaire, see Appendix
C). So, some of the companies answered only in general questions, and did not provide
any data on specific areas. Therefore, in some of the cases our response rate was around
40 (approx. 5.5 %), and in some 67.
In the beginning of the survey form, we had some background questions regarding to
the respondent itself, and the company. These revealed to us that responses were given
with minor proportion from directors, but mostly from managerial and blue-collar
workers. However, all the respondents had long experience working in the company, and
also in the logistics function (most of the respondents had over six years of working
experience with logistics issues). So, this observation confirms to us that the given
answers represent higher validity as experience is so long, and that companies have
interest towards our researched topic. For example, more than half of the respondents
indicated that they would like to receive questionnaire analysis results in the form of a
written report, and ten of the respondents agreed to act as a potential case study
companies in a future research works.
18
5. Empirical Data Analysis
Transportation and Warehousing
As some sort of background variable, share of transportation costs (not including
warehousing) in respondent companies, shows interesting results (Figure 5 in below). In
three observation points (or in a ten year time period), companies do not indicate that
large changes would happen in the transportation cost side. However, smaller interesting
trends could be identified: (1) companies which had previously very low amount of
transport costs, are facing increase, (2) companies which had very high transportation
costs are in contrary a bit decreasing, but (3) taking two lowest and two highest cost
groups together, the total “big picture” situation will not change that much. (See Figure 5
below).
100%
90%
80%
70%
60%
8- %
6-8 %
4-6 %
2-4 %
1-2 %
50%
40%
30%
20%
10%
0%
2001
Figure 5.
2005
2010
Share of transportation costs from revenues (year 2010 estimate, n= 61).
When examining warehousing costs the results extracted point to the same direction
as in the case of transportation costs: the data gathered from the three observation years
19
of target the responds of the firms enquired do not show remarkable shift in either
direction in warehousing. More detailed information can be drawn upon figures appeared
in below.
Percentage of warehouses
30 %
25 %
20 %
FIN
15 %
SWE
10 %
5%
Fi
n
Sw lan
e d
Es d e
to n
R n
Li u s ia
th si
ua a
Po nia
la
Un
n
ite Ge La t d
d r m v ia
Ki a
n n
Hugd o y
ng m
F a
De ra n r y
n ce
B e ma
Th
lg rk
e
Ne No ium
th rw
Cz
er a
la y
ec
h S n ds
Re pa
pu in
bl
i
I c
Tu ta ly
Aur key
s
G
Sw r tria
ize e ec
Ro rla e
m nd
Sl a n
o i
Sl va k a
ov ia
Be e n
ia
Uklaru
r
Po ain s
rtu e
Ire ga
la l
nd
0%
Country of location
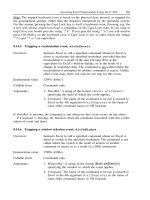
Figure 6.
The location of warehouses of Finnish and Swedish companies in Europe
(n = 55).
In Figure 6 above there is presented about how Finnish and Swedish businesses locate
their warehouses throughout Europe. The blue column represents the percentage of the
warehouses of Finnish firms whereas the red column depicts the same for Swedish
enterprises. At the first glance it can be concluded that currently Swedish and Finnish
companies prefer to have warehouses in their own countries while more or less ignoring
the chance of establishing distribution centres elsewhere. Finnish companies locate 26 %
out of their warehouses in their own home country. Swedish companies set 15 % out of
their distribution centres in Sweden. The number two country of location for Finnish
firms is Estonia, but only 9 % out of their warehouses can be found there. Swedish
enterprises prefer Germany as number two place to locate their distribution centres: there
are 8 % out of the total amount of warehouses of the Swedish companies. The United
Kingdom actually reaches exactly the same level of popularity among the Swedish
20
businesses. Almost as high score Norway, France and Finland. Lithuania, Russia and
Poland are on the other hand the fairly noticeable place to locate warehouses for Finnish
companies. On the basis of these result one can assume that Finnish firms prefer Central
and Eastern Europe (CEE) to Western Europe whereas Swedish companies opt for
Western Europe instead of CEE. At the same time there are quite many countries that do
seem to have minor role in the operations of Finnish and Swedish firms: one could refer
to for example Ukraine, Ireland, Portugal or Romania.
Additional valuable information can be extracted from our sample when applying chi
square test to the results we obtained from warehousing location. Table 2 describes four
fields in below: both Finland and Sweden have warehouses located in Western Europe as
well as Central and Eastern Europe. The numbers in the sector of 2×2 matrix depict the
amount of warehouses of companies have in that region of Europe. According to the
numbers Finnish companies have larger weight on warehouses in the region of CEE in
comparison to the amount of Swedish firms have (64 versus 18). The real difference
nevertheless is smaller as the sample of the test includes 153 Finnish warehouses and
only 97 Swedish ones. One other interesting observation is that in Western Europe there
is still substantially more distribution centres (168) than in the eastern part (82) of the
continent. At the same time the nature of the difference can be stated statistical
significance as according to the results the probability of having interrelations between
the behaviour of Finnish and Swedish businesses is smaller than 0.001%.
21
Table 2.
Country/
Region
Chi square test for the warehousing sample examined.
Western Europe
Central and Eastern
Europe
SWE
Actual observations: 79
Expected value: 65.2
Actual observations: 18
Expected value: 31.8
97
FIN
Actual observations: 89
Expected value: 102.8
Actual observations: 64
Expected value: 50.2
153
82
250
168
Total
Subtotals
30
Amount of Employees
25
20
2001
15
2005
2010
10
5
0
0-10
11-30
31-50
51-100
101 or more
Category Classes
Figure 7.
Average employment in the major warehouses of Finnish and Swedish
firms in Europe (n = 55).
In Figure 7 above the trend of employment in warehouses in Finland and Sweden is
examined. The examination points during the 10 year period are 2001, 2005 and 2010. In
each of these years the columns with different colours corresponds the category of the
size of warehouses. In a case of one cast a glance on the employability of warehouses of
22
the selected companies the results still point to the same direction: costs of warehousing
will not diminish in the future. This is despite the fact that there is an aim to keep the
workforce employed in these distribution points low: our analysis suggests that in 2010
firms are going to have only slightly larger workforce employed for their warehouses in
comparison to that of in 2001. This change can be spotted when looking at the long-term
trend of employment between 2001 and 2010: the amount of employees working in small
distribution centres will have small decrease while the amount of people in larger-scale
warehouses will grow correspondingly. Between this period especially the amount of
warehouses with 0 to 10 employee are about to decrease while the ones with over 101
employees and the ones employing 31-50 people are most likely to increase. In this
regard there are differences between the operation of Finnish and Swedish firms too: In
Finland the amount of warehouses with 11 – 30 employees will diminish whereas in
Sweden this number will increase by 2010. The most common class in all check points
(20001, 2005, 2010) is the one with 0-10 employees and the median class is in each case
the one with employees of 11 – 30.
45 %
40 %
35 %
30 %
Frequency
25 %
#1
# 2-5
20 %
15 %
10 %
5%
0%
r
l
r
l
y
e
n
n
n
n
ts
le
ct
on
tio
tio abou tatio abou
tio entia renta futur
r-b nne
os
ab
cti
ec
l
l
t
ea
/
r
ail nnec nnec
o
nc
ne
n
f
f
o
v
e
n
o
e
c
o
n
n
o
o
p
s
i
a
p
h
t
a
to
e
ut
co
co n co
co
st
ly
nts
ns
ity
tur for le ce in tion
bil
trib
tra w co road
o
pla easy wide ation
ila
a
al
a
l
a ti
r fu
dis ring
e
i
o
t
t
t
a
l
p
d
e
e
e
r
r
r
a
L
r
r
v
s
b
o
w
d
o
R
t
a
A
po
po
Lo factu s we ns a nsp
hin
ail
en
ns
erm
ns
o
int
tra a tra rs to re av gem ir tra
nu gistic oluti
r
d
a
r
o
a
f
a
e
A
m
la
lo
Se p p e
w
rt
ss
Ro
ly/
En
po
nd
es
tic
a
mb
up
us
ou ogis
ce
s
o
b
se
a
l
h
l
n
s
I
re
p
y
A
re
ctu
art
wa
ted
tru
dp
ec sific
s
l
r
i
a
e
r
S
Th
pe
Inf
ys
an
p
m
Location criteria
Co
Figure 8.
Criteria determining the location of distribution centres of the selected
group of Finnish and Swedish companies in 2006 (n = 43).
23
In Figure 8 above there are two dimensions are measured: the blue column reflect
each individual criteria as number one decisive factor in the decision making process of
these selected companies whereas the red columns mirror the aggregated importance
(from no.2 to no.5) of a criteria in the location decision of the targeted firms. There seems
to be four major decisive factors considered as number 1 issue: low distribution cost,
assembly/manufacturing plants near by warehouse, the possibility of inbound logistics to
be connected, and third party logistics solutions availability. For these the criteria of
“low distribution costs” is clearly the single most important factor in the decision making
process of locating warehouses. At the same time it is interesting that road connection is
far behind in terms of being the number one criteria, but when looking the aggregated
indicator – the red column – it is the most marked one. This means that companies don’t
consider each transport mode as an independent entity but they want to optimize the
whole system to reach lower distribution costs. Third party service providers are a
popular option nowadays to achieve this goal. It is also seen as necessary in many cases
that the warehouses are near by to the assembly plants and this is the reason why most of
the warehouses of Finnish and Swedish companies are found in Finland and Sweden.
On the other hand according to our results there are plenty of issues that are not
considered at any extent when making the decision about locating a warehouse.
Companies know that there will be no lack of skilled workforce and they are ready to pay
as much as it needed to hire the right person for the right tasks. The infrastructure for
intermodal transportation is not an issue on the desks of managers either. The most
surprising matter here is the result according to which railroad connection is not held to
have any relevance in the decision making process for locating new warehouses. This
outcome can be interpreted in a way that railroad is a completely neglected option and its
role can be extended very much as soon as companies realise the benefits offered by it: it
is far cheaper than air connection and substantially quicker then transport done by means
of ships. It can be stated however that especially Finnish companies will have to opt for
railroad much more in the future as the Russian transport infrastructure relies in major
extent on railways as above stated. Also integration issues of factories located in Russia
becomes less troublesome with railways. So, although companies currently think that
railways are less significant in warehouse location decision making, but this could