Profitability of banks in India: Impacts of market structure and risk
Bạn đang xem bản rút gọn của tài liệu. Xem và tải ngay bản đầy đủ của tài liệu tại đây (1005.78 KB, 22 trang )
Journal of Applied Finance & Banking, vol. 9, no. 6, 2019, 181-202
ISSN: 1792-6580 (print version), 1792-6599(online)
Scientific Press International Limited
Profitability of Banks in India: Impacts of Market
Structure and Risk
Santanu Kumar Ghosh1 and Santi Gopal Maji2
Abstract
This paper investigates the impacts of market structure and risk on profitability of
Indian banks after controlling the influences of some bank specific and
macroeconomic determinants. Employing two-step Generalized Method of
Moments (GMM) system estimator on a data set of 40 listed Indian commercial
banks over a period of 15 years (2002 – 2016), our results suggest that there is a
moderate degree of persistence of profit in Indian banking sector during the study
period. We find significant negative impact of bank risk on profitability in the
Indian banking Industry. With regard to the influence of market structure, the
study observes negative association between concentration and profitability and
thus, our finding does not support the traditional SCP hypothesis. Regarding the
other explanatory variables, the findings show that diversification and
capitalization positively influences profitability of Indian banks. In contrary,
employee productivity and growth in GDP have negative influence on profitability.
On the other hand, the study fails to discern any significant impact of liquidity and
bank size on the profitability of Indian banks.
JEL classification numbers: G21, D4
Keywords: Market Structure; Structure-Conduct-Performance Hypothesis;
Efficient-Structure Hypothesis; Bank Risk; Bank Profitability; Generalized
Method of Moments.
1. Introduction
The growth and development of any economy depends upon its stable and sound
1
2
Professor, Department of Commerce, University of Burdwan
Assistant Professor, Department of Commerce, North Eastern Hill University, Shillong, India
Article Info: Received: March 7, 2019. Revised: July 15, 2019.
Published online: September 10, 2019.
182
Santanu Kumar Ghosh, et al.
banking system. Due to the several financial crises observed in different countries,
impacts of risk and market structure on bank profitability have evoked much
interest among the regulators and scholars in recent times [1, 2]. Empirical
literature provides two contrasting hypotheses relating to the association between
market
structure
and
profitability
of
banks.
The
traditional
structure-conduct-performance (SCP) hypothesis states that market structure
influences the competitive behaviour which further affects the bank profitability.
This is because highly concentrated banking structure encourages banks to collude
with each other to earn more profit. The SCP hypothesis, thus, advocates that bank
profitability is derives from market structure and in a highly concentrated market
or in a less competitive market banks can earn higher profit as compared to banks
working in a competitive market irrespective of their efficiency. Market
concentration and profitability according to this hypothesis is positively associated.
As an alternative to SCP hypothesis, the efficient-structure hypothesis (ESH),
developed by Demsetz [3], advocates that bank profitability is derived from the
degree of efficiency rather than concentration. Plethora of empirical studies has
examined the influence of market structure on the profitability of banks; the
results are however mixed supporting both the hypotheses [2,4,5,6].
On the other hand, risk management has long been a focal point for policy makers
and academicians as the extent of risk affects the profitability of banks at the
micro level and viability of the economy at the macro level. Credit risk is the
oldest risk of banks and it is the combined outcome of default risk and exposure
risk [7]. However, banking sector all over the world has witnessed sea change due
to growing competition and fast changes in the operating environment under the
impact of deregulation, technological advancement, and innovation in financial
products and services in recent past and banks are compelled to encounter various
types of risk like liquidity risk, operational risk and market risk apart from credit
risk. Due to the interrelationship between the various types of risk, failure of
managing one risk may invite another risk and ultimately banks face the risk of
insolvency [8]. The recent financial crisis has refocused attention on the
importance and impact of banks’ insolvency risk [2, 9, 10]. Large number of
researchers has investigated the impact of risk on the profitability of banks and
barring a few cases the researchers have advocated the significant influence of risk
on profitability [2, 11, 12, 13].
Against this backdrop, the present study is a modest attempt to investigate the
impacts of market structure and risk on the profitability of listed Indian
commercial banks after controlling the influences of some bank-specific and
macro-economic factors. The selection of Indian banks for the present issue is of
interest for several reasons. First, Indian banks play a vital role for the
development of Indian economy as evident from the various economic survey
reports of the Government of India. Second, several rounds of banking reforms in
India since 1991 pertaining to introduction of capital regulation, deregulation of
interest rates, emergence of new private sector banks, opening up of branches of
foreign banks and increasing use of technology have aimed to create a competitive
Profitability of Banks in India: Impacts of Market Structure and Risk
183
structure in the sector and to improve the bank performance. Third, the empirical
literature indicates that the degree of competition in the Indian banking sector has
increased during the last two decades [10, 14]. Indeed, as per the Bank-Scope data
at the end of 2015, five bank concentration ratio based on assets in India (45.32%)
is considerably less than other emerging markets like Brazil (80.47%), China
(52.52%), Russian Federation (53.26%), South Africa (98.99%), Pakistan (63.22%)
and Malaysia (73.56%). Thus, the concentration in the banking sector is relatively
less in India and quite similar to United States (46.53%). However, the empirical
evidence on the influence of market competition on profitability of banks in India
is scanty. Fourth, Indian Economic Survey report of 2014-15 states that India has
witnessed a credit boom in terms of bank lending in recent past, with the share of
credit to GDP increasing from 35.5 percent in 2000 to 52 percent in 2015. Since
the interest on loan is the main source of bank income, by increasing loan growth
banks can enhance net cash flow, which in turn improve the profitability of banks.
Alternatively, as [15] observed, loan growth is positively associated with loan loss
which may influence profitability negatively. It is, thus, imperative to examine the
consequence of high bank lending on the profitability of Indian banks. Finally,
several measures have been undertaken by RBI and the Central Government to
minimize credit risk of Indian banks, such as setting up of Board for Industrial and
Financial Reconstruction (BIFR), Securitization and Reconstruction of Financial
Assets and Enforcement of Security Interest (SARFAESI), The Debts Recovery
Tribunal (DRTs), The One Time Settlement Policy (OTS) etc. Nevertheless, the
Economic Survey report of 2016-17 has clearly indicates the increase in NPAs in
recent times as the alarming factor for the financial stability of the banks in India.
The rest of the paper is organized as follows. Section 2 provides the review of
empirical literature. Section 3 is devoted to data and methodology adopted in this
study. Results and discussion are resented in Section 4, followed by concluding
remarks in Section 5.
2. Review of Literature
2.1
Empirical measurement of bank profitability, market structure and
risk
Plethora of empirical studies has investigated bank profitability in both emerging
and developed countries. The empirical literature can be grouped into two
categories. One group has given importance on the determinants of bank
profitability of a single country [2, 16, 17, 18, 19], while the other group focuses
on the examination of bank profitability in several countries [1, 20, 22]. However,
return on assets (ROA), return on Equity (ROE) and net interest margin (NIM) are
the commonly used measures of bank profitability in the literature. ROA has
become the key indicator of bank profitability and it measures the efficiency of
banks’ in utilizing its resources for generating profit [22, 23]. As an alternative
measure of bank profitability, ROE is also widely used in the empirical literature
184
Santanu Kumar Ghosh, et al.
that emphases how efficiently bank utilizes shareholder’s fund in generating return.
The third measure of bank profitability is the NIM, which is defined as the
difference between interest earned on loans & advances and interest paid on
deposits divided by interest earning assets. While ROA focuses on the profit
earned per amount of investment in total assets, NIM reflects the efficiency of the
bank in utilizing its investment resources [24].
A number of methods have been used in the empirical literature to estimate the
market structure in the banking sector that can be categorised into two major
streams: structural approach and non-structural approach. The structural approach
is based on the structure-conduct-performance (SCP) hypothesis, which assumes
that market structure affects banks’ behaviour, which in turn determines their
performance. Hirschman-Herfindahl Index (HHI) and concentration ratio (CR) are
the two widely sued measures of bank concentration [2, 10, 13, 19]. HHI and
CR as the measure of market structure is based on the idea that a
highly-concentrated banking sector (with a few banks occupying significant
market shares) can weaken competition and higher concentration in the market
leads to greater market power resulting in collusive behaviour and excess profits
for banks. In an industry with n banks, the maximum possible value of the HHI is
1, while its minimum possible value is 1/n. The higher value of HHI indicates
greater market concentration or lower level of competition. On the other hand, CR
ranges from 0 to 1, with higher value indicates lower competition or greater
concentration. On the other hand, non-structural approaches have been developed
by the New Empirical Industrial Organization (NEIO) studies. The Panzar-Rosse
approach, which is widely known as H-statistic [25] and Lerner index are two
commonly used non-structural measures of competition.
For measuring bank risk, empirical literature has given importance on credit and
insolvency risks of bank. Since the genesis of credit risk is the lending activates of
banks, non-performing assets (NPAs) ratio is widely used in the empirical
literature to measure banks’ credit risk [10]. Recent research in banking literature
emphasizes on measuring insolvency risk of banks that takes into consideration
the impact of credit risk and other risks faced by the banks. The popular measure
of bank insolvency risk in the literature is Z-statistic suggested by [26] and
subsequently used by many researchers [9, 10]. Z-Statistic is employed to describe
bank’s distance-to-default by encompassing three important factors banks’
return on assets, volatility of return and the capital base. The higher Z- Statistic
indicates lower insolvency risk and vice versa.
2.2
Empirical literature on impacts of market structure and risk on bank
profitability
In the empirical literature, bank profitability is considered as a function of internal
and external factors, although a large part of the studies have explored the
influence of the internal determinants on bank performance [22]. Among the
external factors, researchers have considered industry-specific and
macroeconomic determinants of bank profitability. Market structure is an
Profitability of Banks in India: Impacts of Market Structure and Risk
185
important industry-specific determinant of bank profitability. However, the
influence of market structure on bank profitability is a controversial issue in the
extant literature as it is derived from two contrasting hypothesis. According to
SCP hypothesis, in a concentrated market or when the competition is low, banks
can offer lower rate of deposit and charge higher rate of interest on loans and
advances. Thus, banks have the ability to extract higher economic rent, which in
turn leads to earning monopolistic or abnormal profit [2]. According to this
hypothesis, there is a positive association between market concentration and bank
profitability. Plethora of empirical evidences provides support in favour of SCP
hypothesis [4, 5, 27, 28].
But the efficiency school of thought challenges the SCP theory that higher
concentration leads to higher profitability. The efficient structure hypothesis (ESH)
[3] states that higher profits generated by firms due to higher efficiency and not
due to the concentrated market. The basic idea of this proposition is that if the
efficiency of a firm is higher than its competitors, the firm is able to maximize
profits and enhance its market share [4]. Empirically [29] in case of banks in Latin
America and [30] for banks in Sri Lanka find evidence in support of efficient
structure hypothesis. Likewise, the findings of [17] in the context of banks in
Japan also observe inverse association between concentration and profitability
using two-step system GMM model. [2] also in case of banks in China conclude
that the findings do not support the traditional SCP hypothesis and the efficient
structure hypothesis may be prevailed in the sector.
In Indian context, many researchers have examined the influence of capital
regulation on the financial soundness of banks [31, 32] and also the competition in
the Indian banking sector [13, 14]. On the other hand, some researchers have
considered only the influence of internal factors on profitability [like18]. But the
empirical investigation on the determinants of profitability of Indian banks
considering both internal and external factors is scanty. [19] have investigated the
influence of both internal and external factors on profitability of Indian
commercial banks and the findings of the study support the traditional SCP
hypothesis. However, the study considers only one measure of competition (HHI)
and fails to check robustness of the results. Further, due to the dynamic nature of
the market more empirical evidences are required to get idea about the influence
of the changing behaviour of market structure on the profitability of Indian banks.
On the other hand, the association between bank risk and profitability is an
extensively investigated research topic in the extant literature. However, empirical
literature relating to the association between bank risk and capital can be divided
into two streams. One group focuses on the influence of profitability on the risk of
banks based on the logic that in the event of sound financial condition banks try to
decrease the risk by not indulging into risky projects and hence there is an inverse
association between profitability and risk. Empirical results, however, show
contradictory findings. For instance, [11] in case of Nigerian banks, [12] in the
banking sectors of Bangladesh and [10] in case of Indian banks find inverse
association between profitability and credit risk. In contrary, the findings of [33]
186
Santanu Kumar Ghosh, et al.
for the banks in Ghana indicate positive association between profitability and
credit risk. On the other hand, [34] for the banks of Palestine find insignificant
association between profitability and credit risk. Another group investigates the
impact of bank risk on profitability on the logic that higher risk reduces the
interest spread and consequently leads to decline in bank profitability. Empirically
many researchers [17, 2, 30 and 5] observe negative influence of risk on
profitability. In Indian context also some researchers [18, 19] find evidence on the
inverse association between bank risk and profitability. However, in both the cases
researchers focuses on the credit risk of banks. Since the recent empirical
literature gives more emphasis on the insolvency risk of banks, the present study is
a modest attempt to enrich the empirical literature by providing evidence of the
influence of both credit risk and insolvency risk on profitability of Indian banks.
Empirical literature also indicates that other bank specific factors like bank size,
liquidity, capital ratio, diversification and employee productivity are the well
explored internal factor affecting profitability in the empirical literature [2, 16, 17,
22, 35]. However, the researchers observe mix results relating to the influence of
all these variables on bank profitability. Among the macroeconomic determinants
of bank profitability, GDP growth rate is widely used in the empirical literature.
During the period of growth in GDP or sound economic conditions the demand for
lending increases and since the inflow of money is high, the repaying ability of
borrowers is also increases, which increases the net earnings of banks. Thus there
is a positive association between growth in GDP and bank profitability. However,
empirical literature provides mixed results. While [2, 16] observe positive impact
of growth in GDP and bank profitability, [17, 36] find negative association.
3. Data and Methodology
3.1
Data and study period
The study is based on secondary data on 40 listed Indian commercial banks (24
public sector banks and 16 private sector banks) for a period of 15 years from
2002 to 2016. While bank specific data are collected from Capitaline Plus
Corporate database, macroeconomic data are collected from various economic
survey reports of Government of India. We have considered all listed Indian
commercial banks over the study period except Standard Chartered Bank, which is
the only foreign bank listed in India. These listed banks hold more than 90% of the
assets of Indian commercial banks. We use a balanced panel data in this study.
3.2
Variable selection
3.2.1 Response variable
Since the main aim of this paper is to investigate the impacts of market structure
and risk on the profitability of Indian commercial banks after controlling the
influence of other bank-specific and macro-economic variables, profitability is the
response variable of this study. Three profitability indicators are considered in this
Profitability of Banks in India: Impacts of Market Structure and Risk
187
study: return on assets (ROA), return on equity (ROE) and net interest margin
(NIM). These three measures are widely used in the empirical literature [2, 16, 17,
18]. ROA is defined as the ratio between operating profits to total assets. On the
other hand, ROE is measured by dividing net profit by shareholder’s equity and
NIM is the ratio of net interest income to earning assets, where net interest income
is the difference between interests earned and interest expenses.
3.2.2 Bank-specific determinants of profitability
Risk: We use the ratio of net non-performing assets to net advances (NNPA) as a
proxy for banks’ credit risk. As already explained, this measure is widely used by
the researchers for measuring credit risk. As the recent literature provides
emphasis on the measurement of insolvency risk to capture the overall risk
exposure of banks, we use the Z-statistic as the measure of bank insolvency risk.
Z-statistic is suggested by [26] and subsequently used by many researchers for
measuring bank’s insolvency risk [2, 9, 10]. Z-statistic takes into consideration
three important factors: return on assets, capital base and volatility of return. It is a
measure of safety index and higher Z- statistic indicates lower insolvency risk and
vice versa. Z statistic is computed based on the following:
𝑍 − 𝑠𝑡𝑎𝑡𝑖𝑠𝑡𝑖𝑐 = 𝐿𝑛 [
𝑅𝑂𝐴 + 𝐶𝑇𝐴
] … . (𝑖)
𝜎𝑅𝑂𝐴
Where, ROA is the return on assets; CTA is the capital to asset ratio and 𝜎𝑅𝑂𝐴 is
the rolling standard deviation of ROA of three years t, t-1 and t-2. Since the
observed Z-score is found to be positively skewed, natural logarithm of Z score is
used to obtain symmetric distribution [9]. Since the empirical literature exhibits
negative influence of risk on profitability, we also expect that the influence of risk
on profitability is negative in Indian context.
Bank size (SIZE): The natural logarithm of total assets is used to measure the bank
size. This measure is widely used in the empirical literature [2, 10, 16]. Since the
extant literature provides evidence in support of both positive as well as negative
influence of size on bank profitability, we have no prior expectation on the
influence on size on profitability of Indian banks.
Liquidity (LR): We use the ratio of total loans to total assets for measuring
liquidity [1, 2, 17]. Since the empirical literature indicates that the association
between liquidity and profitability can be positive as well as negative [2, 35], we
have no prior expectation about this variable.
Diversification (DIVR): The ratio of non-interest income to gross revenue to
measure this variable. This measure is used by [2, 17]. Alternatively [1] has used
the ratio between non-interest income and total assets. Although there is an
alternative argument relating to the influence of diversification on profitability
based on the competition in the market, we expect this relationship to be positive
as higher the share of non-interest income in total revenue, the higher is the
profitability.
188
Santanu Kumar Ghosh, et al.
Capitalization (CAP): We use the ratio between equity capital to total assets as a
proxy for capitalization [2, 16, 17]. Although the impact on capitalization on
profitability is a debatable issue in the empirical literature, large part of the earlier
studies provide evidence in support of positive association between the two [17,
21, 22, 35]. Hence, we expect positive influence of capitalization on bank
profitability.
Employee productivity (EP): We measure this variable by the ratio of business per
employee, where business is defined as the summation of deposits and loans.
Although profit per employee is used in the earlier literature to measure this
variable [2], we consider two main activities of the banks performed by the bank
employees i.e. deposit mobilization and issue of loans and advances. Generally,
higher the business per employee, higher should be the profitability of banks.
However, the actual profitability depends upon the efficient utilization of the
resources productively and in the event of high non-performing loans, the
association can be negative. So, we have no prior expectation about this
association.
3.2.3 Industry-specific and macroeconomic determinants of bank
profitability
Market structure: We employ Herfindahl– Hirschman Index (HHI) and
concentration ratio (CR), which are widely used in the empirical literature for
measuring market structure [2, 10]. We compute HHI based on total assets, known
as Herfindahl– Hirschman Asset Index (HHITA), by employing the following
formula:
𝑛
𝐻𝐻𝐼𝑇𝐴 = ∑ 𝑆𝑖2
… (𝑖𝑖)
𝑖=1
Where 𝑆𝑖 is the market share of firm i in the market and n is the number of firms.
In an industry with n banks, the maximum possible value of the HHI is 1, while its
minimum possible value is 1/n. The higher value of HHI indicates greater market
concentration or low level of competition.
For computing concentration ratio, we use three bank concentration ratio based
total assets (CR3TA) by employing the following formula:
3
𝐶𝑅3𝑇𝐴 = ∑
𝑆𝑖 … (𝑖𝑖𝑖)
𝑖=1
Where 𝑆𝑖 is the market share of ith largest banks in terms of total assets.
Concentration ratio ranges from 0 to 1, with higher value indicates lower
competition or greater concentration.
Since the empirical literature provides two contrasting views about the influence
of market structure on the profitability of banks, we do not have any prior
expectation on the sign of this variable.
Growth in GDP (GGDP): We collect the data on growth in GDP during the study
period from the various economic survey reports of the Government of India. As
already discussed, empirically researches observe both positive and negative
Profitability of Banks in India: Impacts of Market Structure and Risk
189
influence of growth in GDP on bank profitability [2, 16, 17, 36], we do not have
any prior expectation about this association.
3.3
Empirical model
In the empirical literature, many researchers have used panel data model
employing fixed effects or random effects. However, bank profits tend to persist
over time [17, 27] and hence static panel model based on least square estimation
would produce biased and inconsistent result. Thus, we adopt a dynamic
specification model by incorporating a lagged dependent variable among the
covariates. The model is specified as:
𝑗
𝑘
𝑚
𝜋𝑖,𝑡 = 𝛼𝑖 + 𝛿𝜋𝑖,1−1 + 𝛽1 𝑋𝑖,𝑡 + 𝛽2 𝑋𝑖,𝑡
+ 𝛽3 𝑋𝑖,𝑡
+ 𝑣𝑖,𝑡 + 𝜇𝑖,𝑡 … (1)
Where i refers to an individual bank (i = 1,…..,N) and t indicates time (t = 1,….,
T). 𝜋𝑖,𝑡 represents profitability of bank i at period t. 𝜋𝑖,1−1 is one period lag of
profitability. This makes the specification dynamic and the coefficient 𝛿
indicates the speed of adjustment. The value of 𝛿 ranges from 0 to 1 with a
higher value indicates lower adjustment speed and less competition in the market,
while a value close to 0 demotes higher adjustment speed and greater competition
𝑗
[2]. 𝑋𝑖,𝑡 represents bank specific determinants of profitability. In this study bank
specific determinants are risk (NNPA and Z-statistic), bank size (SIZE), liquidity
(LR), diversification (DIVR), capitalization (CAP) and employee productivity.
𝑘
𝑋𝑖,𝑡
is the industry specific determinant, which is market structure (HHITA and
𝑚
CR3TA) in the present context. Again, 𝑋𝑖,𝑡
represents macroeconomic
determinant, i.e. growth in GDP (GGDP). 𝑣𝑖,𝑡 and 𝜇𝑖,𝑡 are the unobserved bank
specific effect and the idiosyncratic error.
Two regressors in the model, namely capitalization and risk, may potentially
suffer from endogeneity. This is because bank can increase its profitability by
enhancing capital base and its reverse causality can also be true in the sense that in
the event of higher profitability bank can improve its capital base through retained
earnings. On the other hand, high NPAs or high credit risk may affect profitability
negatively. Alternatively, when the financial condition is sound or profitability is
high, bank may try to reduce its risk by not investing into risky project. Thus, in
order to address the problems of endogeneity, unobserved heterogeneity and profit
persistence we adopt two-step System Generalized Method of Moments (System
GMM) estimator to conduct our analysis based on the work of [37].We use
System GMM as this model permits to use more instruments and can produce
more precise estimation [38]. In order to test the validity of the model we conduct
second-order autocorrelation test and to ensure the validity of the instrumental
variables we conduct Sargan test of over identifying restrictions.
190
Santanu Kumar Ghosh, et al.
4. Results and Discussion
4.1
Summary statistics
In order to explore the features of empirical distribution of the response and
covariates used in the study, univariate descriptive and robust statistics are
computed and the results are shown in table 1. The maximum and minimum
values of the three profitability measures (ROA, ROE and Spread) indicate the
existence of both profitable and non-profitable banks in the data set. Further, near
equality of mean and median values in case of spread and ROA indicates that the
distribution of the variables is almost symmetrical. The observed values of
skewness also demonstrate the same. However, in case of ROE the distribution is
found to be relatively more skewed. A look into the explanatory variables, the
assumption of symmetry may be tenable in all the cases except for capital ratio
(CAP). The longer right tail in case of CAP (skewness is 1.743) indicates that
some banks have maintained very high capital ratio. The mean values of HHITA
and CR3TA are respectively 0.0716 and 0.3371. As per the general interpretations
of HHI and CR, the market structure of Indian banks during the period is found to
be less concentrated. On the other hand, the observed mean and maximum values
of NNPA implies that the percentage of net NPAs is still quite high for Indian
banks.
Table1:
Variables
ROA
ROE
NIM
Z Statistic
NNPA
HHITA
CR3TA
SIZE
LR
DIVR
CAP
EP
GGDP
Minimum
-0.0318
-0.4410
-0.0037
-1.099
0.0100
0.0617
0.3040
7.0734
0.3479
0.0475
0.0035
1.2500
3.8800
Descriptive statistics
Maximum
0.0408
0.3726
0.0529
6.5290
16.310
0.0918
0.3829
14.976
0.8464
0.3472
0.3485
26.210
9.5700
Mean
0.0092
0.1390
0.0253
3.4595
2.2913
0.0716
0.3371
11.334
0.6729
0.1408
0.0593
7.7595
7.1729
Median
0.0094
0.1407
0.0254
3.4348
1.8905
0.0706
0.3452
11.371
0.6932
0.1327
0.0530
7.0201
7.2400
Skewness
-0.723
-1.026
-0.050
-0.034
1.084
0.983
0.098
-0.171
-0.592
0.656
1.743
0.901
-0.349
Since the prime objective of this study is to examine the influence of the market
structure and risk on the profitability of Indian banks, apart from summary
statistics, we have explored in details the movement of three profitability measures
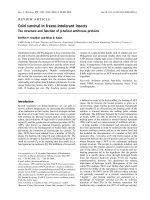
along with the two main covariates of the study. Figure 1 shows the movement of
ROA and NIM of listed Indian commercial banks during the period 2002 to 2016.
ROA has increased during 2002 to 2004, remained more or less constant during
Profitability of Banks in India: Impacts of Market Structure and Risk
191
2005 to 2011 and then declined gradually over the years. In case of NIM also, an
increasing trend is noticed during the initial years and remained almost constant
during 2004 to 2015. However, it has declined in the year 2016 as compared to the
previous year. For ROE (figure 2) the observed trend is quite similar to that of
ROA. The downward movement of ROE is very obvious since 2011 and it is close
to zero at the end of 2016. The movement of three profitability indicators of
Indian banks clearly indicates that in recent times average profitability shows a
declining trend although it was remained stable during the middle periods of the
study.
0,02
2016
2015
2014
2013
2012
2011
2010
2009
2008
2007
2006
NIM
2005
0
2004
ROA
2003
0,01
2002
Value
0,03
Year
0,250
0,200
0,150
0,100
0,050
0,000
2016
2015
2014
2013
2012
2011
2010
2009
2008
2007
2006
2005
2004
2003
ROE
2002
Ratio
Figure 1: Movement of ROA and NIM
Year
Figure 2: Movement of ROE
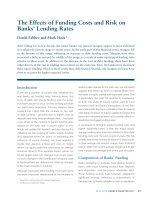
Now we look at the movement of bank risk and market structure during the study
period. To look into the distribution of bank risk over the years during the study
period, we use box plots. It is a standardized pictorial representation of data
distribution based on minimum, first quartile, median, third quartile and maximum.
Further, the size of the box for each group is very useful for understanding the
group differences. Here year is used as a group to see the movement of the
variable over the years. Figure 3 shows the box plots of NNPA for the periods
2000 to 2016 (with a gap of one year for proper display). The upper boundaries of
the box over the years exhibit a U-shape pattern showing a declining trend till
192
Santanu Kumar Ghosh, et al.
2010 and increasing thereafter. Interestingly the range of NNPA at the end of 2016
is almost equal to that of in the year 2002. The figure 3 clearly shows that in
recent times there is a sharp increase in the credit risk of Indian commercial banks.
The NPA of Indian banks has increased by more than four times during March
2010 to March 2016. The Economic survey reports of 2014 and 2016 have
categorically mentioned about the sharp deterioration of asset quality of the
banking sector, which is a major concern for the financial health of the banks. This
increase is true for both public sector and private sector banks, although it is
comparatively more for public sector [13]. Further, the larger size of the box,
which contains middle fifty percent data, in the year 2016 implies that the spread
is more. Likewise, the distance of the upper boundaries of the box from the middle
fifty percent data in the year 2016 indicates the existence banks with high NNPA.
This figure is quite similar to the figure obtained in the year 2002. Thus, in spite of
some improvement in terms of asset quality during the study period, the present
scenario of bank credit risk is as it was in the year 2002.
The box plots of the Z-statistic (figure 4) also exhibit the same. Since, Z-statistic is
a measure of safety index, the higher the value, the lower is the bank risk. A look
into the upper boundaries of the box over the years depicts an inverted U-shape
figure, which implies that bank insolvency risk has declined up to 2008 and
gradually increased thereafter. Although the size of the box has remained more or
less same throughout the study period, the range indicates the existence of some
outperforming and nonperforming banks. However, the position of the median in
the box apparently indicates that the distribution of Z-statistic over the years is
less skewed. The distribution of NNPA and Z-statistic of Indian commercial banks
shows an increasing trend in bank risk since the year 2010. This may be due to the
introduction of system-based identification of NPAs along with aggressive lending
by banks in the past when the situation was relatively favorable.
10
5
0
NNPA
15
20
Figure 3: Box Plot of NNPA
2002
2004
2006
2008
2010
2012
Figure 3: Box Plot of NNPA
2014
2016
Profitability of Banks in India: Impacts of Market Structure and Risk
193
0
2
4
Z-Stat.
6
8
Fig. 4: Box Plot of Z-Statistic
2002
2004
2006
2008
2010
2012
2014
2016
Figure 4: Box Plot of Z-Statistic
Figure 4 exhibits the competitive condition of Indian banking sector over the study
period based on CR3 and HHI index. The average value of these two indicators
(shown in table 1) depicts lower concentration in the market. Over the years
movement of CR3, as reflected in fig. 2, indicates that CR3 has gradually declined
from 2002 to till 2012 and has increased slightly thereafter. Due to several rounds
of banking reforms in India, the degree of competition has increased in India.
Extant literature on Indian banking sector also advocates that the degree of
competition has increased after the banking sector reforms [13, 14]. However, in
recent times, a slight increase in concentration is contemplated. Values of HHI
based on total assets also demonstrate the same.
0,500
0,300
0,200
CR3TA
0,100
HHITA
2016
2015
2014
2013
2012
2011
2010
2009
2008
2007
2006
2005
2004
2003
0,000
2002
Value
0,400
Year
Figure 5: Movement of CR3 and HHI
194
4.2
Santanu Kumar Ghosh, et al.
Empirical results
Table 2 presents the impact of risk (NNPA) and market structure (HHI) on the
three indicators of bank profitability (ROA, ROE and NIM) after controlling the
influence of some bank specific and macroeconomic variables. The Wald
chi-square test indicates the overall significance of the model. Sargan test shows
that there is no evidence of over-identifying restrictions in the GMM dynamic
model estimation. Although first-order autocorrelation is present but there is no
evidence of second-order autocorrelation. Hence, the estimates are consistent [39].
The estimated coefficient of lagged dependent variable is significant for all the
three measures of profitability. This confirms the appropriateness of the dynamic
model specification. The coefficients of 𝛿 are 0.4191, 0.4443 and 0.5273
respectively for ROA, ROE and NIM, which pronounce the moderate degree of
persistence of profit in Indian banking sector during the study period. This indicates
that Indian banking industry is moderately competitive. The coefficient estimate of
NNPA is negative for all the three measures of profitability, but significant in case
of ROA and ROE. This implies that risk and profitability are negatively associated
in Indian banking sector. Theoretically, the higher the values of NPAs, the lower is
the net income and consequently profitability will be less. From the distribution of
NNPA it is evident that inspite of reduction of NNPA for some years during the
study period, the average value of NNPA is quite high, which is adversely affecting
the average profitability of Indian banks. Further, in recent time average NNPA of
Indian commercial banks has increased considerably. The finding of the study is
consistent with [2, 5, 11, 30] in the context of emerging markets. On the other
hand, the coefficient estimates of HHI based on total assets is found to be negative
and significant expect in case of NIM. The inverse association between HHI and
profitability implies that when concentration increases profitability of banks
decreases. In other words, increase in competition leads to increase in profitability.
This is contrary to the traditional SCP hypothesis. This is in line with the findings
of [2, 29, 30] in emerging markets.
Among the bank specific determinants, the results indicate bank size (SIZE) is
insignificantly associated with profitability. The insignificant association is
contrary to the findings of [22], but in line with [16] for Greek banking sector and
[2] in case of China. As [16] observe this negative influence may be due to
diseconomies of scale. Likewise, liquidity (LR) is found to be insignificantly
associated with profitability for all the three indicators of profitability. This
implies that by increasing the share of loan in total assets Indian banks could not
improve its profitability significantly, which may indicate that the banks do not
have efficient system of risk management [2]. However, we find that
diversification (DIVR) has positive and significant impact on ROA and ROE. This
implies that through diversification banks have earned more non-interest income,
which in turn improves the profitability. This is in line with the findings of [36] in
case of China, [1] for South Asian banking sector and [19] in case of Indian banks.
But the impact of diversification on NIN is found to be negative. This may be due
to the fact that when banks give more emphasis on earning non-interest income
Profitability of Banks in India: Impacts of Market Structure and Risk
195
through diversification, the net interest margin may decline.
As expected, we empirically observe significant positive impact of capitalization
(CAP) on all the three indicators of profitability. The findings are consistent with
[19, 22, 35]. Capitalization may influence profitability positively due to several
facts, such as a well-capitalized bank can grasp more profitable business
opportunities and can also reduce the cost of borrowings. Employee productivity
(EP) is negatively associated with profitability for all the three indicators and the
coefficients are significant for ROE and NIM. This is contrary to the theoretical
expectation and also the empirical findings of [2, 16, 36]. Indeed, the earlier
researchers have used revenue per employee to measure this variable. However,
we use total business per employee (BPE). BPE can enhance profitability when
banks can efficiently utilize its resource base for generating revenue. But if the
NPAs are more, business per employee can affect negatively the profitability of
banks. To gauge into deeper in this issue we have analyzed the business per
employee (BPE) and profit per employee (PPP) for the study period in figure 6
and 7 respectively. A look into the figures reveal that BPE has increased over the
years during the study period, however PPP shows an increasing trend in the
initial years and declining thereafter. The decline in PPE after 2010 is due to
increase in NPAs during this period (as observed in figure 3), which negatively
influence the earnings. This clearly indicates banks’ inefficiency in utilizing its
resource base productively and hence, the negative association between EP and
profitability is observed. Finally, the influence of growth in GPD (GGDP) is found
to be negative. In the context of overall Japanese banking sector, Liu and Wilson
[17] observe negative impact of growth in GDP and profitability. This may
happen because growth in GDP encourages competition and increased
competition dampens banks’ profitability [17]. Likewise, Tan and Floors [36] also
observe negative impact of growth in GDP on bank profitability and conclude that
sound economic condition improves the business environment and lowers the
entry barriers. Consequently, increase in competition declines bank profitability.
Alternatively, if the growth in GDP fluctuates over the years, profitability of banks
may also be affected negatively.
In table 3 we present the results of model 1 considering Z-statistic as risk indicator
and CR3 as measures of competition. We find positive influence of Z-statistic on
the three indicators of profitability. Since, high Z-statistic is the indicator of lower
insolvency risk, the observed positive association between Z –statistic and bank
profitability impels that bank risk and profitability are inversely associated. Thus,
both the measures of bank risk provide evidence on the negative impact of risk on
profitability. On the other hand, our results show that CR3 has negative impact on
profitability. This implies that concentration and profitability are negatively
associated, or in other words, there is positive association between competition
and bank profitability. Thus, both the measures of market structure provide similar
results. The findings of the study, therefore, do not support the traditional SCP
hypothesis in Indian context. It is imperative to note here that [19] finds evidence
in support of SCP hypothesis in Indian banking sector during the period 2000 to
196
Santanu Kumar Ghosh, et al.
2013. Indeed, we observe significant changes in Indian banking sector after 2013
in respect of bank risk, profitability and market structure. For instance, net NPAs
of scheduled commercial banks in 2015-16 have gone up by more than 150% as in
comparison to 2012-13. The same is also evident in this study. Further, after 2013,
a clear declining trend in profitability is observed. Again, we find increase in
concentration during the same period as compared to prior to 2013. The negative
association between concentration and profitability may be due to the dynamic
nature of these factors. For other explanatory variables, we find almost similar
results as observed in table 2.
Table 2: Empirical Results (NNPA as risk indicator and HHI as competition indicator)
Variables
Coefficient
ROA
t-statistic
Coefficient
ROE
t-statistic
NIM
Coefficient
t-statistic
lag of dep.
0.4191
4.575***
0.4443
4.629***
0.5273
7.143***
Variable
0.0159
2.887***
0.4194
3.681***
-0.0014
-0.167
Constant
−0.0011
−6.017***
-0.0199
-4.663***
-0.0004
-0.417
NNPA
−0.0099
−2.008**
-0.2537
-2.584***
-0.0004
0.056
HHI
-0.0006
-0.194
-0.0023
-0.436
0.0005
1.064
SIZE
0.0017
1.619*
0.0125
0.707
0.0024
1.251
LR
0.0040
3.064***
0.0799
2.761***
-0.0027
-2.372**
DIVR
0.0482
2.599***
0.5404
2.711***
0.0864
4.934***
CAP
-0.0006
-0.995
-0.0129
-1.901**
-0.0033
-3.229***
EP
-0.0003
-4.778***
-0.006
-4.398***
-0.0009
-1.209
GGDP
Wald
351.404***
263.416***
870.466***
Chi-square
Z = -2.321
p = 0.021
Z = -2.331
p = 0.019
Z = -3.609
p = 0.000
AR(1)1
Z
=
-1.093
p
=
0.274
Z
=
-0.912
p
=
0.361
Z
=
0.228
p = 0.819
AR(2)2
35.828
38.016
38.182
Sargan test3
Note:***, ** and * indicate significant at 1%, 5% and 10% respectively.
1
Arellano-Bond first order autocorrelation test (Ho: no autocorrelation)
2
Arellano-Bond second order autocorrelation test (Ho: no autocorrelation)
3
Test for over-identifying restrictions in GMM dynamic model estimation
Profitability of Banks in India: Impacts of Market Structure and Risk
197
Table 3: Empirical Results (Z statistic as risk indicator and HHI as competition indicator)
ROA
ROE
Coefficient
t-statistic
Coefficient
t-statistic
lag of dep. Variable
0.4762
6.342***
0.4793
7.624***
Constant
0.0161
1.681*
0.3035
1.305
Z Stat.
0.0013
3.305***
0.0353
2.531**
CR3
-0.0266
-1.836*
-0.3215
-0.961
SIZE
0.0002
0.766
0.0037
0.523
LR
0.0003
0.403
-0.0075
-0.443
DIVR
0.0045
3.871***
0.0756
2.719***
CAP
0.0228
1.667*
-0.7992
-2.785***
EP
-0.0003
-3.880***
-0.0046
-3.126***
GGDP
-0.0009
-1.053
-0.0015
-8.337
Wald Chi-square
349.966***
211.231***
AR(1)1
Z = -2.594
p = 0.009
Z = -2.512
p = 0.012
2
AR(2)
Z = -0.972
p = 0.330
Z = -0.831
p = 0.405
Sargan test3
33.528
36.621
Note: ***, ** and * indicate significant at 1%, 5% and 10% respectively.
1
Arellano-Bond first order autocorrelation test (Ho: no autocorrelation)
2
Arellano-Bond second order autocorrelation test (Ho: no autocorrelation)
3
Test for over-identifying restrictions in GMM dynamic model estimation
Variables
NIM
Coefficient
t-statistic
0.5425
7.330***
0.0093
1.051
0.0003
1.093
-0.0268
-1.847*
0.0003
1.090
0.0036
1.944*
-0.0015
-1.360
0.0793
4.990***
-0.0004
-3.904***
-0.0001
-1.584
752.128***
Z = -3.578
p = 0.003
Z = 0.105
p = 0.916
37.462
15,0000
BPE
10,0000
5,0000
BPE
Year
Figure 6: Movement of business per employee
2016
2015
2014
2013
2012
2011
2010
2009
2008
2007
2006
2005
2004
2003
2002
0,0000
198
Santanu Kumar Ghosh, et al.
0,0600
0,0500
PPE
0,0400
0,0300
0,0200
PPE
0,0100
2016
2015
2014
2013
2012
2011
2010
2009
2008
2007
2006
2005
2004
2003
2002
0,0000
year
Figure 7: Movement of Profit per employee
5. Conclusion
The present study is a modest attempt to investigate the impacts of market
structure and risk on profitability of Indian banks after controlling the influences
of some bank specific and macroeconomic determinants. We use different
measures of risk, market structure and profitability to check the robustness of our
results. We use two-step system GMM estimator to estimate the coefficients in a
dynamic set up. Our results suggest that there is a moderate degree of persistence
of profit in Indian banking sector during the study period. We find significant
negative impact of bank risk on profitability in the Indian banking Industry. With
regard to the influence of market structure, the study observes negative association
between concentration and profitability, which implies that the impact of
competition on bank profitability is positive. Our findings do not support the
traditional SCP hypothesis. This finding is in line with the findings of [17] in the
contest of Japanese banking sector and [2] in case of Chinese banking sector. This
may be due to the fact that the efficient-structure hypothesis is prevailed in the
Indian banking sector. Since, we have not used any direct measure to test this
hypothesis, future study can be conducted using efficiency as an explanatory
variable in the model to test the acceptability of efficiency-structure hypothesis.
Regarding the other explanatory variables, the findings show that diversification
and capitalization positively influences profitability (ROA and ROE) of Indian
banks. In contrary, employee productivity and growth in GDP have negative
influence on profitability. On the other hand, the study fails to discern any
significant impact of liquidity and bank size on the profitability of Indian banks.
The findings have several policy implications to the regulatory authority and
managers to improve the profitability of banks. First, reduction of NPAs is the
crucial aspect for the banks to improve profitability. Banks and also the regulatory
Profitability of Banks in India: Impacts of Market Structure and Risk
199
authority should take appropriate steps to reduce the NPAs. Recapitalization or
restructuring loans may be the short term remedy, but such plans may devastate the
financial health of banks in the long run. Second, in a competitive environment
banks can improve profitability by improving efficiency in utilizing resources.
Since bank employees are the most critical assets, banks should acquire more
knowledgeable and productive staffs, provide adequate training to the existing
staffs for improving productivity and should build an atmosphere for proper
dissemination of knowledge and skill among the employees. The report of the
National Skill Development Corporation of India (2010)[1] also indicates bank
employees as key resources and states that the success of Indian banks depends
upon the efficiency of bank employees. Third, the results suggest that banks should
try to diversify their revenue streams in order to enhance profitability. Finally, the
study indicates that the efficient-structure hypothesis may be prevailed in the Indian
banking sector. If this is true then banks can enhance profitability by reducing cost
and expanding market share.
References
[1] F. Sufian, “Determinants of bank profitability in developing economies:
empirical evidence from the South Asian banking sectors”, Contemporary
South Asia, vol. 20, no. 3, 2012, pp. 375-399.
[2] Y. Tan, “The impacts of risk and competition on bank profitability in China”,
Journal of International Financial Markets, Institution and Money, vol. 40,
2016, pp. 85-110.
[3] H. Demsetz, “Industry structure, market rivalry, and public policy”, Journal
of Law Economics, vol.16, 1973, pp. 1–9.
[4] D.M. Lloyd-Williams, P. Molynex and J. Thornton, “Market structure and
performance in Spanish banking”, Journal of Banking and Finance, vol. 18,
1994, pp. 433–443.
[5] A. Samad, “Market structure, conduct and performance: evidence from the
Bangladesh banking industry”, Journal of Asian Economic, vol. 19, 2008, pp.
181–193.
[6] X. Fu and S. Hafferman, “The Effects of Reforms on China’s Bank Structure
and Performance”, Journal of Banking and Finance, vol. 39, 2009, pp. 39-52.
[7] R.S. Raghavan, “Risk management in banks”, Charted Accountant, vol. 51,
no. 8, 2003, pp. 841–851
[8] S.K. Ghosh and S.G. Maji, “The Impact of Intellectual Capital on Bank Risk:
Evidence from Indian Banking Sector”, The IUP Journal of Financial Risk
Management, vol. XI, no. 3, 2014, pp. 18-38.
[9] S. Ghosh, “Risk, capital and financial crisis: Evidence for GCC banks”,
Borsa Istanbul Review, vol. 14, no. 3, 2014, pp. 145-157.
200
Santanu Kumar Ghosh, et al.
[10] S.G. Maji and P. Hazarika, “Capital regulation, competition and risk-taking
behavior of Indian banks in a simultaneous approach”, Managerial Finance,
vol. 44, no. 4, 2018, Pp. 459-477.
[11] M. Nawaz, S. Munir, S.A. Siddiqui, F. Ahad Afzal, M. Asif and M. Ateeq,
“Credit Risk and the Performance of Nigerian Banks”, Interdisciplinary
Journal of Contemporary Research in Business, vol. 4, no. 7, 2012, pp. 49-63.
[12] A.H.M. Norman, S. Pervin, M.M. Chowdhury and H. Banna, “The Effect of
Bank Specific and Macroeconomic Determinants of Banking Profitability: A
study on Bangladesh”, International Journal of Business Management, vol.
10, no. 6, 2015, pp. 287-297.
[13] S.G. Maji and P. Hazarika, “Does Competition Influence the Financial
Soundness of Banks? Evidence from the Indian Banking Sector”, Indian
Journal of Finance, vol. 10, no. 10, 2016, pp. 27-41.
[14] R. Arrawatis and A. Misra, “Assessment of Competition in Indian Banking”,
European Journal of Business and Management, vol. 4, no. 20, 2012, pp.
159-169
[15] D. Foos, L. Norden and M. Weber, “Loan Growth and Riskiness of Banks”,
Journal of Banking and Finance, vol. 34, no. 12, 2010, pp. 2929-2940
[16] P.P. Athanasoglou, S.N. Brissimis and M.D. Delis, “Bank-specific,
industry-specific and macroeconomic determinants of bank profitability”,
Journal of International Financial Markets, Institutions and Money, vol. 18,
no. 2, 2008, pp. 121-136
[17] H. Liu and J.O.S. Wilson, “The profitability of banks in Japan”, Applied
Financial Economics, vol. 20, no. 24), 2010, pp. 1851–1866.
[18] K. Seenaiah, B.N. Rath and A. Samantaraya, “Determinants of Bank
Profitability in the Post-reform Period: Evidence from India”, Global
Business review, vol. 16, no. 5S, 2015, pp. 82S-92S.
[19] P. Sinha and S. Sharma, “Determinants of bank profits and its persistence in
Indian Banks: a study in a dynamic panel data framework”, International
Journal of System Assurance Engineering and Management, vol. 7, no. 1,
2016, pp 35–46.
[20] J.A. Goddard, P.M. Molyneux and J.O.S. Wilson, “The profitability of
European banks: a cross-sectional and dynamic panel analysis”, The
Manchester School, vol. 72, no. 3, 2004, pp. 363-381.
[21] A. Demirguc-Kunt and H. Huizinga, “Determinants of commercial bank
interest margins and profitability: some international evidence”, World Bank
Economic Review, vol. 13, no. 2, 1999, pp. 379–408.
[22] E. Menicucci and G. Paolucci, “The determinants of bank profitability:
empirical evidence from European banking sector”, Journal of Financial
Reporting and Accounting, vol. 14, no. 1, 2016, pp.86-115.
[23] J. Golin, “The Bank Credit Analysis Handbook: A Guide for Analysts,
Bankers and Investors”, John Wiley and Sons, 2001.
[24] A.N. Berger, “The relationship between capital and earnings in banking”,
Journal of Money, Credit and Banking, vol. 27, no.2, 1995, pp. 432-456.
Profitability of Banks in India: Impacts of Market Structure and Risk
201
[25] J. Panzar and J. Rosse, “Testing For ‘Monopoly’ Equilibrium”, Journal of
Industrial Economics, vol. 35, no. 4, 1987, pp. 443–456.
[26] T. Hannan and G. Hanweck, “Bank insolvency risk and the market for large
certificates of deposit”, Journal of Money, Credit and Banking, vol. 20, no. 2,
1988, pp. 203–211.
[27] A.N. Berger, I. Hasanb and M. Zhouc, “The effects of focus versus
diversification on bank performance: Evidence from Chinese banks”, BOFIT
Discussion Papers 4, 2010, Institute for Economies in Transition, Bank of
Finland.
[28] A.N. Berger and T.H. Hannan, “The price-concentration relationship in
banking”, Review of Economics and Statistics, vol. 71, 1989, pp. 291–299.
[29] G. E. Chortareas, J. G. Garza‐Garcia and C. Girardone, “Banking sector
performance in Latin America: market power versus efficiency”, Review of
Development Economics, vol. 15, no. 2, 2011, pp. 307-325.
[30] L. Seelanatha, “Market structure, efficiency and performance of banking
industry in Sri Lanka”, Banks and Bank System, vol. 5, 2010, pp. 20–31.
[31] M.A. Pascha, T. Srivenkataramana and K. Swami, “Basel II norms with
special emphasis on capital adequacy ratio of Indian banks”, A Journal of M
P Birla Institute of Management, vol. 6, no.1, 2012, pp. 23-40.
[32] S. G. Maji and U. K. De, “Regulatory capital and risk of Indian banks: a
simultaneous equation approach”, Journal of Financial Economic Policy, vol.
7, no. 2, 2015, pp. 140 – 156.
[33] H.O. Afriyie and J.O. Akotey, “Credit Risk Management and Profitability of
Rural Banks in the Brong Ahafo Region of Ghana”, European Journal of
Business Management, vol. 5, no. 24, 2011, pp. 24-33.
[34] M. Bayyoud and N. Sayyad, “The Relationship between Credit Risk
Management and Profitability between Investment and Commercial Banks in
Palestine”, International Journal of Economics and Finance, vol. 7, no.1,
2015, pp. 163-169.
[35] P. Molyneux and J. Thorton, “Determinants of European bank profitability: a
note”, Journal of Banking and Finance, vol. 16, no. 6, 1992. pp. 1173-1178.
[36] Y Tan and C. Floros, “Bank profitability and GDP growth in China: a
note”, Journal of Chinese Economics and Business Studies, vol. 10, no. 3,
2012, pp. 267-273.
[37] R. Blundell and S. Bond, “Initial conditions and moment restrictions in
dynamic panel data models”, Journal of Econometrics, vol. 87, 1998, pp.
115–43.
[38] S. Bond, “Dynamic panel data models: a guide to micro data methods and
practice”, Portuguese Economic Journal, vol. 1, no. 2, 2002, pp.141–162.
[39] M. Arellano and S. Bond, “Some Tests of Specification for Panel Data:
Monte Carlo Evidence and an Application to Employment Equations”, The
Review of Economic Studies, vol. 58, no. 2, 1991, pp. 277-297.
202
Santanu Kumar Ghosh, et al.
Note: Human Resource and Skill Requirements in the Banking, Financial Services
& Insurance Sector (2022) – A Report – by National Skill Development
Corporation, available at www.nsdcindia.org/pdf/bfsi.pdf.