Testing for long-memory and chaos in the returns of currency exchange-traded notes
Bạn đang xem bản rút gọn của tài liệu. Xem và tải ngay bản đầy đủ của tài liệu tại đây (400.41 KB, 23 trang )
Journal of Applied Finance & Banking, vol. 7, no. 4, 2017, 15-37
ISSN: 1792-6580 (print version), 1792-6599 (online)
Scienpress Ltd, 2017
Testing for Long-memory and Chaos in the Returns
of Currency Exchange-traded Notes (ETNs)
John Francis Diaz1 and Jo-Hui Chen2
Abstract
The study uses autoregressive fractionally integrated moving average –
fractionally integrated generalized autoregressive conditional heteroskedasticity
(ARFIMA-FIGARCH) models and chaos effects to determine nonlinearity
properties present on currency ETN returns. The results find that the volatilities
of currency ETNs have long-memory, non-stationarity and non-invertibility
properties. These findings make the research conclude that mean reversion is a
possibility and that the efficient market hypothesis of Fama (1970) became
ungrounded on these investment instruments. For the chaos effect, the BDS test
finds that ETN returns and ARMA residuals also exhibit random processes,
making conventional linear methodologies not appropriate for their analysis.
The R/S analysis shows that currency ETN returns, ARMA and GARCH residuals
have chaotic properties and are trend-reinforcing series. On the other hand, the
correlation dimension analyses further confirmed that the utilized time-series have
deterministic chaos properties. Thus, investors trying to predict returns and
volatility of currency ETNs would fail to produce accurate findings because of
their unstable structures, confirming their non-linear properties.
JEL classification numbers: G10, G15
Keywords: Currency ETNs, Long-memory Properties, ARFIMA-FIGARCH,
Chaos Effects.
1 Introduction
1
Department of Finance and Department of Accounting, College of Business, Chung Yuan
Christian University, Taiwan.
2
Department of Finance, College of Business, Chung Yuan Christian University, Taiwan.
Article Info: Received : March 2, 2017. Revised : April 4, 2017.
Published online : July 1, 2017
16
Economic theory offered explanations that irregular tendencies might be
attributed to the existence of nonlinear properties of some investment instruments.
The straightforward solutions offered by linear models are often inadequate to the
growing complexities of financial time-series. Most of the times, large price
changes are not followed by relatively huge movements and at times even small
reactions trigger great changes, leading to a solid conclusion that market
volatilities are not constant over time. Financial time-series exhibits irregular
behavior wherein a process response is not proportional to the stimulus given
making the mathematics behind it difficult to comprehend.
This paper determines the application of two nonlinear models, namely
long-memory and chaos to capture nonlinear characteristics of currency ETN
returns. These two models, as revealed by Wei and Leuthold (1998) and Panas
(2001) were able to capture long memory and chaos in agricultural futures and
metal futures prices, respectively. Extant literatures recently have shown the
presence of nonlinearity in investment instruments (e.g., Antoniou and Vorlow,
2005; Das and Das, 2007; Korkmaz et al., 2009; and Mariani et al., 2009), but
because of the recent genesis of ETNs, nonlinear dynamics is not yet applied on
its returns. Given the growing number of investments being put on these
financial instruments, studying their nonlinear tendencies through long-memory
and chaos is timely.
Smith and Small (2010) defines ETNs1 as senior, unsecured debt securities
issued by an investment bank which promises a rate of return that is based to the
change in value of a tracked index. These instruments are traded daily on stock
exchanges (i.e., AMEX and NYSE), and can also be shorted or bought as a long
position. Based on Wright et al. (2009), ETNs are comparable to zero-coupon
bonds that are with medium- to long-term maturities and sold in
zero-denominations. They can also be redeemed early and have variable interest
rates. ETNs have no tracking errors, because their returns closely imitate that of an
underlying index; and provide investors a tax advantage related to the holding
period. Small investors can use ETNs to access difficult to reach type of
investments like commodity futures or a particular type of investing strategies.
Currency ETNs are designed to give investors exposure to total returns of a
single foreign currency index or a basket of currencies index. For example, the
iPath EUR/USD Exchange rate ETN (Ticker: ERO) tracks the performance of the
Euro/US dollar exchange rate which is a foreign exchange spot rate that measures
the relative values of the Euro and US dollar. The exchange rate increases when
the euro appreciates against the US dollar and decreases if the euro depreciates.
ETNs like ERO, are attractive to investors trying to hedge their exposure to the
dollar or even looking an opportunity to bet against the dollar, because their index
values are also a possible avenue for diversification.
1
For a detailed discussion on ETNs please see the papers of Smith and Small (2010), Wright et al.
(2010) and Washer and Jorgensen (2011)
17
This paper is a pioneer in applying ARFIMA-FIGARCH models in
examining the long-memory, and in utilizing chaos effects in determining chaotic
tendencies of currency ETN returns and volatilities. The purpose of this study is
to provide additional evidence of nonlinearities in economic time-series from the
perspective of ETNs. To the best of our knowledge no research yet has been
done to these new investment instruments. The research is motivated by the fact
that providing new understanding in the non-linear properties of currency ETNs
creates considerable amount of knowledge for both academicians and researchers.
The results can also provide the academic community potential avenues for
research. Also, proper modeling of this new type of investment instruments
through nonlinearities; and checking the existence of short, intermediate and long
memories, and chaotic properties of ETNs can yield better results that will benefit
the investing community in creating potential opportunity to create profit.
The short findings of this paper found the returns of currency ETNs
non-stationarity and non-invertibility properties. This makes the research
conclude that the efficient market hypothesis of Fama (1970) stands on solid
grounds for the time-series utilized and mean reversion is not present. The BDS
test found that ETN returns and ARMA residuals exhibit random processes. The
R/S analysis showed that currency ETN returns, ARMA and GARCH residuals
have chaotic properties and are trend-reinforcing. The correlation dimension
analyses further confirmed that the time-series utilized have deterministic chaos
properties. Thus, investors trying to predict returns and volatility of currency
ETNs would fail to produce accurate findings.
The research is structured as follows. Section 2 narrates related studies,
Section 3 explains the data and methodology of ARFIMA-FIGARCH, BDS test,
R/S analysis and correlation dimension; Section 4 interprets the empirical
findings; and Section 5 provides the conclusion.
2 Related Literature
This part gives a narration of researches proving the existence of non-linear
dynamics in the returns of foreign exchange markets. These literatures address
two main topics: (1) reviews studies that established long-memory and mean
reversion in exchange rates, and (2) covers literatures that explained the chaotic
tendencies of currency markets.
Analyzing econometric time-series in a nonlinear framework, according to
Panas (2001), have three primary reasons.
The author explained that
nonlinearities communicate information about the inherent structure of the data
series. These nonlinearities then offer insight into the nature of the process that
dominates the structure. And through these methods, it would be easy to
distinguish between the stochastic and chaotic properties of the time-series, which
is very difficult or even impossible to determine using linear models.
Long-memory dynamics in the literature have been applied to several
18
financial instruments and foreign exchange rates. Kang and Yoon (2007),
Korkmaz et al. (2009), and Tan and Khan (2010) established the fact that long
memory properties can exist in both returns and volatilities in the stock markets,
while Choi and Hammoudeh (2009) found evidence of long memory in spot and
futures returns and volatilities for oil-related products. Hafner and Herwartz
(2006) in the study of the currency market were able to track the effect of shocks
on volatility through time in the time-series of franc/US dollar and mark/US
dollar. Beine et al. (2002) modeled exchange rates using ARFIMA-FIGARCH and
found that the persistence of volatility shocks in the pound, mark, franc and yen
share similar patterns. On the other hand, Nouira et al. (2004) used ARFIMA
model and showed that by isolating the unstable unconditional variance,
long-memory was detected on the exchange rate of euro/US dollar returns.
Related forecasting studies in ETPs are present with the paper of Mariani et
al. (2009), when they demonstrated that the degree of long memory effects of
SPDR S&P 500 ETF (Ticker: SPY) and SPDR Dow Jones Industrial Average ETF
(Ticker: DIA) is virtually the same as their tracked indices, showing the efficiency
of ETFs’ mimicking the behavior. In a recent study, Yang et al. (2010) used
GARCH model to determine return predictability of eighteen stock index ETFs.
Their evidence showed that six ETFs have predictable structures. Rompotis (2011)
also examined the performance persistence of iShares ETFs and also tried to
determine their predictability. The study found that ETF returns are superior than
the S&P 500 Index in the short-run and also concluded that ETF performances are
somehow predictable through a dummy regression analysis.
Chaotic tendencies of variables, on the other hand, have also been detected
from financial instruments and currency markets. The seminal work of Hsieh
(1991) provided a comprehensive discussion in the presence of chaos in financial
markets and also agreed that financial time-series may have chaotic behavior.
Blank (1991) and Kyrtsou et al. (2004) reported nonlinear dynamics in futures
prices, and also found that short-term forecasting models may be improved by
chaotic factors. Panas and Ninni (2000) showed that the price sequence of oil
markets contains non-linear dynamics and that ARCH-GARCH models and chaos
effects can best capture these tendencies. In a latter study, Moshiri and Faezeh
(2006) stated that crude oil futures prices have complicated nonlinear dynamic
patterns. Furthermore, Panas (2001) applied both long-memory and chaos
effects to London metal prices, and found that aluminum can be modeled by the
long-memory process and tin prices supported chaos.
The significance of chaos in the foreign exchange markets according to
Yudin (2008) is that investors would be able to find powerful trends that can help
in predicting the currency market. There are however mixed literatures in
determining chaos in foreign exchange markets. For example, Das and Das
(2007) revealed that foreign exchange markets exhibited deterministic chaos
nonlinear processes. Few results were found by Serletis and Gogas (1997) when
they utilized chaos effects to determine the tendencies of seven Eastern European
countries. They only found two out of seven exchange rates consistent with
19
chaos. In a recent study of Adrangi et al. (2010) utilizing correlation dimension
and BDS in the US dollar, Canadian dollar, Japanese yen and Swiss franc
exchange rates, they only found nonlinear dependence in their data and not chaos
properties. But Jin (2005) argued that the absence of chaotic tendencies in
foreign exchange markets in a particular time can change depending on the degree
of competition in the market; and may be even affected by transmission of
volatility from other foreign exchange markets (Cai et al., 2008 and Bubak et al.,
2011).
We can conclude from the above literatures, nonlinear properties, particularly
long-memory and chaos exists in the financial markets, foreign exchange markets
and other financial instruments. However, chaotic tendencies are yet to be
established in ETPs. These evidences make us believe that currency ETNs are a
good avenue in establishing long-memory, especially chaotic properties since its
recent genesis lacks the study of its further characterization.
3 Data and Methodology
This paper utilizes daily closing prices of currency ETNs obtained from the
Google Finance Website. The research period begins at the varying inception
dates of the ETNs. As of February 5, 2012, About.com website listed 188 ETNs.
The data was limited to five because most ETNs are in their early stages of
inception and some are not actively traded having numerous presence of zero
volumes and zero returns. Currency ETNs featured in this study have almost $17.5
billion in market capitalization. This considerable amount of investment in this
security inspired this paper to examine its long memory properties and chaotic
tendencies that may have significant economic value. These ETNs were chosen
because they link their returns on specific type of foreign exchange market and are
actively traded.
The autoregressive fractionally integrated moving average (ARFIMA) model
is a parametric approach in econometric time-series that examines long-memory
characteristics (Granger and Joyeux, 1980; and Hosking, 1981). This model
allows the difference parameter to be a non-integer and considers the fractionally
integrated process in the conditional mean, unlike the autoregressive integrated
moving average (ARIMA) model proposed by Box and Jenkins (1976) where the
difference parameter only takes an integer value. While the fractionally
integrated generalized autoregressive conditional heteroskedasticity (FIGARCH)
model as by Baillie et al. (1996) captures long memory in return volatility, the
process gives more flexibility in modeling the conditional variance. On the other
hand, chaos offers an assumption that at least part of underlying process is
nonlinear, and also evaluates the determinism of the process. Hsieh (1991)
defines chaos as a nonlinear deterministic series that appears to be random in
nature and cannot be identified as nonlinear deterministic system or a nonlinear
stochastic system. This means that the dynamics of chaotic process can be
20
misconstrued as a random process by conventional a linear econometric method,
that is why appropriate modeling is necessary to come up with accurate findings.
3.1. Long memory properties
The ARFIMA ( p, d , q ) model is used to examine the long-memory
characteristics (Granger and Joyeux, 1980; and Hosking, 1981) of ETNs. This
econometric model permits the difference parameter to be a non-integer and
considers the fractionally integrated process I (d ) in the conditional mean. The
ARFIMA model, as defined by Korkmaz et al. (2009) can be illustrated as:
(1)
( L)(1 L) d Yt ( L) t , t ~ (0, 2 ) ,
where
d is the fractional integration real number parameter;
L is the lag operator; and
t is a white noise residual.
This equation satisfies both the assumptions of stationarity and invariability
conditions.
The fractional differencing lag operator (1 L) d can be further illustrated
by using the expanded equation below:
d (d 1) 2 d (d 1)(d 2) 3
(1 L) d 1 dL
L
L ...
(2)
2!
3!
Based on Hosking (1981), and as applied by Kang and Yoon (2007) and
Korkmaz et al. (2009), when 0.5 d 0.5 , the series is stationary, wherein the
effect of market shocks to t decays at a gradual rate to zero. When d = 0, the
series has short memory and the effect of shocks to t decays geometrically.
When d = 1, there is the presence of a unit root process.
Furthermore, there is a long memory or positive dependence among distant
observations when 0 < d < 0.5. Also, the series has intermediate memory or
antipersistence when -0.5 < d < 0 (Baillie, 1996). The series is non-stationary
when d 0.5 . While the series is stationary when d 0.5 , but considered a
non-invertible process, which means that the series cannot be determined by any
autoregressive model.
_
The FIGARCH ( p, d , q) model captures long memory in return volatility
(Baillie et al., 1996). The model is more flexible in modeling the conditional
_
variance, capturing both the covariance stationary GARCH for d =0, and the
_
non-stationary IGARCH for d =1. The FIGARCH model can be illustrated as:
( L)(1 L) d t2 [1 ( L)]vt ,
(3)
where
v t is the innovation for the conditional variance, and (L) and [1 ( L)]
21
have roots that lie outside of the unit root circle. The differencing parameter d
dictates the long-memory property of the volatility if 0 d 1.
3.2. Chaos methodologies
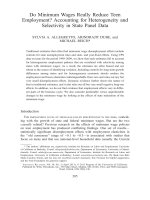
According to Peters (1994), the existence of a fractal dimension and sensitive
dependence on initial conditions are the two necessary requirements in order for a
structure to be chaotic.
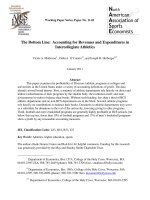
Figure 1 illustrates a Mandelbrot Set wherein a figure of
a fractal is shown. A time series with high affinity will show that no matter how
large the magnification of a fractal, the shape of the Mandelbrot Set will still be
similar to the original one. As shown in the magnified Figure 2, it indicates that
a system is similar in affinity with its entirety. This research utilizes three
different approaches in testing if the underlying time series data of five currency
ETNs have chaotic tendencies. The detailed methodologies are as follows:
3.2.1. Brock, Dechert, and Scheinkman test
The BDS test, devised by Brock et al. (1996) is a powerful test in separating
random series from deterministic chaos or from nonlinear stochastic series.
Chaos as defined by Hsieh (1991) is a nonlinear deterministic series that seems
random in nature and cannot be identified as nonlinear deterministic system or a
nonlinear stochastic system. The BDS statistic calculates statistical significance
of the correlation dimension and determines nonlinear dependence. When
Opong et al. (1999) applied this test to FTSE stock index returns, they found that
the series is not random because of detected frequent showing of patterns.
However, according to Hsieh (1991), the BDS test has a low power against
autoregressive (AR) and ARCH models, and before proceeding with the test; the
observations are pre-filtered with a linear filter such as ARMA (or ARIMA) and a
nonlinear filter such as GARCH.
The BDS test uses a statistic based on the correlation integral which is
computed as:
C N (l , T )
2
I l ( xtN , xsN ) ,
TN (TN 1) t s
(4)
where TN T N 1.
The correlation integral is based on a given sequence xt : t 1,..., T of
observations which are independent and identically distributed (iid), and
N-dimensional vectors xtN ( xt , xt 1 ,... xt N 1 ) , called the “N-histories”.
22
Source: Based on the illustration of Aros fractals software
Figure 1: Mandelbrot set fractals
Source: Based on the illustration of Aros fractals software
Figure 2: Magnified version of the Mandelbrot set fractals
Brock et al. (1996) illustrated that the null hypothesis
xt
is iid with a
non-degenerative density F, CN (l , T ) C1 (l ) N with probability of one, as
Also, the author proposed that
T , for any fixed N and l.
T C N (l , T ) C1 (l , T ) N
has a normal distribution with zero mean and variance:
N 1
j 1
N2 (l ) 4 K N 2 K N 1C 2 j ( N 1) 2 C 2 N N 2 KC 2 N 2 ,
(5)
where
2
C C (l ) F ( z 1) F ( z 1)dF ( z ), K K (l ) F ( z 1) F ( z 1) dF ( z ) .
Furthermore, C1 (l , T ) is a consistent estimate of C(l), and
23
K (l , T )
6
I l ( xt , xs ) I l ( xs , xr ) .
TN (TN 1)(TN 2) t sr
(6)
Eq. (6) is also a consistent estimate of K(l). Therefore, N (l ) can be estimated
consistently by N (l , T ) , which C1 (l , T ) and K1 (l , T ) can replace C (l ) and
K (l ) in the equation. The BDS statistic which follows a normal distribution can
be illustrated below:
wN (l , T ) T CN (l , T ) C1 (l , T ) N / N (l , T ) ,
(7)
where N (l , T ) is the standard deviation of the correlation integrals.
3.2.2. Rescaled Range analysis: Hurst exponent
R/S analysis is a test defined by the range and standard deviation (R/S
statistic) or the so-called reschaled range. Hurst (1951) first developed the
rescaled range procedure, with improvements made by Mandelbrot and Wallis
(1969), and Wallis and Matalas (1970) The major shortcoming of the traditional
rescaled range (R/S) is that it can identify range dependencies, without
discrimination between short and long dependencies (Lo, 1991). And the
modified R/S analysis was able to remove short-term dependencies and also able
to detect long term dependencies. Peters (1994) and Opong et al. (1999) showed
the procedures on how to perform the R/S analysis. Each of the ETNs under
study is initially transformed into logarithmic return given by:
S t ln( Pt / P1 ) ,
(8)
where S t = logarithmic returns at time t, and Pt =price at time t. The S t series
is pre-whitened to reduce the effect of linear dependency and non-stationarity by
adopting an AR(1) model to S t which is shown as follows:
S t S t 1 t ,
where S t 1 is the logarithmic return at time period t-1.
the parameters to be estimated and t is the residual.
(9)
and represent
Based on the application of Opong et al. (1999) and Peters (1994), the time
period is separated into A adjacent sub-periods of length n, such that A n N ,
where N denotes the extent of the series N t . Each sub-period is labeled I a ,
a=1,2,3,…,A. The elements contained in I a is marked N k ,a , k=1,2,3,…,n.
The average value ea for each I a of length n is
24
1 n
ea N k , a .
n k 1
(10)
The range RI a is the difference between the maximum and minimum value
X k ,a , within each sub-period I a is
RI a max( X k ,a ) min( X k ,a ) , where 1 k n , 1 a A ,
(11)
where
k
X k ,a ( N i ,a ea ) , k=1,2,3,…,n
represents the time series for each
i 1
sub-period of departures from the mean value. R/S analysis requires the RI a to
be normalized by dividing by the sample standard deviation S I a equivalent to it
and is calculated as follows:
1 n
S I a ( N k ,a ea ) 2
n k 1
0.50
.
(12)
The average R/S values for length n is computed as:
R 1 A
( RI a / S I a ).
S n A a1
(13)
The application of an OLS regression with log(n) as the independent variable
and log(R / S ) as the dependent variable is the last step in the analysis. The
Hurst exponent, H is derived from the slope obtained from the regression. The
three values of the H exponent would be: H 0.5 , which denotes that the series
follows a random walk; 0 H 0.5 , which stands for an anti-persistent series;
and 0.5 H 1 , which means that the series is a persistent, or is a
trend-reinforcing series. The R/S analysis is appraised by computing the
expected values of the R/S statistics which is shown as:
n 0.5 n
E ( R / S )
n 2
0.50
n1
r 1
(n r )
.
r
(14)
The expected Hurst exponent is derived from the slope of the regression of
E (log(R / S ) n on log(n). The variance of the Hurst exponent is shown as:
Var ( H ) n
1
,
T
where T denotes the total number of observations in the series.
(15)
25
3.2.3. Correlation Dimension Analysis
Correlation dimension (CD) introduced by Grassberger and Procaccia (1983),
provides a diagnostic process in distinguishing deterministic and stochastic time
series xt . It determines the degree of complexity of a time-series, which can
be a sign of having chaos. Kyrtsou and Terraza (2002) made an empirical study
and showed evidence based on correlation dimension (CD) that the French
CAC40 returns can be either generated through a noisy chaotic or a pure random
process. Based on the studies of Grassberger and Procaccia (1983), and Hsieh
(1991), the analysis initially requires the filtering of the observations throuth the
ARMA and GARCH processe from autocorrelation and conditional
heteroscedasticity, respectively which can negatively affect some tests for chaos.
Next step is to create n-histories of the filtered data, which are illustrated as
follows:
1-history: xt1 xt ,
(16)
2-history: xt2 ( xt 1, xt ) ,
(17)
:
n-history: xtn ( xt n1,...,xt ) .
(18)
where n-history represents a particular point in the n-dimensional space.
The correlation integral is then calculated, which is utilized by Grassberger
and Procaccia (1983) and define the correlation dimension as follows:
Cn ( ) limT # (t , s),0 t , s, T : xtn xsn / T 2 ,
where # represents the number of points in the set, and
(19)
denotes the sup- or
max- norm. Thus, the correlation integral Cn ( ) is defined as the fraction of
pairs ( xsn , xtn ) , which are close to each other, based on :
max i0,...,n1 xsi xt i .
(20)
The final step requires calculating the slope of log Cn ( ) on log for
small values of with the equation below:
vn lim 0 log Cn ( ) / log .
(21)
The series is consistent with chaotic behavior if the correlation dimension
(vn ) does not increase with n.
26
4 Empirical Results
Table 1 shows that currency ETN returns mostly have minimal losses and
gains. The highest positive return that we could have on our sample is just 2.1%
from the URR ETN, and the lowest negative return is 0.3% from the DRR ETN.
These two ETNs also have the highest volatility in the samples. Following the
Modern Portfolio Theory of Markowitz (1952), we can tell that with the greater
dispersion of these ETN returns, the higher their risk which may lead to higher gains
and higher losses. The lowest positive return and lowest volatility is ICI ETN.
Most of the samples are negatively skewed except for DRR and ICI and the kurtosis
coefficients have leptokurtic distributions. The Jarque-Bera statistic for residual
normality shows that the ETN returns are under a non-normal distribution
assumption. All ETN samples have no serial correlation. The minimum value of
the Akaike Information Criterion (AIC) is used to identify the orders of ARFIMA
and FIGARCH models. Enders (2004) discussed that the AIC has more power in
small sample sizes. This paper used the Lagrange Multiplier Test (ARCH-LM) to
test the ARCH effect. We can apply GARCH models in the chosen dataset,
because the null hypothesis for all ETN samples was rejected.
4.1. Long memory property results
Table 2 illustrates the results for both ARFIMA and ARFIMA-FIGARCH
models. ARFIMA model identified two significant results. The returns of CNY
and ICI ETNs exhibited a non-invertible stationary process, which means that it
cannot be represented by any autoregressive process. For the return volatility
outcome proposed by Baillie et al. (1996) for the FIGARCH model, ERO ETN
sample showed non-stationarity and is also difficult to model. However, this
study considers the volatility structure of the remaining DRR, CNY, ICI and URR
returns to be exhibiting long-memory processes in their volatility structures,
similar to what Kang and Yoon (2007) and Tan and Khan (2010) observed in
studying the Korean and Malaysian stock market returns, respectively. These
make the study conclude that the efficient market hypothesis of Fama (1970) is
not consistent with this type of investment instruments and that mean reversion1
is also possible because of the presence of long memory properties, which also is
consistent to the earlier conclusion of Rompotis (2011). Thus, fund managers
and investors trying to model and forecast the following ETNs would have the
possibility of having extra returns, because their structures are predictable. The
pricing efficiency of ETPs is earlier proven by the researches of Kayali (2007) and
Zhou (2010) in their studies of actively traded ETFs in Pakistan and US,
respectively; and of Wright et al. (2010) in their introduction of ETN paper, and
this study found evidences saying the opposite.
The initial results of ARFIMA-FIGARCH models provided a good starting
1
Mean reversion is the tendency of prices and returns to eventually or in the long-run move back
towards the average rate in the market (Henry and Olekalns, 2002).
27
point to characterize currency ETN returns. This paper conducted further testing to
provide additional characterization on the inherent structure of currency ETN
returns and what causes this deterministic behavior. This study found another set
of answers on the chaos process to support this claim. This research initially did
filtering of the data and Table 3 shows that the alternative of no unit roots is not
rejected in all ETN returns through the Augmented Dickey-Fuller (ADF) unit-root
test. To determine optimal lags for ETN returns, ARMA residuals and GARCH
residuals models, the minimum value of the Akaike Information Criterion (AIC)
was applied. The findings also presented that the null hypothesis of no serial
correlation cannot be rejected for
28
Table 1: The Sample Size and Period of Currency ETNs
Currency ETNs
Start of Data
Obs.
Mean
Std. Dev.
iPath EUR/USD Exchange Rate ETN (ERO)
May 11 2007
925
-0.002
0.430
Market Vectors Double Short Euro ETN (DRR)
May 8, 2008
849
-0.003
0.732
Market Vectors Renminbi/USD ETN (CNY)
Mar. 17, 2008
833
-0.001
0.243
iPath Optimized Currency Carry ETN (ICI)
Oct. 2, 2008
717
0.003
0.216
Market Vectors Double Long Euro ETN (URR)
May 8, 2008
641
0.021
0.965
Source: Yahoo Finance – various inception dates up to September 30, 2011; />
Skew.
-0.144
0.219
-0.268
0.255
-0.133
Kurt.
20.310
1.070
54.818
0.977
1.948
J-Bera
11.589***
47.321***
1.043***
36.316***
103.25***
LM test
9.157
13.051
10.969
9.117
12.556
ARFIMA-FIGARCH
model
d-coeff.
(2,3)
1.286 (0.000)***
(3,3)
0.856 (0.000)***
(1,1)
0.836 (0.000)***
(1,2)
0.565 (0.040)**
(2,3)
0.697 (0.010)***
AIC
0.870
2.123
-0.854
-0.374
2.670
Table 2: Summary Statistics of ARFIMA and ARFIMA-FIGARCH models
Green ETFs
ARFIMA
ARCH-LM
model
d-coeff.
AIC
d-coeff.
ERO
(3,2)
0.011 (0.831)
1.144
169.189***
0.051 (0.310)
DRR
(2,3)
-0.015 (0.726)
2.217
7.440***
-0.006 (0.064)
CNY
(3,3)
-0.331 (0.000)***
-0.227
65.714***
-0.168 (0.180)
ICI
(0,2)
-0.130 (0.033)**
-0.238
13.320***
-0.069 (0.280)
URR
(2,2)
-0.043 (0.188)
2.770
10.471***
0.030 (0.810)
Note: *, ** and *** are significance at 10, 5 and 1% levels, respectively; p-values are in parentheses.
Table 3: Summary Statistics of Unit Root, LM, and ARMA-LM tests for stock index and ETN returns
ETNs
ADF
ARMA
AIC
LMARMA
AIC
LMtest
Res.
test
ERO
-24.327***
(3,2)
1.124
2.919
(3,3)
1.114
0.970
DRR
-27.928***
(2,3)
2.217
0.400
(0,1)
2.203
0.450
CNY
-23.774***
(3,3)
-0.241
0.939
(3,2)
-0.264
0.425
ICI
-24.327***
(0,2)
-0.056
1.433
(2,3)
-0.065
0.610
URR
-20.090***
(2,2)
2.770
-0.043
(2,3)
2.755
0.527
Note: *, ** and *** are significance at 10, 5 and 1% levels, respectively; p-values are in parentheses.
ARCHLM
174.758***
15.248***
65.563***
121.542***
28.555***
GARCH
Res.
(2,2)
(3,3)
(2,3)
(1,1)
(3,3)
AIC
0.831
1.849
-0.826
-0.375
2.667
ARCHLM
2.811
1.849
0.114
7.395
0.154
29
all the currency ETN returns through the Breush-Godfrey LM test. The Lagrange
Multiplier Test (ARCH-LM) was used in testing for the ARCH effect (Engle, 1982).
The relevant statistics of the ARMA returns and ARMA residuals models with the
null hypothesis of no ARCH effect for all samples was rejected and fit for further
testing for the GARCH residuals test. And for the last column, the results showed
that there is no longer an ARCH effect for all of the samples.
4.2. Chaos methodology results: BDS test, R/S analysis and Correlation
dimension analysis
This study conducted a series of test to detect chaos in the time-series data.
The BDS is first of the three tests to detect chaos and rules out the possibility that
the data behaves iid, followed by the R/S analysis and correlation dimension
analysis to determine chaotic properties.
4.2.1. Brock, Dechert, and Scheinkman test results
The research used four values of / from 0.5 to 2.0 to cover both short
and long dimensions which improve the power of the BDS test. Table 4
illustrates that the BDS statistics are significant at the 1% level for most values of
/ for the ETN returns and ARMA residuals. Thus, this paper can conclude
that data sets are not iid, and conventional linear methodologies are not
appropriate for their analysis, because the data is not a pure random series. In
earlier studies, Eldridge et al. (1993) and Opong et al. (1999) finds similar
findings of non-stochastic process in the S&P 500 cash index and returns of FTSE
index, respectively. However, we cannot conclude the stochastic properties for
all the GARCH residuals, except for CNY and URR ETNs. The presence of
significant results from embedding dimensions 2-5 and values of / from
0.5-2.0 for CNY, and from embedding dimensions 3-6 and value of 0.5 / for
URR mean that at least on a shorter dimension, a possibility of a chaotic series and
not a random process may be present. Since BDS test is just the beginning in
testing for chaos, this paper further tests its validity and utilizes rescaled range
(R/S) and correlation dimension analyses to supplement this initial test.
4.2.2. Rescaled Range analysis: Hurst exponent results
Table 5 shows that all Hurst exponents of the currency ETN returns, ARMA
and GARCH residuals are way below 0.5, however, after scrambling the data
series, all Hurst exponents are
30
ERO
/
0.5
2
0.005***
(0.007)
0.005***
(0.000)
0.004***
(0.000)
0.003***
(0.000)
0.001***
(0.000)
3
4
5
6
DRR
/
0.5
2
0.002***
(0.010)
0.002***
(0.000)
0.001***
(0.000)
0.001***
(0.000)
0.000***
(0.000)
3
4
5
6
CNY
/
0.5
2
0.037***
(0.000)
0.049***
(0.000)
0.049***
(0.000)
0.043***
(0.000)
0.035***
(0.000)
3
4
5
6
ETN returns
1.0
1.5
0.009***
(0.001)
0.016***
(0.000)
0.021***
(0.000)
0.025***
(0.000)
0.025***
(0.000)
0.000
(n/a)
0.000
(n/a)
0.000
(n/a)
0.000
(n/a)
0.000
(n/a)
ETN returns
1.0
1.5
0.006***
(0.005)
0.010***
(0.000)
0.010***
(0.000)
0.009***
(0.000)
0.008***
(0.000)
0.007***
(0.004)
0.015***
(0.000)
0.021***
(0.000)
0.026***
(0.000)
0.028***
(0.000)
ETN returns
1.0
1.5
0.042***
(0.000)
0.077***
(0.000)
0.106***
(0.000)
0.126***
(0.000)
0.141***
(0.000)
0.031***
(0.000)
0.063***
(0.000)
0.095***
(0.000)
0.127***
(0.000)
0.151***
(0.000)
2.0
Table 4: BDS test for Currency ETNs
ARMA residuals
0.5
1.0
1.5
0.006***
(0.001)
0.015***
(0.000)
0.026***
(0.000)
0.041***
(0.000)
0.055***
(0.000)
0.004***
(0.001)
0.004***
(0.000)
0.003***
(0.000)
0.002***
(0.000)
0.001***
(0.000)
2.0
0.5
0.005***
(0.002)
0.014***
(0.000)
0.024***
(0.000)
0.033***
(0.000)
0.041***
(0.000)
0.002**
(0.016)
0.001***
(0.004)
0.001***
(0.000)
0.000***
(0.000)
0.000***
(0.000)
2.0
0.5
0.021***
(0.000)
0.044***
(0.000)
0.069***
(0.000)
0.093***
(0.000)
0.115***
(0.000)
0.030***
(0.000)
0.033***
(0.000)
0.030***
(0.000)
0.024***
(0.000)
0.018***
(0.000)
0.010***
(0.000)
0.017***
(0.000)
0.021***
(0.000)
0.023***
(0.000)
0.023***
(0.000)
0.010***
(0.000)
0.023***
(0.000)
0.033***
(0.000)
0.045***
(0.000)
0.054***
(0.000)
ARMA residuals
1.0
1.5
0.006***
(0.005)
0.009***
(0.000)
0.009***
(0.000)
0.007***
(0.000)
0.006***
(0.000)
0.006***
(0.008)
0.013***
(0.000)
0.019***
(0.000)
0.023***
(0.000)
0.025***
(0.000)
ARMA residuals
1.0
1.5
0.039***
(0.000)
0.068***
(0.000)
0.092***
(0.000)
0.107***
(0.000)
0.118***
(0.000)
0.029***
(0.000)
0.060***
(0.000)
0.091***
(0.000)
0.118***
(0.000)
0.144***
(0.000)
2.0
0.008***
(0.000)
0.019***
(0.000)
0.031***
(0.000)
0.046***
(0.000)
0.060***
(0.000)
2.0
0.004***
(0.006)
0.012***
(0.000)
0.022***
(0.000)
0.030***
(0.000)
0.037***
(0.000)
0.5
-0.001
(0.133)
-0.001
(0.134)
-0.000
(0.272)
-0.000
(0.812)
0.000
(0.503)
0.5
-0.000
(0.540)
-0.000
(0.606)
0.000
(0.974)
0.000
(0.641)
0.000
(0.026)
2.0
0.5
0.018***
(0.000)
0.045***
(0.000)
0.071***
(0.000)
0.097***
(0.000)
0.122***
(0.000)
-0.005***
(0.002)
-0.004***
(0.004)
-0.002**
(0.030)
-0.001*
(0.077)
-0.001
(0.399)
GARCH residuals
1.0
1.5
-0.003
(0.165)
-0.002
(0.376)
-0.001
(0.457)
-0.001
(0.645)
-0.000
(0.905)
-0.002
(0.276)
-0.002
(0.514)
-0.003
(0.556)
-0.002
(0.692)
-0.001
(0.825)
GARCH residuals
1.0
1.5
0.000
(0.829)
-0.001
(0.702)
-0.001
(0.426)
-0.001
(0.201)
-0.001
(0.326)
-0.000
(0.955)
-0.001
(0.639)
-0.003
(0.424)
-0.004
(0.304)
-0.003
(0.433)
GARCH residuals
1.0
1.5
-0.010***
(0.001)
-0.012***
(0.006)
-0.009**
(0.046)
-0.006
(0.144)
-0.003
(0.438)
-0.006***
(0.008)
-0.012***
(0.007)
-0.013
(0.035)
-0.011
(0.113)
-0.007
(0.368)
2.0
-0.001
(0.589)
-0.001
(0.842)
-0.001
(0.775)
-0.001
(0.771)
-0.001
(0.825)
2.0
0.000
(0.750)
-0.000
(0.972)
-0.001
(0.724)
-0.003
(0.545)
-0.001
(0.618)
2.0
-0.002*
(0.097)
-0.008***
(0.008)
-0.010**
(0.021)
-0.011*
(0.061)
-0.010
(0.188)
31
ICI
/
0.5
2
0.008***
(0.000)
0.009***
(0.000)
0.006***
(0.000)
0.004***
(0.000)
0.002***
(0.000)
3
4
5
6
URR
/
2
0.5
ETN returns
1.0
1.5
0.019***
(0.000)
0.036***
(0.000)
0.042***
(0.000)
0.042***
(0.000)
0.037***
(0.000)
0.019***
(0.000)
0.041***
(0.000)
0.060***
(0.000)
0.075***
(0.000)
0.083***
(0.000)
ETN returns
1.0
1.5
2.0
0.5
0.014***
(0.000)
0.030***
(0.000)
0.046***
(0.000)
0.064***
(0.000)
0.078***
(0.000)
0.007***
(0.000)
0.008***
(0.000)
0.005***
(0.000)
0.003***
(0.000)
0.002***
(0.000)
2.0
0.5
ARMA residuals
1.0
1.5
0.017***
(0.000)
0.033***
(0.000)
0.041***
(0.000)
0.041***
(0.000)
0.037***
(0.000)
0.017***
(0.000)
0.040***
(0.000)
0.060***
(0.000)
0.076***
(0.000)
0.084***
(0.000)
ARMA residuals
1.0
1.5
0.003**
0.007**
0.010***
-0.000***
0.002
0.005 0.008***
(0.028)
(0.018)
(0.002)
(0.000)
(0.192)
(0.103)
(0.010)
3
0.003*** 0.016***
0.027***
-0.001***
0.002**
0.011**
0.022***
(0.001)
(0.000)
(0.000)
(0.000)
(0.049)
(0.037)
(0.000)
4
0.002*** 0.015***
0.034***
-0.002***
0.001*
0.011**
0.028***
(0.001)
(0.000)
(0.000)
(0.000)
(0.075)
(0.043)
(0.000)
5
0.001*** 0.013***
0.040***
-0.002***
0.001**
0.010**
0.033***
(0.001)
(0.000)
(0.000)
(0.000)
(0.013)
(0.014)
(0.000)
6
0.000*** 0.010***
0.037***
-0.004***
0.000*** 0.007***
0.031***
(0.000)
(0.000)
(0.000)
(0.000)
(0.002)
(0.019)
(0.000)
Note: *, ** and *** are significance at 10, 5 and 1% levels, respectively; p-values are in parentheses.
2.0
0.5
0.012***
(0.000)
0.030***
(0.000)
0.048***
(0.000)
0.067***
(0.000)
0.082***
(0.000)
-0.001
(0.387)
-0.000
(0.612)
-0.000
(0.903)
-0.000***
(0.006)
-0.000***
(0.006)
2.0
0.5
0.008***
(0.001)
0.022***
(0.000)
0.034***
(0.000)
0.045***
(0.000)
0.047***
(0.000)
-0.001
(0.300)
-0.001*
(0.100)
-0.001**
(0.019)
-0.000**
(0.027)
-0.000**
(0.030)
GARCH residuals
1.0
1.5
-0.001
(0.786)
0.000
(0.930)
0.001
(0.710)
0.001
(0.687)
-0.000
(0.997)
-0.000
(0.911)
0.001
(0.823)
0.001
(0.701)
0.002
(0.705)
0.000
(0.986)
GARCH residuals
1.0
1.5
-0.003
(0.266)
-0.003
(0.277)
-0.004
(0.145)
-0.003
(0.170)
-0.003
(0.113)
-0.000
(0.863)
-0.001
(0.871)
-0.002
(0.695)
-0.002
(0.760)
-0.004
(0.484)
2.0
0.000
(0.774)
0.002
(0.544)
0.003
(0.546)
0.004
(0.512)
0.002
(0.707)
2.0
0.001
(0.717)
0.002
(0.606)
0.002
(0.680)
0.003
(0.607)
-0.001
(0.879)
32
Table 5: Hurst exponents
Stock returns
ERO
Original Series
DRR
CNY
ICI
URR
-0.004440
0.000750
0.003648
-0.00144
0.000371
0.479791
ERO
0.518809
DRR
0.216550
CNY
0.396414
ICI
0.487579
URR
0.000148
0.000253
0.000253
0.000289
0.000414
0.509586
ERO
0.508859
DRR
0.508859
CNY
0.476339
ICI
0.50562
URR
Original Series
0.000666
0.000504
-0.000340
-0.000340
0.000362
Scrambled Series
0.504446
0.521021
0.544587
0.544587
0.544807
Scrambled Series
ARMA residuals
Original Series
Scrambled Series
GARCH residuals
Table 6: Correlation Dimension estimates
Correlation
Dimensions
1
2
1. ERO ETN
1.174 1.996
returns
ARMA
1.025 2.013
residuals
GARCH
0.994 1.957
residuals
2. DRR ETN
1.164 2.079
returns
ARMA
1.005 2.004
residuals
GARCH
1.046 2.054
residuals
3. CNY ETN
0 2.255
returns
ARMA
1.056 2.012
residuals
GARCH
1.021 1.926
residuals
4. ICI ETN
1.604 2.019
returns
ARMA
1.014 2.022
residuals
GARCH
1.021 1.926
residuals
5. URR ETN
1.002 2.113
returns
ARMA
1.079 2.185
residuals
GARCH
1.044 2.086
residuals
Note: n.v. – no value
3
4
Embedding Dimensions
5
6
7
8
9
10
2.791
3.391
3.887
4.504
4.453
4.978
4.998
4.911
2.95
3.567
3.975
4.461
4.643
5.201
4.723
5.195
2.554
3.17
3.787
3.825
4.292
4.266
4.647
4.989
2.896
3.541
3.972
4.355
4.76
4.862
5.017
5.013
2.925
3.541
3.831
4.39
4.312
4.85
5.102
5.59
2.911
3.691
4.165
4.879
5.102
5.277
5.775
5.627
3.16
3.87
4.300
4.683
4.99
5.191
5.749
5.653
2.789
3.368
3.683
3.95
3.797
4.153
4.607
4.066
2.624
3.061
3.606
3.81
4.146
4.546
4.099
4.438
2.932
3.623
4.169
4.695
4.85
5.448
5.426
5.291
2.765
3.394
4.182
4.138
4.867
4.91
4.869
5.209
2.624
3.061
3.606
3.81
4.146
4.546
4.099
4.438
3.127
3.92
4.474
5.079
5.486
5.848
5.874
n.v.
3.116
3.743
4.443
4.482
5.206
4.456
4.818
5.244
2.986
3.682
4.193
4.828
4.709
5.275
5.011
5.028
33
significantly asymptotic to 0.5. These findings are consistent with Peters (1994)1
and Opong et al. (1999), and in the expectations of this paper. This research also
concludes that currency ETNs have persistent and trend-reinforcing series, in
which having an upward (downward) trend in the last period, will continue to be
positive (negative) in the following period.
4.2.3. Correlation Dimension Analysis results
The last test done to finally conclude for the chaotic properties of currency
ETN returns is shown in Table 6, wherein the correlation dimension estimates
were utilized. This paper observed that as the embedding dimensions gradually
increased from 1 to 10, the correlation dimension generally increases. This
behavior tells that the underlying data of ETN returns, ARMA and GARCH
residuals is consistent with chaos as defined by Wei and Leuthold (1998). Thus,
this paper concludes the currency ETN returns are consistent with chaos and these
findings also conforms to the study of Kyrtsou et al. (2004) of the French CAC40
index returns.
In sum, the ARFIMA-FIGARCH models generally concluded that the returns
structure cannot be generated by any autoregressive (AR) model which is a type of
a stochastic process, while the volatility structure was defined to have
long-memory properties and non-stationary. Further tests showed that currency
ETN returns, ARMA residuals and GARCH residuals are consistent with
deterministic chaos, which explains the initial results of ARFIMA-FIGARCH
processes of deterministic properties. The economic implication of these findings
is that practitioners should be cautious in trying to predict return and volatility
movements of currency ETNs using AR processes. They would generally find
misleading forecast that maybe detrimental to possible earnings of profits and
worse can create losses, because the inherent structure is defined by chaotic
properties.
5 Conclusions
This paper utilized ARFIMA-FIGARCH models to indentify long-memory
properties of currency ETNs. The study found that the returns of CNY and ICI
ETNs exhibited a non-invertible stationary process. For the return volatility
outcomes of the FIGARCH model, ERO ETN sample showed non-stationarity and
is also difficult to model. However, the volatility structure of the remaining
DRR, CNY, ICI and URR returns exhibited long-memory processes in their
volatility structures. Since the study samples showed non-stationarity and
non-invertibility properties, but with enough evidence to prove its long-memory
1
Peters (1994) explained that if a time-series is determined by a chaotic process, the Hurst
exponent, which developed by Hurst (1951) would be much closer to 0.5 after scrambling the data
than the one before scrambling.
34
properties, these make us conclude that the efficient market hypothesis of Fama
(1970) did not apply for the volatility of currency ETNs. The tendency of currency
ETN returns to eventually move back towards the average rate in the long-run is a
possibility.
To further understand their behavior, BDS, R/S Analysis and Correlation
Dimension tests were applied and concluded that the time-series showed
evidences of chaos. The BDS test found that ETN returns and ARMA residuals
are not iid, and that conventional linear methodsare not suited for their analysis.
This test initially cannot ensure the iid properties of GARCH residuals, except for
CNY and URR. However, when the R/S analysis was conducted, all Hurst
exponents of the currency ETN returns, ARMA and GARCH residuals became
significantly asymptotic to 0.5 after scrambling the data which means that a
chaotic tendency is present. This study also concludes that the data have persistent
and trend-reinforcing series. The correlation dimension analyses was also used
to supplement the first two tests and observed that as the embedding dimensions
gradually increased from 1 to 10, the correlation dimension generally increases,
further confirming a deterministic chaos for the time-series.
Fund managers and traders attempting to forecast return and volatility of
currency ETNs utilizing AR processes would fail to incur additional gains and in
worse cases may suffer losses, because their behavior is inherently chaotic.
Also, general stakeholders like the government and the investing public will have
a good working knowledge of the nonlinear properties of ETNs in helping them
make informed choices based on their risk preferences in selecting currency ETNs
for investments. On the other end, the findings can also solidify or melt present
knowledge of academicians from the pool of financial time-series literatures, and
also lead their future studies to further explore huge unchartered territories of
ETNs. Researchers will be able to gain some insights on the tendencies of this
new investment and at the same time acquire some ideas on some possible models
that can be applied to other financial instruments.
References
[1] Adrangi, B., Allender, M., Chatrath, A. and Raffiee, K., Nonlinearities and
chaos: Evidence from exchange rates, Atlantic Economic Journal, 38(2),
(2010), 247-248.
[2] Antoniou, A. and Vorlow, C., Price clustering and discreteness: Is there
chaos behind noise?, Physica A, 348, (2005) , 389-403.
[3] Baillie, R., Long memory processes and fractional integration in
econometrics, Journal of Econometrics, 7, (1996), 35-59.
[4] Baillie, R., Bollerslev, T. and Mikkelsen, H., Fractionally integrated
generalized
autoregressive conditional heteroskedasticity, Journal of
Econometrics, 74, (1996), 3–30.
35
[5] Beine, M., Laurent, S. and Lecourt, C., Accounting for conditional
leptokurtosis and closing days effects in FIGARCH models of daily exchange
rates, Applied Financial Economics, 12(8), (2002), 589-600.
[6] Blank, S., Chaos in futures markets? A non-linear dynamical analysis.
Journal of Futures Markets, 11, (1991), 711-728.
[7] Box, G. and Jenkins, G., Time series analysis, forecasting and control,
Holden Day, San Francisco, (1976).
[8] Brock, W., Dechert, W. and Scheinkman, J. (1996) A test for independence
based on correlation dimension, Econometric Reviews, 15(3), 197-235.
[9] Bubak, V., Kocenda, E. and Ikes, F., Volatility transmission in emerging
European foreign exchange markets, Journal of Banking and Finance, 10,
(2011), 1-13.
[10] Cai, F., Howorka, E. and Wongsman, J., Informational linkages across
trading regions: Evidence from foreign exchange markets, Journal of
International Money and Finance, 27, (2008), 1215-1243.
[11] Choi, K. and Hammoudeh, S., Long memory in oil and refined products
markets, Energy Journal, 30(2), (2009), 97-116.
[12] Das, A. and Das, P., Chaotic analysis of the foreign exchange rates, Applied
Mathematics and Computation, 185, (2007), 388-396.
[13] Eldridge, M., Bernhardt, C and Mulvey, I., Evidence of chaos in the S&P 500
cash index, Advances in Futures and Options Research, 6, (1993), 179-192.
[14] Enders, W. Applied econometric time series, Hoboken, NJ: John Wiley &
Sons, (2004).
[15] Engle, R. Autoregressive conditional heteroscedasticity with estimates of the
variance of United Kingdom inflation, Econometrica, 50, (1982), 987-1007.
[16] Fama, E., Efficient capital markets: A review of theory and empirical work,
Journal of Finance, 2, (1970), 383-417.
[17] Granger, C. and Joyeux, R., An introduction to long memory time series
models and fractional differencing, Journal of Time Series Analysis, 1,
(1980), 15-39.
[18] Grassberger, P. and Procaccia, I., Measuring the strangeness of strange
attractors, Physica D, 9, (1983), 189-208.
[19] Hafner, C., and Herwartz, H., Volatility impulse responses for MGARCH
models: An exchange rate illustration, Journal of International Money and
Finance, 25, (2006), 719-740.
[20] Henry, O. and Olekalns, N., Does the Australian dollar real exchange rate
display mean reversion, Journal of International Money and Finance, 21,
(2002), 651-666.
[21] Hsieh, D., Chaos and nonlinear dynamics: Application to financial markets,
Journal of Finance, 46, (1991), 1839-1877.
[22] Hosking, J., Fractional differencing, Biometrika, 68, (1981), 165-176.
[23] Hurst, H., Long-term storage capacity of resevoirs, Transactions of the
American Society of Civil Engineers, 116, (1951), 770-799.
[24] Jin, Y., Competitions hatch butterfly attractors in foreign exchange markets,
36
[25]
[26]
[27]
[28]
[29]
[30]
[31]
[32]
[33]
[34]
[35]
[36]
[37]
[38]
[39]
[40]
[41]
[42]
Physica A; 348, (2005), 380-388.
Kang, S.H. and Yoon, S.M., Long memory properties in return and volatility:
Evidence from the Korean stock market, Statistical Mechanics and Its
Applications, 385(2), (2007), 591-600.
Korkmaz, T., Cevik, E. and Ozatac, N., Testing for long memory in ISE
using ARFIMA-FIGARCH model and structural break test, International
Research Journal of Finance and Economics, 26, (2009), 188-191.
Kyrtsou, C., Labys, W. and Terraza, M., Noisy chaotic dynamics in
commodity markets, Empirical Economics, 29(3), (2004), 489-502.
Kyrtsou, C. and Terraza, M., Stochastic chaos or ARCH effects in stock
series?, International Review of Financial Analysis, 11, (2002), 407-431.
Mandelbrot, B. and Wallis, R., Robustness of the rescaled range R/S in the
measurement of noncyclic long-run statistical dependence, Water Resources
Research, 5, (1969), 967-988.
Mariani, M., Libbin, J., Martin, K. Ncheuguim, E., Beccar, M. Varela,V.,
Mani, K. Erickson, C. and Valles-Rosales, D. Levy models and long
correlations applied to the study of exchange traded funds, International
Journal of Computer Mathematics, 86(6), (2009), 1040-53.
Moshiri, S. and Faezeh, F., Forecasting nonlinear crude oil futures prices,
Energy Journal, 27, (2006), 81-95.
Nouira, L., Ahamada, I., Jouini, J. and Nurbel, A., Long-memory and shifts
in the unconditional variance in the exchange rate Euro/US Dollar returns,
Applied Economics Letters, 11, (2004), 591-594.
Opong, K., Mulholland, G., Fox, A. and Farahmand, K., The behaviour of
some UK equity indices: An application of Hurst and BDS tests, Journal of
Empirical Finance, 6, (1999), 267-282.
Panas, E., Long memory and chaotic models of prices on the London Metal
Exchange, Resource Policy, 27, (2001), 235-246.
Panas, E. and Ninni, V. Are oil prices chaotic? A non-linear dynamic
analysis, Energy Economics, 22, (2000), 549-568.
Peters, E., Fractal market analysis: Applying chaos theory to investment and
Economics, Wiley: New York, (1994).
Rompotis, G., Predictable patterns in ETFs’ return and tracking error, Studies
in Economics and Finance, 28(1), (2011), 14-35.
Serletis, A. and Gogas, P., The North American natural gas liquids markets
are chaotic, Energy Journal, 1(20), (1999), 83-103.
Smith, J. Small, K., Weighing the risks: Are exchange-traded notes right for
your clients? Journal of Financial Planning, 23(10), (2010), 56-65.
Tan, S. and Khan, M., Long memory features in return volatility of the
Malaysian stock market, Economics Bulletin, 30(4), (2010), 3267-81.
Wallis, J. and Matalas, N., Small sample properties of H&K estimators of the
Hurst Coefficient, Water Resources Research, 6, (1970), 1583-1594.
Washer, K. and Jorgensen, R., Exchange-traded notes and the Lehman
bankruptcy, Academy of Accounting and Financial Studies Journal, 15(1),
37
[43]
[44]
[45]
[46]
(2011), 47-57.
Wei, A. and Leuthold, R. Long agricultural prices: ARCH, long memory or
chaos processes? OFOR Paper No. 98-03, (1998).
Wright, C., Diavatopoulos, D. and Felton, J., Exchange-traded notes: An
introduction, Journal of Investing, 19(2), (2010), 27-30.
Yang, J., Cabrera, J. and Wang, T., Nonlinearity, data-snooping, and stock
index ETF return predictability, European Journal of Operational Research,
200(2), (2010) 498-507.
Yudin, A., From chaos to trends in forex, Futures: News, Analysis and
Strategies for Futures, Options and Derivatives Traders, 37(4), (2008), 38-40.
.