The Fama-French three-factor model in Vietnam - a quantile regression approach
Bạn đang xem bản rút gọn của tài liệu. Xem và tải ngay bản đầy đủ của tài liệu tại đây (523.56 KB, 18 trang )
Tran Thi Tuan Anh
The Fama-French Three-Factor Model in
Vietnam - A Quantile Regression Approach
Tran Thi Tuan Anh(1)
Received: 18 July 2017 | Revised: 12 December 2017 | Accepted: 20 December 2017
Abstract: This paper aims to test the validity of the Fama and French
three factor model in the Vietnam stock market by using the data of daily
transactions collected from 313 stocks listed on the Ho Chi Minh Stock
Exchange (HOSE) in the period from October 2011 until October 2016.
Quantile regression is applied to investigate the effects of each factor in
the Fama-French model over the entire distribution of excess return. The
study result shows the suitability of the Fama and French three-factor
model in the Vietnam’s context. The excess return of stocks listed on HOSE
is positively correlated with two factors in the Fama-French model which
are the market risk, the book-to-market value ratio (BE/ME) and negatively
correlated with the firm size. This result is consistent with the Modern
Portfolio Theory which is based on the idea that the higher risk an investor
takes, the higher return he achieves. However, the magnitude of the
impact of each factor in the Fama-French model is subject to the quantiles
of the excess stock return. In general, at the tail quantiles (lower and upper
quantiles) of the excess return distribution, the ceteris paribus, the effect
of the risk premium through the beta coefficients and the value premium
through BE/ME ratio is stronger than that of the middle quantiles.
Keywords: Fama and French three-factor model, quantile regression,
risk premium, size premium, value premium.
jel Classification: C58 . G12 . G17 . G23 . G32 .
Citation: Tran Thi Tuan Anh (2017). The Fama-French Three-Factor Model
in Vietnam - A Quantile Regression Approach. Banking Technology Review,
Vol 1, No.2, pp. 239-256.
Tran Thi Tuan Anh - Email:
(1)
University of Economics Ho Chi Minh city
59C Nguyen Dinh Chieu Street, District 3, Ho Chi Minh city.
Volume 1: 149-292 | No.2, December 2017 | banking technology review
239
THE FAMA-FRENCH THREE-FACTOR MODEL IN VIETNAM: A QUANTILE REGRESSION APPROACH
1. Introduction
The capital asset pricing model (CAPM) is built and developed on the theory
of investment portfolio and market portfolio by Markowitz (1952), Sharpe (1964),
Treynor (1961) and Lintner (1965). The CAPM describes the relationship between
systematic risk and expected return for stocks. However, Fama & French (1992)
argued the CAPM is impractical due to the set of strict assumptions. Furthermore,
many empirical studies carried out by Banz (1981), Rosenberg, Reid & Lanstein
(1985), Chan, Yasushi & Josef (1991) show that in addition to the market risk, there
are many factors contributing to the volatility of the financial asset return. One of
the important extensions for the CAPM is the three-factor model introduced by
Fama et al. (1992).
In addition to the market risk, Fama et al. (1992) identify two other
important factors to determine the rate of return on securities - the firm size and
the book-to-market value. After the Fama-French three-factor model was first
introduced, a number of empirical studies were carried out to test the applicability
of the model in many countries including developed and emerging economies.
In Vietnam, the first applications of the Fama-French model were in 2008 with
the studies of Vuong Duc Hoang Quan & Ho Thi Hue (2008). Since then, the
Fama-French model has been widely used. However, most previous studies
examined the performance of the model by the mean linear regression. With this
research, quantile regression is applied to investigate the effect of each factor in
the Fama-French model - the market risk, firm size and book-to-market value on the securities return over the entire distribution of excess return. Testing the
performance of the Fama-French model in the Vietnam securities market by
quantile regression will provide convincing empirical evidence on explaining the
volatility of the return rate of stocks listed on the Vietnam stock market.
For the purpose of this research, the remainder of this paper proceeds as follows:
Section 2 outlines the theoretical basis of the Fama-French three-factor model
and some related empirical research; Section 3 describes data, quantile regression
method and the application of this method to the Fama-French three-factor model;
Section 4 shows the research result and empirically estimates the Fama-French
three-model by quantile regression with data collected from the HOSE; Section 5
mentions some key conclusions and implications from the study research.
2. Literature Review
2.1. Theoretical Background
240 banking technology review | No.2, December 2017 | Volume 1: 149-292
Tran Thi Tuan Anh
The Fama-French three-factor model is defined by the equation:
Rpt - Rft = αpt + βp (Rmt - Rft) + Sp SMBt + hpHMLt + εpt
(1)
Where: Rpt - return of portfolio p; Rmt - return of market portfolio; Rft - risk-free
return; (Rpt- Rft) - excess return of portfolio p; (Rmt- Rft) - excess return of market
portfolio.
SMBt (Small minus big) accounts for the size firm factor which computes the
premium return that a portfolio manager achieves by investing in stocks with small
market capitalization rather than stocks with big market capitalization. Therefore,
SMB is also referred to as a size premium.
SMB = (SL + SM + SH)/3 - (BL + BM + BH)/3
(2)
HMLt (High minus low) accounts for the book-to-market value factor which
computes the value premium that a manager achieves by investing in stocks with
high book-to-market ratios, also known as value stocks rather than those with low
book-to-market ratios, known as growth stocks.
SMB = (SH + BH)/2 - (SL + BL)/2
(3)
Where: βp - coefficient of market risk premium for portfolio p; sp - coefficient
of size premium for portfolio p; hp - coefficient of value premium for portfolio p;
αp - intercept coefficient in the regression, known as an investment’s return over its
benchmark.
2.2. Empirical Studies
Since the Fama-French model was first introduced in 1992, there have been
several empirical studies carried out to test the performance of this model in
different economies.
In the three-factor model, Fama & French estimate the role of the risk
premium, size premium and value premium as well as other factors in stocks listed
on the NYSE, AMEX, and NASDAQ from January 1963 until December 1993. The
authors explore that both firm size and book-to-market value play a crucial role in
calculating the return of an investment portfolio. Billou (2004) also, empirically
examines the Fama-French three-factor model in the NYSE, AMEX, and NASDAQ
but in a longer period from July 1926 until December 2003. Furthermore, there
Volume 1: 149-292 | No.2, December 2017 | banking technology review
241
THE FAMA-FRENCH THREE-FACTOR MODEL IN VIETNAM: A QUANTILE REGRESSION APPROACH
are many studies of the Fama-French model for the developing and emerging
economies such as Japan by Charitou & Constantinidis (2004), Australia by Gaunt
(2004), India by Bhavna (2006), Brazil by Silva (2006), France by Trimech, Kortas,
Benammou & Benammou (2009), Indonesia by Ferdian, Omar & Dewi (2011) and
Egypt by Eraslan (2013). All these researches highlight the role of the risk premium,
size premium and value premium in explaining the return of securities as well as
investment portfolio.
In Vietnam, since some first studies published in the 2000’s, the Fama-French
three-factor model has become popular. Tran Thi Hai Ly (2010) examines the
model with data collected from the HOSE in the period 2004-2007. It is found that
the HML positively affects the return of a financial asset while the SML shows the
reverse impact. Truong Dong Loc & Duong Thi Hoang Trang (2014) tested the
performance of the three-factor model in the Vietnam stock market in the period
2006-2012 and concluded the impact of the SMB and HML on the excess stock
return is consistent with the theory.
However, most of the researches carried out on the validity of the Fama-French
model assumes that the stock return follows a standard distribution. In practice,
this assumption is hardly satisfied as many studies by Levhari & Levy (1977), Knez
& Ready (1997), Horowitz, Loughran & Savin (2000) have proved the stock return
has a heavy-tailed distribution. With a view to improving this disadvantage, Ma &
Pohlman (2008), Allen, Singh & Powell (2011) test the Fama-French model with a
quantile regression approach. According to Han & Naiman (2007), the advantage
of the quantile regression is its suitability in the event of the regression error not
following normal distribution. In addition, it is capable of minimizing the impact of
outliers and most importantly examining the impact of each independent variable
over the entire distribution of dependent variables rather than just the mean of
normal distribution.
Therefore, this research takes advantage of the quantile regression in examining
the Fama-French three-factor model in Vietnam’s context and evaluating the role
of Rmt - Rfm, SML and HML in explaining the excess return of a portfolio at given
levels of quantile.
3. Data and Methodology
3.1. Data
The research data is collected from the closing price of 313 stocks listed on
the HOSE from October 2011 until October 2016. Based on the company’s market
242 banking technology review | No.2, December 2017 | Volume 1: 149-292
Tran Thi Tuan Anh
capitalization, the stocks are divided into two groups: small-cap stocks (small (S))
and big-cap stocks (big (B)). In terms of the book-to-market ratio, the stocks are
divided into three groups: high (H), medium (M) and low (L). Combining two
criteria six portfolios: SL, SM, SH, BL, BM and BH.
3.2. Methodology
For each portfolio, the Fama-French three-factor model defined by equation
(1) is estimated relatively by the ordinary least squares and quantile regression. If
(rpt= Rpt- Rft) represents the excess return of portfolio p and (rmt= Rmt- Rft) represents
the excess return of market, the Fama-French three-model can be rewritten as:
rτpt = ατpt + βτprmt + Sτp SMBt + hτpHMLt + εpt
(4)
Where: τ ∈ (0,1) - chosen quantile for regression
Koenker & Bassett (1978) first introduced the method of quantile regression
in 1978. Traditional method of OLS regression focuses on finding the least squares
regression equation to obtain the conditional mean of the response variable.
Koenker & Bassett (1978) suggests estimating the regression coefficients on each
quantile of dependent covariates that gives the minimum sum of absolute difference
at quantile τ.
The conditional quantile function of Y given by X at quantile τ is the function
where the coefficient βτ is estimated that gives the minimum sum of errors at
quantile τ:
βτ = arg min τ ∑ (yi - Xiβτ) + (τ - 1) ∑ (yi - Xiβτ)
βτ
yi ≥ Xiβτ
yi ≥ Xiβτ
(5)
With the application of quantile regression in the Fama-French three-factor
model, the result shows the margin impact of risk premium, size premium and
value premium on the excess portfolio return at each quantile. In addition, quantile
regression reveals the effect of each factor - rmt, SMB, HML - over the entire
distribution of excess return without the assumption of normal distribution.
Although quantile regression can be performed at any quantile τ ∈ (0,1), the
this paper chooses quantiles at 0.10 - 0.25 - 0.5 - 0.75 and 0.90. This combination
of quartiles and deciles is commonly used in empirical studies with the quantile
regression approach. Quantile regression results on six portfolios - SL, SM, SH,
BL, BM, and BH accompanying with the OLS result and quantile coefficients
Volume 1: 149-292 | No.2, December 2017 | banking technology review
243
THE FAMA-FRENCH THREE-FACTOR MODEL IN VIETNAM: A QUANTILE REGRESSION APPROACH
are illustrated on the graph. Therefore, it is more convenient to compare and
recognize the direction of the impact of rmt, SMB, HML at different quantiles of
excess returns.
The advantage of the application of quantile regression in explaining the excess
stock return has been discussed in several studies. According to Allen et al. (2011),
the factor models do not necessarily follow a linear relationship. Further, the
traditional method of OLS becomes less effective when it comes to analysing the
extremes within a distribution, which is often the key interest of investors and risk
managers.
4. Results and Discussion
4.1. Descriptive Statistics
Table 1 illustrates descriptive statistics including the mean, standard deviation,
minimum, maximum and the result of standard deviation on each portfolio - SL,
SM, SH, BL, BM and BH - as well as the model factors rmt, SMB and HML.
Table 1. Descriptive statistics
Mean
SL
SM
SH
0.173
0.039
-0.052
BL
0.105
BM
BH
0.026
-0.055
SMB
HML
rmt
0.028 -0.193 -0.008
Median
0.221
0.112
-0.006
0.135
0.093
0.001
0.033 -0.188
0.033
Maximum
3.532
3.730
3.611
3.928
4.029
4.446
2.159
11.497
Minimum
-4.798 -4.684 -4.984 -5.051
-5.719
-6.142
-1.679 -2.287 -6.877
Standard
Deviation
0.939
1.159
1.525
0.503
0.739
-0.521
-0.350
0.050
0.099 -0.544
Skewness
Kurtosis
Jarque-Bera
p-value
0.883
1.150
0.955
-0.463 -0.668 -0.349 -0.723
4.326
5.507
1.123
5.931
4.691
3.807
3.428
3.238
5.449
32265 99638 25944
131870
48733
14076
2393
1190
88647
0.000
0.000
0.000
0.000
0.000 0.000
0.000
4.270
2.760
0.000
0.000
The descriptive statistics reveals that the portfolio returns do not follow normal
distribution since the Jarque-Bera test rejects the null hypothesis of the normal
distribution of the return. This result has proved the necessity of using quantile
regression technique. In general, the mean return of portfolios with small size (SL,
SM, SH) is higher than that of portfolios with big size (BL, BM, BH). Similarly, the
mean return of portfolios with high book-to-market value ratio (SH, BH) is lower
than that of portfolios with low book-to-market value ratio (SL, BL).
The fact that SMB factor having positive mean implies an negative relationship
244 banking technology review | No.2, December 2017 | Volume 1: 149-292
Tran Thi Tuan Anh
between the securities return and the firm size. Meanwhile, the HML factor has a
negative mean which implies the higher book-to-market value ratio is, the lower
return a stock can achieve and vice versa. The result of this descriptive statistics
is consistent with previous descriptive statistics on each portfolio and previous
studies in Vietnam such as Vuong Duc Hoang Quan et al. (2008).
4.2. Regression Results
4.2.1. Fama-French Three-Factor Model Regression Analysis
The regression result of Fama-French three-factor model via linear regression
with the entire data sample collected from 313 stocks listed on the HOSE in the
period 2011-2016 is illustrated in column 1, Table 2. The regression result of
each portfolio SL, SM, SH, BL, BM and BH are shown in column 2 to column 7.
The regression result of entire portfolio is consistent with the theory where the
coefficients of the rmt, SMB and HML are positive and statistically significant.
Accordingly, an investor will gain higher return at higher risk including market
risk, size risk and value risk.
Table 2. Regression result on the entire data sample and each portfolio
Entire
data
sample
SL
SM
SH
BL
BM
BH
(1)
(2)
(3)
(4)
(5)
(6)
(7)
rmt
0.644***
[115.97]
0.716***
[33.20]
0.628***
[40.55]
0.695***
[53.60]
0.684***
[67.24]
0.652***
[48.71]
0.709***
[42.11]
SMB
0.194***
[15.03]
0.712***
[14.25]
0.587***
[16.15]
0.776***
[25.77]
-0.275***
[-11.60]
-0.296***
[-9.53]
-0.338***
[-8.56]
HML
0.470***
[63.66]
-0.00154
[-0.05]
0.434***
[20.89]
1.021***
[59.53]
0.0187
[1.38]
0.442***
[25.06]
0.999***
[44.56]
0.0909*** 0.125*** 0.0767*** 0.0947*** 0.0883*** 0.0923***
[18.18]
[6.43]
[5.45]
[8.12]
[9.61]
[7.67]
0.115***
[7.59]
Factor
Intercept
Note: ***, ** and * are the significance levels of 1%, 5% and 10% respectively.
The cofficients' magnitude of the excess market return on the stock return is
quite similar in all portfolios with ranging from 0.62 to 0.72. In contrast with rmt,
the coefficient of size premium SMB on portfolios with small-cap stocks is positive,
while the coefficient of size premium is negative with big-cap stocks.
Volume 1: 149-292 | No.2, December 2017 | banking technology review
245
THE FAMA-FRENCH THREE-FACTOR MODEL IN VIETNAM: A QUANTILE REGRESSION APPROACH
Similarly, the value premium HML has no statistical significance on portfolios
with low book-to-market value ratio (SL, BL) but has strongly positive effect on
portfolios with high book-to-market value ratio (SM, BM, SH, BH). This result is
consistent with studies by Tran Thi Hai Ly (2010), Truong Dong Loc et al. (2014)
which use the traditional method of OLS regression to test the performance of the
CAPM in the Vietnam context.
4.2.2. Quantile Regression on the Entire Data Sample
The impact of rmt, SMB and HML on the entire data sample is also found
positive at all chosen quantiles. The result of quantile regression is illustrated in
column 2 to 6, Table 3. Although the regression coefficients are positive across
all quantiles, their magnitudes varies between different quantiles. The change in
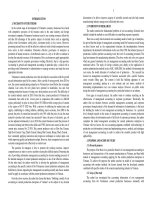
regression coefficients at each quantiles are shown in Figure 1.
Table 3. The regression result of the Fama-French three-factor model
on the entire data sample
Factor
OLS
Quantile regression
Q10
Q25
Q50
Q75
Q90
(1)
(2)
(3)
(4)
(5)
(6)
rmt
0.644***
[115.97]
0.741***
[57.47]
0.760***
[106.77]
0.447***
[127.02]
0.668***
[82.89]
0.614***
[43.50]
SMB
0.194***
[15.03]
0.210***
[7,00]
0.151***
[9.09]
0.103***
[12.61]
0.144***
[7.67]
0.342***
[10.38]
HML
0.470***
[63.66]
0.653***
[38,09]
0.468***
[49.38]
0.269***
[57.50]
0.516***
[48.17]
0.621***
[33.07]
Intercept
0.091***
[18.18]
-2.997***
[-257,97]
-1.236***
[-192.54]
-0.00134
[-0.42]
1.417***
[195.24]
3.474***
[272.96]
Note: ***, ** and * are the significance levels of 1%, 5% and 10% respectively.
Figure 1 includes graphs showing the change in the intercept, coefficients of rmt,
SMB and HML at quantiles ranging from 0.01 to 0.99. In this scope of research,
the chosen quantiles are expressly the quantiles for the stock return. In the ceteris
paribus, high quantiles represent stocks with high rate of return while low quantiles
imply stocks with low return. In each graph, the horizontal line demonstrates OLS's
coefficients whereas the curve shows the regression coefficients at each quantile.
With regard to the market and value premium, the impact of rmt and HML on
the stock return is lowest at middle quantiles (0.50) and reaches highest at left tail
246 banking technology review | No.2, December 2017 | Volume 1: 149-292
Tran Thi Tuan Anh
Figure 1. Regression coefficients of three factors
in the Fama-French model via quantile
quantiles (0.10 and 0.25). In terms of the size premium, the lowest impact is found
at middle quantiles around the median and the highest impact occurs at quantiles
in the right tail area.
4.2.3. The Result of Quantile Regression on Each Portfolio
• Quantile regression on portfolio SL
Table 4 demonstrates the OLS and quantile regression results of SL portforlio's
excess returns in portfolio SL. The coefficients of rmt and SMB are positive and
statistically significant at the 1% level which is consistent with theory of Fama-French
while the HML coefficient is negative and has no statistical significance. This result
is consistent with the study by Truong Dong Loc et al. (2014). With regard of
particular quantiles, the HML factor has no statistical significance at most quantiles,
except quantile 0.25. With the entire data sample, the impact of the excess return
and risk premium is relatively high at right tail quantiles of distribution and low at
middle quantiles.
• Quantile regression on portfolio SM
According to the result of OLS regression illustrated in column 1, Table 5,
the risk premium, size premium and value premium have a positive impact and
statistical significance to the return of portfolio SM. The OLS regression result only
Volume 1: 149-292 | No.2, December 2017 | banking technology review
247
THE FAMA-FRENCH THREE-FACTOR MODEL IN VIETNAM: A QUANTILE REGRESSION APPROACH
Table 4. Regression result on portfolio SL
Factor
OLS
rmt
Quantile regression
Q10
Q25
Q50
Q75
Q90
0.716***
[33.20]
1.022***
[18.91]
0.798***
[26.65]
0.373***
[32.31]
0.796***
[22.01]
0.713***
[14.15]
SMB
0.712***
[14.25]
1.130***
[9.03]
0.631***
[9.10]
0.263***
[9,81]
0.839***
[10.02]
1.024***
[8.77]
HML
-0.00154
[-0.05]
-0.0018
[-0.03]
0.0802**
[2.04]
0.0138
[0.91]
0.0155
[0.33]
-0.0739
[-1.12]
Intercept
0.125***
[6.43]
-3.591***
[-73.93]
-1.310***
[-48.69]
0.0146
[1.41]
1.598***
[49.17]
4.116***
[90.90]
Note: ***, ** and * are the significance levels of 1%, 5% and 10% respectively.
Figure 2. Regression coefficents of portfolio SL via quantile
shows the impact of model factors on the mean of excess return but fails to show
different impact at different quantiles for the excess return. Therefore, with the
aim of examining the specific impact of each factor on particular quantile in the
excess return distribution, quantile regression is carried out. The result of quantile
regression technique shows the positive impact of the size premium and value
premium on the return of portfolio SM at all chosen quantiles which strengthens
the positive relationship and statistical significance of the HML and SMB on the
248 banking technology review | No.2, December 2017 | Volume 1: 149-292
Tran Thi Tuan Anh
portfolio return. However, the magnitude of their impacts varies between different
quantiles. In general, the impact of model factors at quantiles in two tails of the
distribution is higher than that at middle quantiles (quantile 0.5).
• Quantile regression on portfolio SH
Table 6 reveals the regression result of the Fama-French model on portfolio SH.
With this portfolio, the regression coefficients of three factors are positive which is
consistent with the theory and have statistical significance at every quantile.
Table 5. Regression result on portfolio SM
Factor
OLS
rmt
Quantile regression
Q10
Q25
Q50
Q75
Q90
0.628***
[40.55]
0.661***
[17.07]
0.780***
[33.64]
0.408***
[44.03]
0.704***
[28.01]
0.519***
[15.80]
SMB
0.587***
[16.15]
0.729***
[8.03]
0.583***
[10.72]
0.314***
[14.44]
0.604***
[10.25]
0.741***
[9.61]
HML
0.434***
[20.89]
0.513***
[9.89]
0.503***
[16.19]
0.275***
[22.18]
0.489***
[14.53]
0.457***
[10.38]
Intercept
0.0767***
[5.45]
-3.710***
[-105.62]
-1.467***
[-69.71]
0.0339***
[4.03]
1.714***
[75.12]
3.981***
[133.50]
Note: ***, ** and * are the significance levels of 1%, 5% and 10% respectively.
Figure 3. Regression coefficients of portfolio SM via quantile
Volume 1: 149-292 | No.2, December 2017 | banking technology review
249
THE FAMA-FRENCH THREE-FACTOR MODEL IN VIETNAM: A QUANTILE REGRESSION APPROACH
Table 6. Regression result on portfolio SH
Factor
OLS
rmt
Quantile regression
Q10
Q25
Q50
Q75
Q90
0.695***
[53.60]
0.569***
[22.22]
0.801***
[41.80]
0.688***
[54.86]
0.769***
[44.58]
0.564***
[20.93]
SMB
0.776***
[25.77]
0.587***
[9.89]
0.695***
[15.63]
0.645***
[22.15]
0.914***
[22.81]
0.921***
[14.71]
HML
1.021***
[59.53]
0.910***
[26.90]
1.124***
[44.35]
0.921***
[55.56]
1.201***
[52.63]
0.996***
[27.94]
Intercept
0.0947***
[8.12]
-3.657***
[-158.95]
-1.666***
[-96.74]
0.0724***
[6.42]
1.909***
[123.04]
3.895***
[160.64]
Note: ***, ** and * are the significance levels of 1%, 5% and 10% respectively.
Figure 4. Regression coefficients of portfolio SH via quantile
• Quantile regression on portfolio BL
The regression result on portfolio BL is contrary to the result of portfolio
SL, SM, and SH. According to the result of the OLS regression, the coefficient of
HML factor has no statistical significance while the SMB coefficient is negative
at all quantiles and statistically significant at 1%. With regard to the HML factor,
although it is not statistically significant via OLS regression, it is found statistically
significant at every quantile. In particular, the coefficient of HML factor is positive
250 banking technology review | No.2, December 2017 | Volume 1: 149-292
Tran Thi Tuan Anh
at low quantiles (0.1 - 0.25 - 0.5) and negative at high quantiles (0.75 - 0.9). This
phenomenon is quite interesting as the impact of the value premium reverses at
different quantiles.
Table 7. Regression result on portfolio BL
Factor
OLS
rmt
Quantile regression
Q10
Q25
Q50
Q75
Q90
0.684***
[67.24]
0.816***
[37.38]
0.756***
[68.71]
0.570***
[74.20]
0.689***
[49.72]
0.673***
[24.46]
SMB
-0.275***
[-11.60]
-0.272***
[-5.35]
-0.135***
[-5.25]
-0.177***
[-9.86]
-0.364***
[-11.27]
-0.632***
[-9.85]
HML
0.0187
[1.38]
0.166***
[5.69]
0.0707***
[4.82]
0.0192*
[1.88]
-0.0396**
[-2.15]
-0.0904**
[-2.46]
Intercept
0.0883***
[9.61]
-2.399***
[-121.75]
-1.013***
[-102.02]
0.000624
[0.09]
1.127***
[90.13]
2.924***
[117.67]
Note: ***, ** and * are the significance levels of 1%, 5% and 10% respectively.
Figure 5. Regression coefficients of portfolio BL via quantile
• Quantile regression on portfolio BM
Table 8 illustrates the result of the quantile regression of the Fama-French
model on portfolio BM. The regression coefficient of SMB factor is negative while
the HML coefficient is positive with the OLS as well as all quantiles. With regard to
Volume 1: 149-292 | No.2, December 2017 | banking technology review
251
THE FAMA-FRENCH THREE-FACTOR MODEL IN VIETNAM: A QUANTILE REGRESSION APPROACH
Table 8. Regression result on portfolio BM
Factor
OLS
rmt
Quantile regression
Q10
Q25
Q50
Q75
Q90
0.652***
[48.71]
0.728***
[28.21]
0.745***
[47.51]
0.583***
[51.17]
0.653***
[34.25]
0.647***
[20.49]
SMB
-0.296***
[-9.53]
-0.403***
[-6.73]
-0.246***
[-6.77]
-0.212***
[-8.03]
-0.333***
[-7.54]
-0.329***
[-4.49]
HML
0.442***
[25.06]
0.579***
[17.03]
0.423***
[20.53]
0.355***
[23.64]
0.477***
[19.00]
0.554***
[13.33]
Intercept
0.0923***
[7.67]
-2.604***
[-112.31]
-1.171***
[-83.18]
-0.0135
[-1.32]
1.319***
[76.92]
3.101***
[109.29]
Note: ***, ** and * are the significance levels of 1%, 5% and 10% respectively.
Figure 6. Regression coefficients of portfolio BM via quantile
the market risk, the impact is found significant at the left and right tailed quantiles
(0.1 - 0.25 - 0.75 - 0.9) and weakens at middle quantiles, especially at quantile 0.5.
• Quantile regression on portfolio BH
Table 9 shows the result of quantile regression on portfolio BH. The coefficient
of HML is positive while the SMB coefficient is negative and statistically significant
at every quantile. Unlike other portfolios, the coefficient of rmt is low at tailed
252 banking technology review | No.2, December 2017 | Volume 1: 149-292
Tran Thi Tuan Anh
Table 9. Regression result on portfolio BH
Factor
OLS
rmt
Quantile regression
Q10
Q25
Q50
Q75
Q90
0.709***
[42.11]
0.662***
[24.17]
0.745***
[47.51]
0.802***
[48.93]
0.751***
[34.64]
0.599***
[17.20]
SMB
-0.338***
[-8.56]
-0.523***
[-8.15]
-0.246***
[-6.77]
-0.302***
[-7.86]
-0.309***
[-6.08]
-0.313***
[-3.84]
HML
0.999***
[44.56]
0.953***
[26.14]
0.423***
[20.53]
0.906***
[41.55]
1.087***
[37.69]
1.256***
[27.10]
Intercept
0.115***
[7.59]
-2.681***
[-108.42]
-1.171***
[-83.18]
-0.00724
[-0.49]
1.497***
[76.47]
3.151***
[100.24]
Note: ***, ** and * are the significance levels of 1%, 5% and 10% respectively.
Figure 7. Regression coefficients of portfolio BH via quantile
quantiles (quantile 0.1 and 0.9) and high at middle quantiles (0.25 - 0.5 - 0.75)
whereas the coefficient of HML is low at high quantiles in portfolio BH.
The goodness-of-fit test of the Fama-French three-factor model in Vietnam’s
stock market is quite similar to the regression result in other nations such as the
USA (Allen et al., 2011) and India (Sharma, Gupta & Singh, 2016). These studies
also found that the impact of three factors in Fama-French model varies between
Volume 1: 149-292 | No.2, December 2017 | banking technology review
253
THE FAMA-FRENCH THREE-FACTOR MODEL IN VIETNAM: A QUANTILE REGRESSION APPROACH
different quantiles and proved the effectiveness of quantile regression in analysing
the Fama-French model.
5. Conclusion and Recommendation
This research is carried out to investigate the performance of the Fama-French
model in the Vietnam’s context with data collected from 313 stocks listed on
the HOSE. The estimated results on the entire data sample by OLS and quantile
regression clarifies the suitability of the model in Vietnam’s market. In detail, the
stock return has a positive correlation with the market risk and the book-to-market
value ratio and has an negative correlation with the firm size. This result is
consistent with the Portfolio Theory which states an investor will gain higher return
at higher risk. However, the direction and magnitude of the impact of each factor
vary between different quantiles. Specifically, in the ceteris paribus, high quantiles
correspond to the stocks with high return and vice versa. At middle quantiles, the
impact of the risk premium and value premium is found significantly strong.
The role of the risk premium in explaining the excess return has been clearly
identified in the entire data sample as well as in each portfolio at every quantile.
According to empirical studies, the regression coefficient of the excess market
return is positive at every chosen quantile. However, the impact of the size premium
and value premium varies considerably between different quantiles and portfolios.
In general, with respect to the firm size, the size premium has a positive correlation
with the return of small-cap stock portfolio (SL, SM, SH) at every quantile and has
a negative impact on the return of big-cap stock portfolio (BL, BM, BH). Thus,
investors should take the firm size into consideration before making any investment
decision. Although investing in companies with big capitalization is a safe decision,
it cannot create satisfactory return. In contrast, a portfolio with small-cap stocks
can offer a higher return to the investor. Furthermore, to estimate the magnitude
of the impact of firm size, the investor should also well note the portfolio return
at different quantiles. With respect to the firm value factor, it is suggested that the
investor consider the book-to-market value ratio in different portfolios at specific
quantiles to have a wise investment.
254 banking technology review | No.2, December 2017 | Volume 1: 149-292
Tran Thi Tuan Anh
References
Allen, D. E., Singh, A. K. & Powell, R. (2011) Asset Pricing, the Famafrench Factor
model and the Implications of Quantile Regression Analysis. Palgrave Macmillan, pp.
176-193.
Banz, R. W. (1981). The Relationship between Return and Market Value of Common
Stocks. Journal of Financial Economies, vol. 9, no. 1, pp. 3-18. https:/doi.org/10.1016/0304405X(81)90018-0.
Bhavna, B. (2006). Testing the Fama and French Three-factor model and its Variants for
the Indian Stock Returns. Retrieved from 06 February
2017.
Billou, N. (2004). Tests of the Capm and Fama and French three Factor model. Retrieved
from file:///C:/Users/May39/Downloads/Etd0465.Pdf, 06 February 2017.
Chan, L. K. C., Yasushi, H. & Josef, L. (1991). Fundamentals and stock returns in
Japan. Journal of Financial Economies, vol. 46, pp. 1739-64.
Charitou, A. & Constantinidis, E. (2004). Size and Book-to-market Factors in Earnings
and Stock Returns: Empirical Evidence for Japan, University of Cyprus Working Paper.
Eraslan, V. (2013). Fama and French Threefactor model: Evidence from Istanbul Stock
Exchange. Business and Economics Research Journal, vol. 4, no. 2, pp. 11-22.
Fama, E. & French, K. (1992). The Cross-section of Expected Stock Returns, Journal
of Finance, vol. 47, no. 2, pp. 427-465.
Ferdian, I. R., Omar, M. A. & Dewi, M. K. (2011). Firmsize, Book to Market Equity,
and Securityreturns: Evidence from the Indonesian Shariah Stocks. Journal of Islamic
Economics, Banking and Finance, vol. 7, no. 1, pp. 77-96.
Gaunt, C. (2004). Size and Book-to-market Effects and the Fama French three Factor
Asset Pricing Model: Evidence from the Australian Stockmarket, Accounting and Finance,
vol. 44, no. 1, pp. 27-44.
Hao, L. & Naiman, D. Q. (2007). Quantile Regression. Sage Publications, Inc.
Horowitz, J. L., Loughran, T. & Savin, N. E. (2000). Three Analyses of Thefim size
Premium. Journal of Empirical Finance, vol. 7, no. 2, pp. 143-153.
Knez, P. J. & Ready, M. J. (1997). On the Robustness of size and Book-Tomarket in
Cross-Sectional Regressions. The Journal Of Finance, vol. 52, no. 4, pp. 1355-1382. http://
dx.doi.org/10.2307/2329439.
Koenker, R. & Bassett, J. R. (1978). Regression Quantiles. Econometrica (Pre-1986),
vol. 46, no. 1, pp. 33.
Levhari, D. & Levy, H. (1977). The Capital Asset Pricing model and the Investment
Volume 1: 149-292 | No.2, December 2017 | banking technology review
255
THE FAMA-FRENCH THREE-FACTOR MODEL IN VIETNAM: A QUANTILE REGRESSION APPROACH
Horizon, The Review of Economics and Statistics, vol. 59, no. 1, pp. 92-104.
Lintner, J. (1965). The Valuation of Risky Assets and the Selection of Risky Investments
in Stockportfolios and Capital Budgets, Review of Economics and Statistics, vol. 47, no 1,
pp. 13-37.
Ma, L. & Pohlman, L. (2008). Return Forecasts and Optimal Portfolioconstruction: A
Quantile Regression Approach. The European Journal of Finance, vol. 14, no. 5, 409-425.
Markowitz, H. (1952). Portfolio Selection, Journal of Finance, vol. 7, no. 1, pp. 77-91.
Rosenberg, B., Reid, K. & Lanstein, R. (1985). Persuasive Evidence of Market
Inefficiency. The Journal of Portfolio Management, vol. 11, no. 3, pp. 9-16.
Sharma, P., Gupta, P. & Singh, A. (2016). Pricing Ability of Four Factor Model using
Quantile Regression: Evidences From India, International Journal of Economics And
Financial Issues, vol. 6, no. 4, pp. 1815-1826.
Sharpe, W. (1964). Capital Asset Prices: A Theory of Market Equilibrium under
Conditions of Risk, Journal of Finance, vol. 19, pp. 425-42.
Tran Thi Hai Ly (2010). Mo hinh ba nhan to cua Fama va French hoat dong nhu
the nao tren thi truong chung khoan Viet Nam. Tap chi Phat trien Kinh te, so 239, trang
50-57. (The Performance of Fama-French Three-Factor Model in Vietnam’s Stock Market,
Journal of Economic Development, no. 239, pp. 50-57).
Treynor, J. L. (1961). Market Value, Time and Risk. Unpublished Manuscript Dated
08/8/1961, pp. 95-209.
Trimech, A., Kortas, H., Benammou, S. & Benammou, S. (2009). Multiscale
Fama-French Model: Application to the French Market. The Journal of Risk Finance, vol.
10, no. 2, pp. 179-192.
Truong Dong Loc & Duong Thi Hoang Trang (2014). Mo hinh ba nhan to
Fama-French: Cac bang chung thuc nghiem tu so giao dich chung khoan TP. Ho Chi
Minh, Tap chi Khoa hoc Truong Dai hoc Can Tho, so 32, trang 61-68. (The Fama-French
Three-Factor Model: An Empirical Evidence from Ho Chi Minh City Stock Exchange,
Can Tho University Journal of Science, no. 32, pp. 61-68).
Vuong Duc Hoang Quan & Ho Thi Hue (2008). Mo hinh Fama-French: Mot nghien
cuu thuc nghiem doi voi thi truong chung khoan Viet Nam. Tap chi Ngan hang, so 22,
trang 38-45 (The Fama-French Model: An Empirical Evidence from Vietnam’s Stock
Market, Journal of Banking and Finance, no. 22, pp. 38-45).
256 banking technology review | No.2, December 2017 | Volume 1: 149-292