The prevalence and incidence, resource use and financial costs of treating people with attention deficit/hyperactivity disorder (ADHD) in the United Kingdom (1998 to 2010)
Bạn đang xem bản rút gọn của tài liệu. Xem và tải ngay bản đầy đủ của tài liệu tại đây (843.13 KB, 13 trang )
Holden et al. Child and Adolescent Psychiatry and Mental Health 2013, 7:34
/>
RESEARCH
Open Access
The prevalence and incidence, resource use and
financial costs of treating people with attention
deficit/hyperactivity disorder (ADHD) in the
United Kingdom (1998 to 2010)
Sarah E Holden1, Sara Jenkins-Jones2, Chris D Poole1, Christopher Ll Morgan2, David Coghill3 and Craig J Currie1*
Abstract
Background: Attention deficit/hyperactivity disorder (ADHD) is a common disorder that often presents in
childhood and is associated with increased healthcare resource use. The aims of this study were to characterise the
epidemiology of diagnosed ADHD in the UK and determine the resource use and financial costs of care.
Methods: For this retrospective, observational cohort study, patients newly diagnosed with ADHD between 1998
and 2010 were identified from the UK Clinical Practice Research Datalink (CPRD) and matched to a randomly drawn
control group without a diagnosis of ADHD. The prevalence and incidence of diagnosed ADHD were calculated.
Resource utilisation and corresponding financial costs post-diagnosis were estimated for general practice contacts,
investigations, prescriptions, outpatient appointments, and inpatient admissions.
Results: Incidence of diagnosed ADHD (and percentage change using 1998 as a reference) increased from 6.9 per
100,000 population in 1998 to 12.2 per 100,000 (78%) in 2007 and then fell to 9.9 per 100,000 (44%) by 2009. The
corresponding prevalence figures were 30.5, 88.9 (192%) and 81.5 (167%) per 100,000. Incidence and prevalence
were higher in males than females. Mean annual total healthcare costs were higher for ADHD cases than controls
(£1,327 versus £328 for year 1, £1,196 vs. £337 for year 2, £1,148 vs. £316 for year 3, £1,126 vs. £325 for year 4, and
£1,112 vs. £361 for year 5).
Conclusions: The prevalence of diagnosed ADHD in routine practice in the UK was notably lower than in previous
reports, and both prevalence and incidence of diagnosed ADHD in primary care have fallen since 2007. Financial
costs were more than four times higher in those with ADHD than in those without ADHD.
Keywords: ADHD, CPRD, Prevalence, Incidence, Healthcare cost
Background
Attention deficit/hyperactivity disorder (ADHD) is common and more likely to affect boys than girls, with an
estimated prevalence in the UK of 3.6% and 0.9%, respectively, in children aged 5–15 years, using DSM-IV
criteria [1]. Anecdotally, there is a commonly held belief
that the prevalence of ADHD has risen markedly over
the previous 20 years, with a corresponding increase in
the financial cost of medicines indicated for ADHD
* Correspondence:
1
Primary Care and Public Health, School of Medicine, The Pharma Research
Centre, Cardiff Medicentre, Cardiff University, Cardiff CF14 4UJ, UK
Full list of author information is available at the end of the article
[2,3]. ADHD is a chronic condition that is often associated with significant impairments in academic performance and social functioning [4,5]. Over 65% of those
with ADHD also have one or more comorbid disorders.
These include dyslexia, developmental coordination disorder, Tourette’s syndrome, autistic spectrum disorders,
conduct and oppositional defiant disorders, and substance abuse [4,6]. ADHD is also associated with
disrupted parent–child relationships and increased parent stress levels [4,7]. Treatment costs for patients with
ADHD are greater than those without [8-15].
In the UK, the National Institute for Health and Care
Excellence (NICE) has recommended that diagnosis of
© 2013 Holden et al.; licensee BioMed Central Ltd. This is an open access article distributed under the terms of the Creative
Commons Attribution License ( which permits unrestricted use, distribution, and
reproduction in any medium, provided the original work is properly cited.
Holden et al. Child and Adolescent Psychiatry and Mental Health 2013, 7:34
/>
ADHD and treatment initiation should be conducted
within secondary care [16]. When medication is used
the dose should also be titrated and stabilised by a specialist. Once the patient is stabilised on treatment, prescribing and monitoring can be carried out in primary
care under a shared-care protocol [16]. Whilst the popular press frequently comments on increased rates of
diagnosis of ADHD and questions whether ADHD is
over-diagnosed and over-treated [17], data from reviews
of clinical practice suggest the opposite may be true with
ADHD being both under recognised and under treated
[18]. There are, however, few studies characterising the
epidemiology of diagnosed ADHD in the UK and the
healthcare cost to the NHS of treating children both
with and without ADHD.
The aim of this retrospective, observational cohort
study was to characterise the incidence and prevalence
of diagnosed ADHD and to determine the corresponding resource use and financial cost of care for children,
adolescents, and adults with ADHD compared with a
matched control group over a 12-year period to 2010.
Methods
Data sources
Data were extracted from the CPRD (Clinical Practice
Research Datalink) [19]. CPRD contains clinically rich data
collected in a non-interventional manner from the daily
record-keeping of primary-care physicians in the UK. These
data include demographics, medical history, test results,
outpatient letters, and prescriptions. There are, in total, 143
million acceptable person-years of computerised data in
CPRD, and the dataset is broadly representative of the UK
population. Following record-linkage to NHS hospital episode statistics (HES), CPRD additionally contains details of
inpatient admissions for a proportion of practices in England. The data extract used in this study includes records
up to June 2012. Ethical approval for this study was granted
by the CPRD Independent Scientific Advisory Committee
on 1st March 2012, protocol number 12_025R2.
used for the management of ADHD was defined as a
product containing one of the following drugs: dexamfetamine, methylphenidate or atomoxetine. Pemoline
(indicated for hyperkinetic syndrome but not generally
available in the UK after 1997) [20] and modafinil (not
licensed for the management of ADHD nor for use in children) [21] were not used for case selection. The study
index date was the date of ADHD presentation, taken as
the earlier of their first recorded diagnosis date for ADHD
or their first prescription for a medicine used in the management of ADHD.
Cases were excluded from the analysis if they had a history of narcolepsy. In order to identify incident cases only,
cases with less than six months’ “wash-in” for relevant parameters were also excluded (Additional file 1: Figure S1).
No exclusion criteria based on age were implemented;
however, the results were split by age group (0–5, 6–17
and ≥18 years) because licensed and recommended treatments vary by age. For example, atomoxetine and methylphenidate are not licensed in children younger than
6 years. In addition, the NICE guidelines do not recommend pharmacological treatment in preschool children.
After school leaving age (≤18), NICE recommends that patients should be reassessed before transfer to adult services
to ensure that continuing treatment into adulthood is still
warranted and to facilitate transition. In addition, only atomoxetine is licensed for the treatment of ADHD in adults.
Controls
The healthcare costs and resource use of the ADHD group
were compared to a randomly drawn control group of patients matched on year of birth, gender and GP practice.
Control patients had no history of ADHD and had received
no prescription for a medication indicated for ADHD.
Table 1 Baseline characteristics for cases and controls
Age group
Parameter
Cases
References
All ages
N
3,229
7,429
Males, n (%)
Study population
Cases
Patients were selected from CPRD if they had received
two or more diagnoses for ADHD in their clinical
history, or they had received at least one diagnosis of
ADHD and at least one prescription for a medicine
licensed for the management of ADHD. For cases where
there was no prescription for an ADHD medication, the
requirement of two or more diagnoses was used to avoid
selecting for patients with only a provisional diagnosis
recorded by the GP prior to assessment by a specialist.
Under NICE guidelines, diagnosis should be made by a
mental health specialist; therefore the second diagnosis
is used to confirm that the patient has ADHD. A medicine
Page 2 of 13
Aged 6 to 17 years
at index date
Aged ≥18 years
at index date
2,759 (85%)
6,354 (86%)
Females, n (%)
470 (15%)
1,075 (14%)
Age, mean (sd),
years
10.4 (5.9)
10.4 (6.1)
2,873
6,598
N
Males, n (%)
2,487 (87%)
5,707 (86%)
Females, n (%)
386 (13%)
891 (14%)
Age, mean (sd),
years
9.8 (2.8)
9.8 (2.8)
N
Males, n (%)
141
300
86 (61%)
183 (61%)
Females, n (%)
55 (39%)
117 (39%)
Age, mean (sd),
years
31.7 (10.7)
33.2 (12.3)
Holden et al. Child and Adolescent Psychiatry and Mental Health 2013, 7:34
/>
Incidence of diagnosed ADHD
(per 100,000 person-years)
Cases and controls were included in an annual cost
calculation if they had a complete year’s observation for
the year in question in both CPRD and CPRD-linked HES.
Therefore, patients were excluded from the analysis of the
costs for year 1 if they had less than 12 months’ observations from the index date to the last date of any prescription or the censor date, whichever was earlier. For year 2,
patients were excluded if they did not have a complete
year of data from 366 days to 730 days following their
a)
N
Incidence
index date. The same rule was applied for the calculation
of costs for years three through five.
Diagnostic incidence of ADHD
The incidence of diagnosed ADHD was calculated by
dividing the number of new cases of ADHD each year
by the number of person-years at risk in the CPRD data
set for the same year (including those registered but with
no GP attendance).
90
80
70
60
50
40
30
20
10
0
0-5 years
6-17 years
≥18 years
Overall
0-5 years
6-17 years
≥18 years
Overall
Incidence of diagnosed ADHD
(per 100,000 person-years)
b)
Page 3 of 13
1998
1999
2000
2001
2002
2003
2004
2005
2006
2007
2008
2009
2010
51/293k 34/296k 48/297k 55/297k 39/294k 39/290k 49/289k 44/292k 40/294k 31/299k 29/303k 24/306k
9/303k
277/704k 369/737k 424/770k 424/799k 433/822k 556/842k 626/860k 593/874k 613/875k 688/871k 605/853k 544/838k 486/815k
9/3916k 8/4054k 7/4190k 6/4311k 15/4429k 22/4541k 21/4664k 30/4797k 31/4899k 31/4989k 57/5033k 46/5076k 45/5049k
337/4913k 411/5087k 479/5257k 485/5407k 487/5545k 617/5672k 696/5813k 667/5963k 684/6068k 750/6159k 691/6189k 614/6220k 540/6167k
17.4
11.5
16.2
18.5
13.3
13.4
16.9
15.1
13.6
10.4
9.6
7.9
3.0
39.3
50.1
55.1
53.1
52.7
66.1
72.8
67.8
70.1
79.0
71.0
64.9
59.7
0.2
0.2
0.2
0.1
0.3
0.5
0.5
0.6
0.6
0.6
1.1
0.9
0.9
6.9
8.1
9.1
9.0
8.8
10.9
12.0
11.2
11.3
12.2
11.2
9.9
8.8
140
120
100
80
60
40
20
0
N
Incidence of diagnosed ADHD
(per 100,000 person-years)
Incidence
Male
Female
Overall
Male
Female
Overall
c)
1998
1999
2000
2001
2002
2003
2004
2005
2006
2007
2008
2009
2010
254/370k 338/385k 374/401k 382/415k 387/426k 483/435k 524/443k 505/449k 522/448k 585/444k 489/434k 442/427k 408/415k
23/335k 31/352k 50/369k 42/384k 46/396k 73/407k 102/417k 88/425k 91/427k 103/427k 116/418k 102/412k 78/400k
277/704k 369/737k 424/770k 424/799k 433/822k 556/842k 626/860k 593/874k 613/875k 688/871k 605/853k 544/838k 486/815k
68.7
87.7
93.2
92.0
90.8
111.1
118.4
112.6
116.6
131.7
112.6
103.6
98.4
6.9
8.8
13.6
10.9
11.6
17.9
24.5
20.7
21.3
24.1
27.7
24.8
19.5
39.3
50.1
55.1
53.1
52.7
66.1
72.8
67.8
70.1
79.0
71.0
64.9
59.7
1.6
1.4
1.2
1.0
0.8
0.6
0.4
0.2
0.0
N
Incidence
Male
Female
Overall
Male
Female
Overall
1998
5/1890k
4/2026k
9/3916k
0.3
0.2
0.2
1999
6/1958k
2/2097k
8/4054k
0.3
0.1
0.2
2000
4/2024k
3/2167k
7/4190k
0.2
0.1
0.2
2001
3/2084k
3/2228k
6/4311k
0.1
0.1
0.1
2002
2003
2004
2005
2006
2007
2008
2009
2010
13/2142k 11/2198k 14/2258k 19/2321k 16/2369k 22/2411k 37/2429k 27/2448k 23/2432k
2/2287k 11/2342k 7/2406k 11/2476k 15/2530k 9/2577k 20/2604k 19/2628k 22/2617k
15/4429k 22/4541k 21/4664k 30/4797k 31/4899k 31/4989k 57/5033k 46/5076k 45/5049k
0.6
0.5
0.6
0.8
0.7
0.9
1.5
1.1
0.9
0.1
0.5
0.3
0.4
0.6
0.3
0.8
0.7
0.8
0.3
0.5
0.5
0.6
0.6
0.6
1.1
0.9
0.9
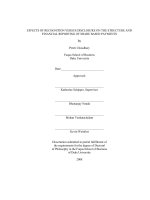
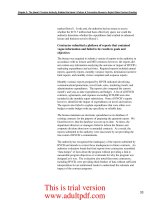
Figure 1 Incidence of ADHD (per 100,000 person-years) in the UK between 1998 and 2010 a) by age group, b) for patients aged 6–17
years by gender and c) Patients aged ≥18 years by gender.
Holden et al. Child and Adolescent Psychiatry and Mental Health 2013, 7:34
/>
Denominator
The number of person-years of people without ADHD was
calculated by adding the number of days each patient had
been present in the CPRD database for each specific year.
Patients were included in the denominator until the earliest
of their death date, transferred-out date, or ADHD presentation date. Patients who did not meet the selection criteria
for the study were included in the denominator data.
Numerator
On the date of ADHD presentation, cases were included
in the numerator portion of the incidence calculation for
that specific year.
The incidence of treated ADHD was calculated using
the same method. For calculations of incidence by gender and age group only those patients of the appropriate
age or gender were included in the numerator and denominator parts of the incidence calculation.
Page 4 of 13
the mid-year point and the last collection date for the
database becomes shorter.
Denominator
This was the total number of patients registered in
CPRD on 1st July of the specific year.
For calculations of prevalence by gender and age group
only those patients of the appropriate age and gender were
included in the numerator and denominator parts of the
prevalence calculation.
Estimation of the cost of healthcare in CPRD
Resource use and costs were applied to the following
areas of patient care: prescriptions, primary-care contacts, investigations, hospital admissions, and outpatient
appointments. The aim was to calculate the overall cost
of treating an individual with ADHD not just the cost of
treating the ADHD itself. Annual costs for the first five
years following the index date were estimated.
Diagnostic prevalence of ADHD
The point prevalence of diagnosed ADHD was calculated
each year by dividing the number of patients with ADHD
on 1st July (mid-year point) of that year by the total number of patients registered in CPRD on that date.
Numerator
A patient was included as a prevalent case if they met the
selection criteria for the study, their ADHD presentation
date was prior to 1st July of the specific year, and the later
of their last ADHD diagnosis or last prescription for an
ADHD medication was after 1st of July of that year. However, in order to allow for an adequate washout period
(more than 12 months), prevalence was only calculated
from 1998 to 2009. A washout period was considered necessary as the chance of receiving a diagnosis for ADHD
following the mid-year point reduces as the time between
Prescription costs
Each prescription item listed in CPRD was attributed a net
ingredient cost (NIC) from the corresponding year of the
Prescription Cost Analysis (PCA) [22,23]. The NIC refers
to the cost of the drug before discounts and does not include any dispensing costs or fees [24]. All NICs were adjusted for inflation to 2011 prices [25]. Either an exact
match was made or the British National Formulary (BNF)
taxonomy was utilised to attribute an average NIC per item
for the BNF sub-paragraph, section or chapter.
Outpatient attendance costs
Outpatient events were identified from CPRD’s consultation table if they had a consultation type indicative or
suggestive of an outpatient appointment. The outpatient
department and whether the consultation was a first or
Incidence of first ADHD
prescription
(per 100,000 person-years)
90
80
70
60
50
40
30
20
10
0
N
Prevalence
0-5 years
6-17 years
≥18 years
Overall
0-5 years
6-17 years
≥18 years
Overall
1998
1999
2000
2001
2002
2003
2004
2005
2006
2007
2008
2009
2010
26/293k 15/296k 12/297k 12/297k 18/294k 16/290k 25/289k 18/292k 15/294k 18/299k 14/303k 15/306k
7/303k
207/704k 274/737k 356/770k 366/799k 412/822k 509/842k 608/860k 562/874k 654/875k 670/871k 626/853k 563/839k 558/815k
3/3916k 7/4054k 7/4190k 3/4311k 13/4429k 17/4541k 22/4664k 24/4797k 30/4899k 36/4989k 56/5033k 43/5076k 55/5049k
236/4913k 296/5087k 375/5257k 381/5407k 443/5546k 542/5673k 655/5813k 604/5964k 699/6068k 724/6159k 696/6189k 621/6220k 620/6167k
8.9
5.1
4.0
4.0
6.1
5.5
8.6
6.2
5.1
6.0
4.6
4.9
2.3
29.4
37.2
46.2
45.8
50.1
60.5
70.7
64.3
74.7
76.9
73.4
67.1
68.5
0.1
0.2
0.2
0.1
0.3
0.4
0.5
0.5
0.6
0.7
1.1
0.8
1.1
4.8
5.8
7.1
7.0
8.0
9.6
11.3
10.1
11.5
11.8
11.2
10.0
10.1
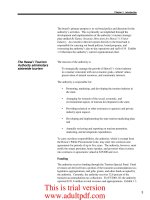
Figure 2 Incidence of first prescription for ADHD medication (per 100,00 person-years) by age group between 1998 and 2010.
Holden et al. Child and Adolescent Psychiatry and Mental Health 2013, 7:34
/>
600
Prevalence of diagnosed
ADHD (per 100,000 people)
a)
Page 5 of 13
500
400
300
200
100
0
b)
N
Prevalence
c)
1000
900
800
700
600
500
400
300
200
100
0
Prevalence of diagnosed ADHD
(per 100,000 people)
Prevalence
1998
1999
2000
2001
2002
2003
2004
2005
2006
2007
2008
2009
0-5 years 92/314k 96/317k 107/318k 100/317k 93/313k 84/311k 64/311k 64/315k 42/316k 36/321k 27/327k 21/328k
6-17 years 1355/704k 1888/737k 2534/770k 3044/799k 3504/821k 3890/841k 4337/859k 4658/875k 4759/873k 4774/868k 4554/853k 4246/839k
≥18 years 56/3916k 86/4052k 112/4192k 146/4314k 197/4423k 295/4538k 360/4659k 468/4802k 589/4889k 664/4971k 779/5035k 820/5078k
Overall
1503/4935k2070/5106k2753/5280k3290/5431k3794/5557k4269/5690k4761/5829k5190/5991k5390/6077k5474/6160k5360/6214k5087/6245k
0-5 years
29.3
30.3
33.7
31.5
29.7
27.0
20.6
20.3
13.3
11.2
8.3
6.4
6-17 years
192.4
256.3
328.9
380.7
426.9
462.6
505.2
532.4
545.2
549.8
534.1
506.4
≥18 years
1.4
2.1
2.7
3.4
4.5
6.5
7.7
9.7
12.0
13.4
15.5
16.1
Overall
30.5
40.5
52.1
60.6
68.3
75.0
81.7
86.6
88.7
88.9
86.3
81.5
Male
Female
Overall
Male
Female
Overall
Prevalence of diagnosed ADHD
(per 100,000 people)
N
1998
1999
2000
2001
2002
2003
2004
2005
2006
2007
2008
2009
1216/370k 1704/385k 2282/402k 2735/415k 3136/425k 3481/434k 3827/442k 4095/449k 4154/447k 4138/443k 3931/434k 3644/427k
139/335k 184/351k 252/369k 309/384k 368/395k 409/406k 510/416k 563/426k 605/426k 636/425k 623/418k 602/412k
1355/704k 1888/737k 2534/770k 3044/799k 3504/821k 3890/841k 4337/859k 4658/875k 4759/873k 4774/868k 4554/853k 4246/839k
329.0
442.4
568.2
658.3
737.1
801.3
865.4
912.0
929.9
934.1
904.9
854.0
41.5
52.4
68.3
80.5
93.1
100.6
122.5
132.2
141.9
149.5
149.0
146.2
192.4
256.3
328.9
380.7
426.9
462.6
505.2
532.4
545.2
549.8
534.1
506.4
30
25
20
15
10
5
0
N
Prevalence
Male
Female
Overall
Male
Female
Overall
1998
1999
2000
2001
2002
2003
2004
2005
2006
2007
2008
2009
35/1891k 57/1957k 79/2025k 108/2085k 149/2139k 224/2197k 278/2256k 365/2323k 447/2365k 510/2403k 609/2430k 635/2449k
21/2026k 29/2095k 33/2167k 38/2229k 48/2284k 71/2340k 82/2403k 103/2478k 142/2524k 154/2568k 170/2605k 185/2629k
56/3916k 86/4052k 112/4192k 146/4314k 197/4423k 295/4538k 360/4659k 468/4802k 589/4889k 664/4971k 779/5035k 820/5078k
1.9
2.9
3.9
5.2
7.0
10.2
12.3
15.7
18.9
21.2
25.1
25.9
1.0
1.4
1.5
1.7
2.1
3.0
3.4
4.2
5.6
6.0
6.5
7.0
1.4
2.1
2.7
3.4
4.5
6.5
7.7
9.7
12.0
13.4
15.5
16.1
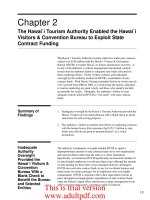
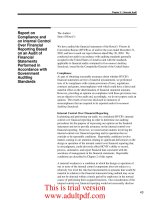
Figure 3 Prevalence of ADHD (per 100,000) in the UK between 1998 and 2009 a) by age group, b) for patients aged 6–17 years at
index date by gender and c) for patients aged ≥18 years at index date.
follow-up visit were used to allocate each appointment
to an outpatient tariff [26].
out on the same day were grouped into test panels where appropriate in order to take account of any reduction in cost of
carrying out more than one test at the same time [30].
Cost of investigations
Investigations were identified, including both pathology and
diagnostic services. Several reference sources were used to
attribute a cost to these tests [26-29]. Laboratory tests carried
Primary-care consultations
Each consultation was classified by consultation type
(e.g. surgery appointment, clinic, home visit, telephone
Holden et al. Child and Adolescent Psychiatry and Mental Health 2013, 7:34
/>
consultation) and staff type (e.g. GP, practice nurse,
mental health nurse, district nurse) and then assigned an
average cost as listed in the Unit Cost of Health and Social Care 2010 from the Personal Social Services Research Unit (PSSRU) [31]. Where average cost per hour
was the only cost published in the Unit Costs of Health
and Social Care, the UK GP workload survey [32] was
utilised in order to determine the average length of the
consultation. From this figure, the average cost per consultation could be calculated.
Hospital admissions
CPRD-linked HES records allowed us to cost inpatient
admissions. From the care pathway outlined in the NICE
guidelines for ADHD, we would not expect patients to
be routinely admitted to hospital as a direct result of
their ADHD [16]. However, children and adolescents
with ADHD may be more prone to other problems requiring admission such as accidents or self-harm [16].
Data from inpatient admissions recorded in HES were
processed into Healthcare Resource Groups (HRGs) using
HRG-4 grouper [33]. The HRGs were then matched to
NHS Reference Costs 2009–2010 [34]. It was not possible
to differentiate between elective or emergency day-case
admissions from the data available, and so costs were
averaged by ratio of each admission type. Data on procedures were not available and so all costs were inflated by
17.5%: the average difference between procedural and
non-procedural admissions.
Results
3,229 cases with ADHD and 7,429 matched control patients were identified in CPRD (Table 1). The mean age at
diagnosis was 10.4 (sd 5.9) years for cases and 10.4 (6.1)
Page 6 of 13
years for controls, and 85% of cases and 86% of controls
were male. Baseline characteristics are detailed in Table 1.
Incidence and prevalence of diagnosed ADHD
In 1998, the annual incidence of diagnosed ADHD across
all ages was 6.9 cases per 100,000 population (per100k;
Figure 1a). This peaked in 2007, with 12.2 cases per100k
(an increase of 78%). Overall, the incidence of diagnosed
ADHD had fallen by 2010 to 8.8 per100k (an increase of
28% relative to 1998). The incidence of diagnosed ADHD
in children and adolescents aged 6 to 17 years increased
from 39.3 per100k in 1998 to 79.0 per100k (101% increase
using 1998 as a reference) in 2007 before decreasing to
59.7 per100k (52% increase from 1998) in 2010 (Figure 1b).
In 1998, the incidence of ADHD was 10 times higher in
males than in females for patients aged 6 to 17 years but
only five times higher in 2010. The incidence rate in adults
was much lower than for patients aged 6 to 17 years and
increased from 0.2 per100k in 1998 to 1.1 per100k (393%
increase from 1998) in 2008 before falling to 0.9 per100k
(288%) in 2010 (Figure 1c). For adults, the incidence rate
in males was 1.3 times higher than in females in 1998 but
only 1.1 times higher in 2009. The incidence of treated
ADHD was 4.8 per100k in 1998 and reached a peak of
11.8 per100k (145%) in 2007 (Figure 2) before decreasing
to 10.1 per100k (109%) in 2010.
The overall prevalence (and percentage change using
1998 as the reference) of diagnosed ADHD increased
from 30.5 per100k in 1998 to 88.9 per100k (192%) in
2007 (Figure 3a). The prevalence then fell to 81.5
per100k (167%) in 2009 (Figure 3a). The diagnosed prevalence of ADHD was much higher in children aged 6
to 17 years than in adults. However, the prevalence increased in both groups between 1998 and 2007. In 1998,
100%
Cumulative percentage
90%
80%
70%
60%
50%
40%
30%
20%
10%
0%
-
1,000
2,000
3,000
4,000
5,000
6,000
7,000
Total Healthcare Cost (£)
Case
Control
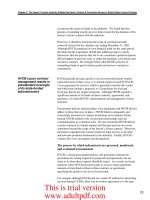
Figure 4 Distribution of healthcare costs in the first year following index date.
8,000
9,000 10,000
Holden et al. Child and Adolescent Psychiatry and Mental Health 2013, 7:34
/>
Page 7 of 13
Table 2 Total NHS healthcare costs for cases and controls in the first year following index date
Age group
Resource Type
Group
All ages
Investigations
Case
Control
Aged 6 to 17 years
at index date
Aged ≥18 years
at index date
Mean
Standard
Deviation
Median
Percentile 25
Percentile 75
£11
£38
£0
£0
£0
£8
£35
£0
£0
£0
£210
£187
£166
£81
£279
Control
£75
£100
£31
£0
£93
Case
£308
£384
£185
£53
£422
Primary-Care
Appointments
Case
Prescriptions
Control
£37
£312
£2
£0
£15
Outpatient
Attendances
Case
£580
£882
£0
£0
£906
Control
£64
£255
£0
£0
£0
Hospital
Admissions
Case
£218
£1,770
£0
£0
£0
Total
Case
Investigations
Control
£144
£2,068
£0
£0
£0
£1,327
£2,114
£890
£427
£1,742
Control
£328
£2,248
£69
£0
£214
Case
£10
£34
£0
£0
£0
Control
£8
£34
£0
£0
£0
£199
£171
£155
£73
£279
Primary-Care
Appointments
Case
Control
£70
£92
£31
£0
£93
Prescriptions
Case
£306
£363
£192
£57
£423
Control
£37
£326
£2
£0
£14
Outpatient
Attendances
Case
£572
£865
£0
£0
£899
Control
£62
£253
£0
£0
£0
Hospital
Admissions
Case
£203
£1,838
£0
£0
£0
Total
Case
Investigations
Control
£139
£2,171
£0
£0
£0
£1,290
£2,119
£879
£425
£1,689
Control
£315
£2,354
£64
£0
£198
Case
£42
£93
£2
£0
£38
Control
£24
£67
£0
£0
£17
Primary-Care
Appointments
Case
£375
£326
£298
£186
£478
Control
£137
£188
£75
£31
£186
Prescriptions
Case
£488
£580
£304
£113
£603
Control
£65
£242
£6
£0
£36
Outpatient
Attendances
Case
£614
£1,065
£87
£0
£753
Control
£83
£316
£0
£0
£0
Hospital
Admissions
Case
£324
£1,002
£0
£0
£0
Total
Case
Control
Control
£241
£1,065
£0
£0
£0
£1,844
£2,118
£1,185
£648
£2,365
£550
£1,460
£130
£31
£427
the diagnosed prevalence of ADHD was 192.4 per100k
patients aged 6 to 17 years and 1.4 per100k in adults. By
2007, the prevalence was 549.8 per100k (186% change
from 1998) in patients aged 6 to 17 years and 13.4
per100k (834%) in adults. By 2009, the prevalence of
diagnosed ADHD in patients aged 6 to 17 years had
fallen to 506.4 per100k (163%) but continued to increase
to 16.1 per100k (1,029%) in adults (Figure 3a). The
prevalence of diagnosed ADHD was 7.9 and 1.8 times
higher in males than in females for patients aged 6 to 17
(Figure 3b) and adults (Figure 3c), respectively, in 1998
and 5.8 and 3.7 times higher in 2010.
Resource use and costs
All healthcare costs were positively skewed, particularly in
the control group (Figure 4). Total annual cost ranged
Holden et al. Child and Adolescent Psychiatry and Mental Health 2013, 7:34
/>
from £0 per year to £132,765 for the control group and
£0 to £91,891 for cases. 26% of controls and 1% of cases
incurred no healthcare costs at all in the first year, where
the mean cost was four times higher for cases (£1,327
[sd £2,114] vs. £328 [sd £2,248], p < 0.001; Table 2). The
median cost (inter-quartile range) was lower than the
mean cost in both groups at £890 (£427–£1,742) vs. £69
(£0–£214) for cases and controls, respectively. Outpatient
attendances accounted for 44% of costs for cases vs. 20%
for controls (Figure 5). Specific costs were as follows: investigations (£11 vs. £8), primary-care appointments (£210
vs. £75), prescriptions (£308 vs. £37), outpatient attendances (£580 vs. £64), and hospital admissions (£218 vs.
£144). Resource use is listed in Table 3.
The mean (sd) healthcare costs for cases and controls
over the five-year period were £1,196 and £337 for year 2,
£1,148 and £316 for year 3, £1,126 and £325 for year 4,
and £1,112 and £361 for year 5, respectively (Table 4).
Discussion
In this retrospective study, the prevalence of diagnosed
ADHD was notably lower than previously reported. We
estimated that in 2009 the incidence of ADHD was 9.9
per100k population and the prevalence 81.5 cases
per100k. Compared to a matched control group, those
with ADHD had substantially increased resource use
and related financial costs (four-fold).
A systematic review and meta-analysis characterising
the worldwide prevalence of ADHD reported that the
pooled prevalence was 5.3%, with significant variability
[35]. In the UK in 1999 in children aged 5–15 years, the
Cases (£1,290)
Page 8 of 13
actual prevalence of ADHD—when estimated using the
Development and Well-Being Assessment (DAWBA)—
was 3.6% in boys and 0.9% in girls [1]. The difference between these two figures may be related to the sensitivity
of the DAWBA compared with other diagnostic instruments. At 0.44% in boys and 0.05% in girls the estimates
of prevalence of diagnosed ADHD in 1999 in children
(6–17 years) in our study was much lower than either of
these. The most likely explanation for this is that the
epidemiological studies screened the population and
aimed to identify both diagnosed and undiagnosed cases.
In the UK only a minority of patients with ADHD currently seek or receive medical treatment for their condition [36,37]. The reason for the under-diagnosis of
ADHD in the UK [38] is likely to be multifactorial. For
example, parents of children with ADHD are likely to
identify a problem and consult education professionals,
but the presentation to primary care is limited and less
than one in three children with ADHD access specialist
services [37]. In addition, there is limited recognition of
children at risk of ADHD in primary care [36] and uncertainty among many GPs over whether ADHD should
be classed as medical disorder [39]. Even in the USA,
where ADHD has been recognised longer, it was estimated that, between 2001 and 2004, less than half of the
children meeting DSM-IV criteria received treatment
[40]. In contrast to this, the percentage of children in
the USA aged 4–17 years with a parent-reported ADHD
diagnosis increased from 7.8% to 9.5% between 2003 and
2007 [41]. As the prevalence and incidence figures for
this study relate to diagnosed ADHD, it is possible that
Controls (£315)
Figure 5 Breakdown of average annual costs (all ages) in the first year following index date.
Holden et al. Child and Adolescent Psychiatry and Mental Health 2013, 7:34
/>
Page 9 of 13
Table 3 NHS Healthcare resource use for cases and controls in the first year following index date
Age group
Resource type
Group
All ages
Investigations
Case
Aged 6 to 17 years
at index date
Aged ≥18 years at
index date
Mean
Standard
deviation
Median
Percentile 25
Percentile 75
1.3
4.4
0.0
0.0
0.0
Control
0.8
3.9
0.0
0.0
0.0
Primary-Care
Appointments
Case
6.8
5.9
5.0
3.0
9.0
Control
2.4
3.1
1.0
0.0
3.0
Prescriptions
Case
11.0
11.7
9.0
4.0
14.0
Control
2.9
7.1
1.0
0.0
3.0
Outpatient
Attendances
Case
2.6
4.1
0.0
0.0
4.0
Control
0.4
1.3
0.0
0.0
0.0
Hospital
Admissions
Case
0.1
1.1
0.0
0.0
0.0
Control
0.1
0.7
0.0
0.0
0.0
Investigations
Case
1.1
4.1
0.0
0.0
0.0
Control
0.7
3.7
0.0
0.0
0.0
Primary-Care
Appointments
Case
6.4
5.4
5.0
2.0
9.0
Control
2.2
2.8
1.0
0.0
3.0
Prescriptions
Case
10.5
9.6
9.0
4.0
14.0
Control
2.7
6.8
1.0
0.0
3.0
Outpatient
Attendances
Case
2.5
4.0
0.0
0.0
4.0
Control
0.3
1.3
0.0
0.0
0.0
Hospital
Admissions
Case
0.1
1.2
0.0
0.0
0.0
Control
0.1
0.7
0.0
0.0
0.0
Investigations
Case
5.4
8.9
1.0
0.0
9.0
Control
3.6
8.2
0.0
0.0
2.0
Primary-Care
Appointments
Case
12.4
10.5
10.0
6.0
16.0
Control
4.3
5.8
2.0
1.0
6.0
Prescriptions
Case
21.1
28.1
11.0
5.0
24.0
Control
5.1
12.2
1.0
0.0
4.0
Outpatient
Attendances
Case
2.8
4.8
1.0
0.0
4.0
Control
0.4
1.5
0.0
0.0
0.0
Hospital
Admissions
Case
0.2
0.7
0.0
0.0
0.0
Control
0.1
0.5
0.0
0.0
0.0
any change in incidence or prevalence rates during the
study period is an ascertainment effect.
The figures reported here are similar to those reported
in a government-sponsored audit of ADHD services in
Scotland [42]. In 2012, the overall prevalence had increased slightly to 0.7% with a similar variation across regions of Scotland and no change in the male-to-female
ratio [42]. A UK study using the General Practice Research
Database (GPRD; forerunner of CPRD) estimated that the
prevalence of treated ADHD for patients aged 15–21 years
was 0.88 per 1,000 in 1999, increasing to 5.09 per 1,000 in
2006 [43]. A slightly higher prevalence, though in a different age range, was reported by another study: 2.6 and 5.5
per 1,000 for 1999 and 2006, respectively, in patients aged
6–17 years [43].
We found that diagnosed cases of ADHD were more
common in males than in females. Epidemiological studies have also reported a greater prevalence in males, with
a male-to- female ratio of 2–3:1 [35]. In adults, however,
the male-to-female ratio for ADHD has been reported to
be approximately equal [44]. The higher ratios reported
here and in other studies of diagnostic prevalence or
treatment suggest that, in the UK, girls with ADHD are
even less likely to be recognised and diagnosed than
boys. It is possible that this is at least partly due to the
fact that that females present with different symptoms
and, most importantly, that they are less likely to have
coexisting oppositional or disruptive behaviours [45].
However, a firm consensus on this matter has not been
reached [16].
Holden et al. Child and Adolescent Psychiatry and Mental Health 2013, 7:34
/>
Page 10 of 13
Table 4 Total NHS healthcare costs for cases and controls for the first five years following index date
Age group
Year
Group
Mean
Standard
deviation
Median
Percentile 25
Percentile 75
All ages
Y1
Case
£1,327
£2,114
£890
£427
£1,742
Control
Y2
Case
Control
Y3
Case
Control
Y4
Case
Control
Y5
Case
Control
Aged 6 to 17 years
at index date
Y1
Case
Control
Y2
Case
Control
Y3
Case
Control
Y4
Case
Control
Y5
Case
Control
Aged ≥18 years
at index date
Y1
Case
Control
Y2
Case
Control
Y3
Case
Control
Y4
Case
Control
Y5
Case
Control
£328
£2,248
£69
£0
£214
£1,196
£2,228
£770
£302
£1,544
£337
£2,215
£65
£0
£208
£1,148
£3,749
£735
£267
£1,459
£316
£1,459
£64
£0
£197
£1,126
£3,535
£673
£235
£1,439
£325
£1,531
£64
£0
£201
£1,112
£4,137
£632
£196
£1,420
£361
£2,103
£65
£0
£211
£1,290
£2,119
£879
£425
£1,689
£315
£2,354
£64
£0
£198
£1,162
£2,195
£753
£296
£1,506
£333
£2,332
£64
£0
£199
£1,124
£3,917
£708
£264
£1,428
£308
£1,506
£62
£0
£191
£1,116
£3,712
£664
£236
£1,412
£325
£1,575
£64
£0
£201
£1,105
£4,377
£612
£186
£1,385
£372
£2,227
£65
£0
£213
£1,844
£2,118
£1,185
£648
£2,365
£550
£1,460
£130
£31
£427
£1,450
£1,616
£1,111
£385
£1,969
£509
£1,091
£116
£23
£419
£1,455
£2,157
£886
£546
£1,597
£604
£1,388
£111
£0
£422
£1,512
£2,077
£894
£417
£1,873
£660
£2,087
£96
£0
£372
£1,401
£1,439
£1,058
£265
£2,136
£515
£952
£118
£19
£495
In our study, the diagnosed prevalence of ADHD in
children age 6 – 17 years old increased from 192.4 to
506.4 per100k between 1998 and 2007. An increasing incidence rate was also observed between 1998 (39.3
per100k) and 2007 (79.0 per100k). An increase in the
prevalence of ADHD has been reported in the USA between 1997 and 2007 [41,46]. Since 2007, the incidence
and prevalence rates have decreased, suggesting that recognition rates may have peaked for the time being. This
is broadly in line with the findings of the most recent
NHS Scotland audit [42] and coincides with the publication of the NICE guidelines, although we do not expect
this to have resulted in a decrease in the recognition of
ADHD [16].
A systematic review with meta-analysis has suggested
that the prevalence of ADHD declines with age (although
the strict application of DSM-IV criteria designed for use
in children may have led to an underestimation of prevalence in the adults) [47]. However, many people do continue to have significant ADHD-related impairments as
adults [16]. A meta-analysis reported that the rate of persistence of a full DSM-IV diagnosis of ADHD was 15% at
the age of 25 years, but when those patients fulfilling the
DSM-IV definition of ADHD in partial remission were included, the rate of persistence increased to approximately
65% [48]. It has been estimated that this level of persistence equates to an estimated prevalence of 0.6–1.2% of
adults by the age of 25 [16]. Our estimate of less than
Holden et al. Child and Adolescent Psychiatry and Mental Health 2013, 7:34
/>
0.02% prevalence in adults in 2009 (approximately 7,800
adults with ADHD in the UK [49]) is therefore much
lower than expected [47,50], suggesting that the underrecognition of ADHD in adults exceeds that for children
and adolescents. One possible explanation for this low
prevalence rate could be that clinicians in the UK have
only been diagnosing children over the last 20 years or so.
As a consequence most adults were not diagnosed as children and, as services for adults are still not generally available, they are not yet getting diagnosed in large numbers
as adults. Also, many adolescents are not transitioned to
adult services. A study using data from GPRD identified
that, for people aged 15–21 years between 1999–2006,
prevalence of prescribing of ADHD medication decreased
with increasing age but increased with increasing calendar
year [43]. During the study period, we found a large increase in the prevalence of ADHD in adults (1.4 to 16.1
per 100,000 between 1998 and 2009), suggesting that
either ADHD is now being increasingly recognised in adults
or that children with a diagnosis of ADHD have grown and
are still recognised to have the condition as adults.
The magnitude of the difference in annual mean costs
was surprising. Prescription costs in year 1 were higher
for cases compared to controls (£308 and £37, respectively), largely due to the cost of ADHD medicines. NICE
guidance indicates that drug treatment should be first
line when ADHD is severe and can be considered for
moderate ADHD and impairment in school-aged children and young adults when non-pharmacological approaches are unsuccessful [16]. In adults, drug treatment
is recommended by NICE as first line unless the patient
prefers psychological treatment. Drug treatment is not
recommended for pre-school children. Within the context
of significant under-recognition it is likely that those individuals receiving a diagnosis would be at the more severe
end of the ADHD continuum. As a consequence medication treatment would often be considered the first-line
treatment for all except the very young.
Numerous studies investigating the healthcare costs
associated with ADHD have been carried out in the
USA, but their applicability to the UK NHS is questionable due to different patterns of service provision. Using
information available for the UK, some estimates have
been made of the cost of certain aspects of healthcare
for ADHD at the population level. For health, social
care, and educational services, it has been estimated that
the NHS spends approximately £23 million on initial
specialist assessment of ADHD in England and Wales
and £14 million on follow-up care over one year [51]. In
addition, the NHS spent approximately £8.5 million,
£1.3 million, and £25.7 million on prescriptions for
atomoxetine, dexamfetamine, and methylphenidate, respectively, in 2010 [3]. It is likely that almost all of this
would have been spent in the treatment of ADHD,
Page 11 of 13
although dexamfetamine and methylphenidate also have
an unlicensed indication for narcolepsy [21]. Furthermore, the mean annual cost of health and social care
and educational resources relating to ADHD per adolescent in the UK has been estimated as £5,493 (median
£2,327), where 24% of this cost relates to health [52]. In
addition, ADHD commonly occurs with other conditions such as learning disorders, conduct and oppositional disorders, Tourette’s syndrome, bipolar disorder,
anxiety and depression [16], and these conditions are
likely to contribute to the higher healthcare costs observed for ADHD patients.
This study had inherent limitations. For cases where
there was no prescription for an ADHD medication the
requirement of two or more diagnoses was used in order
to avoid selecting patients where the GP had recorded a
provisional diagnosis of ADHD prior to referral for assessment by a specialist. However, this may have led to the exclusion of possible ADHD patients from the cost
calculation and an underestimate of the incidence and
prevalence rates. The care pathway for ADHD differs in
comparison to many chronic conditions and will vary by
site. Once the condition has been stabilised, GPs often
prescribe drugs for ADHD under shared-care protocols.
Prescriptions written in secondary care are not recorded
in CPRD and could not be costed. Any underestimation of
resource use and the related financial cost will disproportionately impact on the ADHD group and therefore the
differences reported may underestimate the true
difference. Those patients who are more difficult to stabilise may be less well recorded in CPRD as more of their
healthcare may be provided in secondary care. In addition,
our study index date may vary between patients from the
date of first presentation to the GP, the date of referral
back to the GP from secondary care, or the date of the
first GP prescription for an ADHD medication. CPRD includes GP practices from all four UK regions and is therefore generalisable to the whole of the UK. On the other
hand, the linked HES data is exclusively English, which
could suggest that the healthcare cost estimates are generalisable to England only. However, the patients registered
in the linked practices have been shown to be representative of the whole CPRD population [53].
Regarding the estimation of prevalence, a patient had
to have received a diagnosis of ADHD or a prescription
for a medication for ADHD both prior to and after 1st
July each year. Although a washout period of 12 months
was applied, the time between the mid-year point and
the last collection date for the database becomes shorter
for the more recent years and this may have contributed
to the reduction in prevalence rates since 2007. However, this method was selected since clinical records in
CPRD cannot be used to determine when a patient stops
experiencing ADHD. The calculation of incidence is
Holden et al. Child and Adolescent Psychiatry and Mental Health 2013, 7:34
/>
sensitive to the method used to calculate the denominator. Although, for this study, patients need not necessarily have had contact with their general practice to be
included in the patient-years estimate. An underestimation in the incidence and prevalence rates could also
have occurred if diagnoses were not accurately recorded
in CPRD. The validity of medical diagnoses in CPRD
have been confirmed in several studies [54,55]. GPs in
the UK act as gatekeepers, and referrals to and outpatient letters from secondary care should be recorded
in CPRD. However, ADHD diagnoses may be less well
recorded than other conditions diagnosed and treated
exclusively in primary care.
Conclusion
In summary, the prevalence of diagnosed ADHD in the
UK was notably lower than in reports that used screening. Costs in those with ADHD were more than four
times higher than in those without ADHD.
Additional file
Additional file 1: Figure S1. Study Numbers.
Abbreviations
ADHD: Attention deficit/hyperactivity disorder; CPRD: Clinical Practice
Research Datalink; DSM: Diagnostic and Statistical Manual of Mental
Disorders; GP: General Practitioner; HRG: Healthcare Resource Group;
NHS: National Health Service; NIC: Net ingredient cost; NICE: National
Institute for Health and Care Excellence; PCA: Prescription Cost Analyses;
PSSRU: Personal Social Services Research Unit.
Competing interests
CLlM and CDP have been and SEH and SJJ are employed by
Pharmatelligence, a research consultancy receiving funding from
pharmaceutical companies. SEH is employed by Alliance Boots. CDP has
consulted for the following manufacturers of diabetic pharmaceuticals:
Astellas, BMS, Ferring, Lilly, Medtronic, Novo Nordisk, Sanofi-Aventis, and
Wyeth. DC has received research grants from various health-related
organisations, including European Union FP7, the National Institute for
Health Research, Shire, and Vifor; consults for Shire; has been on advisory
boards for Flynn Pharma, Janssen, Lilly, Medice, Novartis, Shire, and Vifor; has
received royalties from Oxford University Press; and has received payment
for lectures from Flynn Pharma, Janssen, Lilly, Shire, and Vifor. CJC has
received research grants from various health-related organisations including
Abbott, Astellas, Diabetes UK, the Engineering and Physical Sciences
Research Council, the EASD, Ferring, GSK, Lilly, the Medical Research Council,
Medtronic, MSD, the National Health Service, Pfizer, Sanofi-Aventis, Shire, and
Wyeth; and consults for Amylin, Aryx, Astellas, Boehringer Ingelheim, BMS,
Diabetes UK, Eisel, Ferring, GSK, Ipsen, Lilly, Medtronic, MSD, Pfizer, SanofiAventis, Takeda, and Wyeth.
Authors’ contribution
The authors contributed the following: CJC conceived the study. CJC, CDP,
CLlM, and SEH contributed to study design. SEH and CLlM analysed the data.
SEH, CJC, DC, and CDP interpreted the data. SEH drafted the manuscript. SJJ
provided data preparation and technical support. CJC, SEH, and DC were
involved in the writing and reviewing of the report. CJC had overall
responsibility for the study and is overall guarantor. JS and PH of Shire
Development LLC provided comments on the outline and the initial draft of
the manuscript, but the final content of this manuscript, the ultimate
interpretation, and the decision to submit it for publication to the Child and
Adolescent Psychiatry and Mental Health was made by the authors
Page 12 of 13
independently. All authors, external and internal, had full access to all of the
data (including statistical reports and tables) in the study and can take
responsibility for the integrity of the data and the accuracy of the data
analysis. All authors read and approved the final manuscript.
Funding
This research was funded by Shire Development LLC.
Author details
1
Primary Care and Public Health, School of Medicine, The Pharma Research
Centre, Cardiff Medicentre, Cardiff University, Cardiff CF14 4UJ, UK. 2Global
Epidemiology, Pharmatelligence, Cardiff Medicentre, Cardiff CF14 4UJ, UK.
3
Division of Neuroscience, Medical Research Institute, University of Dundee,
Dundee DD1 9SY, UK.
Received: 26 April 2013 Accepted: 2 October 2013
Published: 11 October 2013
References
1. Ford T, Goodman R, Meltzer H: The British Child and Adolescent Mental
Health Survey 1999: the prevalence of DSM-IV disorders. J Am Acad Child
Psy 2003, 42:1203–1211.
2. Prescribing & medicines: medicines used in mental health. Financial
years 2001/02 – 2010/11. />Prescribing-and-Medicines/Publications/2011-09-27/2011-09-27PrescribingMentalHealth-Summary.pdf?96236819029.
3. Hospital prescribing, England. 2010. />4. Harpin V a: The effect of ADHD on the life of an individual, their family,
and community from preschool to adult life. Arch Dis Child 2005,
90(Suppl 1):i2–i7.
5. Bagwell CL, Molina BS, Pelham WE, Hoza B: Attention-deficit hyperactivity
disorder and problems in peer relations: predictions from childhood to
adolescence. J Am Acad Child Adolesc Psychiatry 2001, 40:1285–1292.
6. Kadesjo B, Gillberg C: The comorbidity of ADHD in the general population
of Swedish school-age children. J Child Psychol Psychiat 2001, 42:487–492.
7. Johnston C, Mash EJ: Families of children with attention-deficit/hyperactivity
disorder: review and recommendations for future research. Clin Child Fam
Psychol Rev 2001, 4:183–207.
8. Ray GT, Levine P, Croen LA, Bokhari F, Hu T-W, Habel L: Attention-deficit/
hyperactivity disorder in children: excess costs before and after initial
diagnosis and treatment cost differences by ethnicity. Arch Pediatr &
Adolesc Med 2006, 160:1063–1069.
9. Guevara J, Lozano P, Wickizer T, Mell L, Gephart H: Utilization and cost of
health care services for children with attention-deficit/hyperactivity
disorder. Pediatrics 2001, 108:71–78.
10. Leibson C, Katusic S, Barbaresi WJ, Ransom J, Brien PCO: Use and costs of
medical care for children attention-deficit/hyperactivity disorder. JAMA
2001, 285:60–66.
11. Chan E, Zhan C, Homer CJ: Health care Use and costs for children with
attention-deficit/hyperactivity disorder. Arch Pediat Adol Med 2002,
156:504–511.
12. Pelham WE, Foster EM, Robb J a: The economic impact of attention-deficit
/hyperactivity disorder in children and adolescents. Ambul Pediatr 2007,
7(1 Suppl):121–131.
13. Matza LS, Paramore C, Prasad M: A review of the economic burden of
ADHD. Cost Eff Resour Alloc 2005, 3:5.
14. Birnbaum H, Kessler R, Lowe S, Secnik K, Greenberg P, Leong S, Swensen A:
Costs of attention deficit-hyperactivity disorder (ADHD) in the US: excess
costs of persons with ADHD and their family members in 2000. Curr Med
Res Opin 2005, 21:195–206.
15. Hakkaart-van Roijen L, Zwirs BWC, Bouwmans C, Tan SS, Schulpen TWJ,
Vlasveld L, Buitelaar JK: Societal costs and quality of life of children
suffering from attention deficient hyperactivity disorder (ADHD).
Eur Child Adoles Psy 2007, 16:316–326.
16. ADHD: diagnosis and management of ADHD in children, young people
and adults. NICE Clinical Guideline 72. />pdf/adhdfullguideline.pdf.
17. Use of ADHD drugs “increases by 50% in six years”. .
uk/news/health-23674235.
Holden et al. Child and Adolescent Psychiatry and Mental Health 2013, 7:34
/>
18. ADHD services over Scotland final report. lthcareimprove
mentscotland.org/our_work/mental_health/adhd_service_improvement/
stage_3_adhd_final_report.aspx.
19. Clinical practice research datalink. />20. Committee on Safety of Medicines and Medicines Control Agency: Volital
(Pemoline) has been withdrawn. Current Problems in Pharmacovigilance
1997, 23:10.
21. British National Formulary (online). .
22. Prescriptions cost analysis – England. 2011. />prescostanalysis2011.
23. Prescribing. />24. Prescription cost analysis, England. 2010. />PUB02274/pres-cost-anal-eng-2010-apx.pdf.
25. HM Treasury: Economic data and tools. Latest figures. />26. Tariff information: confirmation of payment by results (PbR)
arrangements for 2010–2011. />27. NHS reference costs 2010–2011. />Publicationsandstatistics/Publications/PublicationsPolicyAndGuidance/
DH_131140.
28. Health Statistics Wales 2011. />publications/publication-archive/health2011/?lang=en.
29. NHS National Services Scotland. />30. NHS pathology: pathology solutions. />31. Unit costs of health and social care. 2011. />pdf/uc/uc2011/uc2011.pdf.
32. GP workload survey. />33. Downloads: costing. />34. NHS Reference Costs 2009–2010. />publications/nhs-reference-costs-2009-2010.
35. Polanczyk G, De Lima MS, Horta BL, Biederman J, Rohde LA: The worldwide
prevalence of ADHD: a systematic review and metaregression analysis.
Am J Psychiatry 2007, 164:942–948.
36. Sayal K, Taylor E, Beecham J, Byrne P: Pathways to care in children at risk
of attention-deficit hyperactivity disorder. Br J Psychiatry 2002, 181:43–48.
37. Sayal K, Goodman R, Ford T: Barriers to the identification of children with
attention deficit/hyperactivity disorder. J Child Psychol Psychiatry 2006,
47:744–750.
38. Jick H, Kaye JA, Black C: Incidence and prevalence of drug-treated
attention deficit disorder among boys in the UK. Br J Gen Pract 2004,
54:345–347.
39. Klasen H, Goodman R: Parents and GPs at cross-purposes over
hyperactivity: a qualitative study of possible barriers to treatment.
Br J Gen Pract 2000, 50:199–202.
40. Froehlich TE, Lanphear BP, Epstein JN, Barbaresi WJ, Katusic SK, Kahn RS:
Prevalence, Recognition, and Treatment of Attention-Deficit
/Hyperactivity Disorder in a National Sample of US Children. Arch Paediat
Adol Med 2007, 161:857–864.
41. Morbidity and Mortality Weekly Report (MMWR). Increasing Prevalence
of Parent-Reported Attention-Deficit/Hyperactivity Disorder Among
Children - United States, 2003 and 2007. />preview/mmwrhtml/mm5944a3.htm.
42. Attention Deficit and Hyperkinetic Disorders – Services Over Scotland
(ADHD-SOS) Follow-up Review. lthcareimprovement
scotland.org/his/idoc.ashx?docid=c3c72452-cb24-4179-bdba-13be65b74c3d
&version=−1.
43. McCarthy S, Asherson P, Coghill D, Hollis C, Murray M, Potts L, Sayal K,
De Soysa R, Taylor E, Williams T, Wong ICK: Attention-deficit hyperactivity
disorder: treatment discontinuation in adolescents and young adults.
Br J Psychiatry 2009, 194:273–277.
44. Kooij J, Buitelaar J, Van den Oord E, Furer J, Rijnders C, Hodiamont P:
Internal and external validity of Attention-Deficit Hyperactivity Disorder
in a population-based sample of adults. Psychol Med 2004, 34:1–11.
45. Berry CA, Shaywitz SE, Shaywitz BA: Girls with attention deficit disorder: a
silent minority? A report on behavioral and cognitive characteristics.
Pediatrics 1985, 76:801–809.
46. Pastor PN, Reuben C a: Diagnosed attention deficit hyperactivity disorder
and learning disability: United States, 2004–2006. Vital Health Stat 2008,
10:1–14.
Page 13 of 13
47. Simon V, Czobor P, Bálint S, Mészáros A, Bitter I: Prevalence and correlates
of adult attention-deficit hyperactivity disorder: meta-analysis.
Br J Psychiatry 2009, 194:204–211.
48. Faraone SV, Biederman J, Mick E: The age-dependent decline of attention
deficit hyperactivity disorder: a meta-analysis of follow-up studies.
Psychol Med 2006, 36:159–165.
49. Office for National Statistics: Population estimates quinary age groups for
UK constituent countries – mid 1971 to mid 2010. .
uk/ons/rel/pop-estimate/population-estimates-for-uk–england-and-wales–
scotland-and-northern-ireland/population-estimates-timeseries-1971-tocurrent-year/index.html.
50. Kessler RC, Adler L, Barkley R, Biederman J, Conners CK, Demler O, et al:
The prevalence and correlates of adult ADHD in the United States:
results from the National Comorbidity Survey Replication. Am J Psychiat
2006, 163:716–723.
51. King S, Griffin S, Hodges Z, Weatherly H, Asseburg C, Richardson G, Golder
S, Taylor E, Drummond M, Riemsma R: A systematic review and economic
model of the effectiveness and cost-effectiveness of methylphenidate,
dexamfetamine and atomoxetine for the treatment of attention deficit
hyperactivity disorder in children and adolescents. Health Technol Asses
2006, 10:1–146.
52. Telford C, Green C, Logan S, Langley K, Thapar A, Ford T: Estimating the
costs of ongoing care for adolescents with attention-deficit hyperactivity
disorder. Soc Psychiatry Psychiatr Epidemiol 2013, 48:337–344.
53. Gallagher A, Puri S, Van Staa T: Linkage of the General Practice Research
Database (GPRD) with other data sources. Pharmacoepidemiol Drug Saf
2011, 20:S1–S364.
54. Khan NF, Harrison SE, Rose PW: Validity of diagnostic coding within the
General Practice Research Database : a systematic review. Brit J Gen Pract
2010, 60:e128–e136.
55. Herrett E, Thomas SL, Schoonen WM, Smeeth L, Hall AJ: Validation and
validity of diagnoses in the General Practice Research Database: a
systematic review. Brit J Clin Pharmaco 2010, 69:4–14.
doi:10.1186/1753-2000-7-34
Cite this article as: Holden et al.: The prevalence and incidence,
resource use and financial costs of treating people with attention
deficit/hyperactivity disorder (ADHD) in the United Kingdom (1998 to
2010). Child and Adolescent Psychiatry and Mental Health 2013 7:34.
Submit your next manuscript to BioMed Central
and take full advantage of:
• Convenient online submission
• Thorough peer review
• No space constraints or color figure charges
• Immediate publication on acceptance
• Inclusion in PubMed, CAS, Scopus and Google Scholar
• Research which is freely available for redistribution
Submit your manuscript at
www.biomedcentral.com/submit