A comparative study on nutritional profile and antinutrients of buckwheat fractions (Fagopyrum esculentum)
Bạn đang xem bản rút gọn của tài liệu. Xem và tải ngay bản đầy đủ của tài liệu tại đây (282.95 KB, 10 trang )
Int.J.Curr.Microbiol.App.Sci (2019) 8(3): 561-570
International Journal of Current Microbiology and Applied Sciences
ISSN: 2319-7706 Volume 8 Number 03 (2019)
Journal homepage:
Original Research Article
/>
A Comparative Study on Nutritional Profile and Antinutrients of
Buckwheat Fractions (Fagopyrum esculentum)
Mani Mishra* and Shashi Jain
Maharana Pratap University of Agriculture and Technology Udaipur, Rajasthan, India
*Corresponding author
ABSTRACT
Keywords
Antinutrients,
Phytic acid,
Proximate
composition
Article Info
Accepted:
07 February 2019
Available Online:
10 March 2019
Buckwheat (Fagopyrum esculentum) is an annual crop, it is a pseudo cereal but its grains
belong to cereals because of their similar use and chemical composition. Buckwheat grains
and other tissues contain numerous neutraceutical compounds. A Comparative study on
Nutritional profile and Antinutrients of buckwheat fractions was conducted at Department
of Food & Nutrition, College of Home Science, Maharana Pratap University of
Agriculture & Technology Udaipur, Rajasthan, India. The chemical analysis of buckwheat
fractions buckwheat whole (BW), buckwheat groats (BG) and buckwheat husk (BH )for
proximate composition revealed significant difference for moisture, fat, ash, protein, fibre
and energy. Protein was significantly higher in BG (14.88g/100g) than BW (11.34g/100g)
and BH (9.91g/100g). It was observed that all three fractions of buckwheat exhibited
almost similar values of carbohydrate content which ranged from 66.35g/100g in BW to
71.25g/100g in BH. The significant difference was found between fractions for calcium,
Iron, and Zinc. In case of calcium, BH recorded higher value 149.66 ppm than BW and
BG (76.80 ppm and 38.13 ppm). The anti-nutritional factors viz., tannin and phytic acid
were analyzed in all flour fractions. Tannin content was found to be highest in BH (5.54%)
than BW (4.15%) and BG (4.15%). The phytic acid content was found lowest in BG
(6.23%) than BW (18.36%) and BH (18.30%) and the difference was significant (p >0.05).
composition and structure. The first layer of
the groat is aonecell thick testa layer (seed
coat), which is light green in colour. Under
the testa is a one-cell aleurone layer, which
surrounds the starchy endosperm. The inner
portion of groat consists of a spermaderm and
an endosperm. Later, it was suggested by
Krtov (1963) that buckwheat originated in
temperate central Asia from where it has
migrated to other countries of the region. The
perennial wild species Fagopyrum cymosum,
native to China and India was considered to
Introduction
Buckwheat is produced in many parts of the
world and has long been an important part of
the human diet. Buckwheat has a triangular
seed, which is covered by a hull (pericarp).
The exact shape, size, and colour of the seed
may vary depending on the species and
variety. The hull may be a glossy or dull
brown, black or grey. The dehulled
buckwheat seed, called the groat, resembles
the cereal kernel in its gross chemical
561
Int.J.Curr.Microbiol.App.Sci (2019) 8(3): 561-570
be the progenitor of the two commonly
cultivated species, Fagopyrum esculentum
(Common buckwheat) and F. tataricum
(Tatary buckwheat). Hindi name for
buckwheat (Fagopyrum esculentum) is
“Kutu” and it’s an ancient crop of India
cultivated extensively in the Himalayan
region extending from Jammu and Kashmir in
the north-west to Arunachal Pradesh in the
north eastern region. Buckwheat has gained
an excellent reputation for its nutritious
qualities in the human diet.Its renewed
popularity stems from its many bioactive
components, which have been shown top
rovide various health benefits much sought
after in natural foods. Buckwheat flour
contains various kinds of vitamins, such as
B1, B2, and niacin, at relatively high levels
(Pomeranz, 1983). Buckwheat protein
consists of 18.2% albumin, 43.3% globulin,
0.8% prolamin, 22.7% glutelin, and 5.0%
other nitrogen residue (Javornikand Kreft,
1984).
components like flavonoids makes it a boon
for health.
Materials and Methods
The present study was conducted at
Department of Food & Nutrition, College of
Home science, Maharana Pratap University of
Agriculture
&
Technology
Udaipur,
(Rajasthan).Buckwheat sample as whole
(BW) and Buckwheat groats (BG) purchased
from local market of Udaipur (Rajasthan) in a
single lot to avoid varietal difference. The
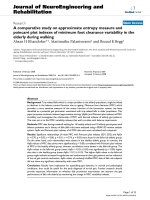
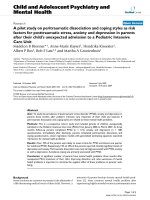
samples are shown in plate 1.Sample was
stored in airtight container Buckwheat whole
(BW) cleaned separately by sieving for
removal of dirt, stones and stored in airtight
container. ZanduParad Tablets (covering with
a piece of cotton cloth) added (2 tablets for 1
kg seed). Every 2-3 months interval samples
were spread in sunlight and again stored.
Nutritional components: Buckwheat whole
(BW), Buckwheat groats (BG) and buckwheat
husk (BH) were analyzed for nutritional
content along with buckwheat whole and
buckwheat groats. Buckwheat husk was also
analyzed as most trace elements are
concentrated in bran (Bonafaccia et al., 2003).
Buckwheat husk (BH) was obtained by
grinding buckwheat whole in a grinder for 2-3
minutes and husk removed manually by hand.
About 50-60 percent part of buckwheat was
separated as buckwheat husk (BH).
Buckwheat
contains
many
flavonoid
compounds, known for their effectiveness in
reducing the blood cholesterol, keeping
capillaries and arteries strong and flexible,
and assisting in prevention of high blood
pressure (Santos et al, 1999). Buckwheat
proteins, like dietary fibre, can suppress the
development of colon cancer (Lipkin et al.,
1999). The content of TDF in groats may
range from 5 to 11%. Bran fractions obtained
by milling of buckwheat are especially
enriched in dietary fibre (13-16%), but
buckwheat flours contain considerably lower
amounts of fibre (1.7-8.5%) (Steadman et al.,
2001).
Nutritional evaluation of the buckwheat
whole (BW) was done for their proximate
composition and mineral estimation (calcium,
iron, zinc, copper). Anti-nutritional factors
(tannins and phytates) were also analyzed.
Standard procedures were used for the
estimations. Percentage carbohydrate and
energy contents were determined by
calculation
using
difference
method
respectively. The procedures have been
described here under:
Buckwheat flour can be avaluable ingredient
in diets or food products for celiac patients. It
is observed that Buckwheat is a nutritious
food having therapeutic role in diseases like
Diabetes, hypertension, cancer, constipation
and celiac disease. It is a good source of
protein, vitamins, and minerals bioactive
562
Int.J.Curr.Microbiol.App.Sci (2019) 8(3): 561-570
It is the major component of food. The
moisture content of any food is determined
not only to analyze the chemical composition
of food material on moisture free basis but
also to assess the shelf life of the products.
Moisture content of samples was analyzed by
the method described by NIN (1983).Ten
gram sample was weighed in a dried and
weighed petri dish. The weight of the sample
along with the petri dish was taken at regular
intervals until a constant weight was obtained.
The moisture percentage was calculated using
following formula:
Kjel plus nitrogen estimation system was used
to estimate the amount of nitrogen in the
samples. 0.2 g moisture free sample was
transferred to the digestion tube. Ten ml of
concentrated sulphuric acid and 3 g catalyst
mixture (5 parts of K2SO4 + 1 part of
CuSO4) was added and was left overnight.
The tubes were then placed in a pre-heated
digestion block. The digestion block was pre
heated to 60°C for 10 minutes. Once the
digestion tubes were placed, temperature was
further increased to 100°C and samples were
kept until the colour of the samples turned
bluish green or colorless. Digested samples
were taken for distillation where the
ammonium radicals were converted to
ammonia
under
excess
alkali
post
neutralization of acid in the digested samples
with 40 per cent sodium hydroxide. Mixed
indicator (methyl red + methyl blue) was
added to the solution and titrated with the
standardized N/10 HCl. The titration value
was determined and the following formula
was used to estimate the amount of nitrogen
liberated:
Initial weight (g) - Final weight (g)
Moisture (g/100g) =
X100
Weight of the sample (g)
14.01xNormality of HCL (0.1) x (TV-BV
Nitrogen (g/100g) =
X100
SW (gm)
Crude protein
Crude fat
The protein nitrogen is converted into
ammonium sulphate by boiling with
concentrated sulphuric acid. It is subsequently
decomposed by the addition of excess alkali
and the liberated ammonia is absorbed into
boric acid solution containing an indicator by
steam distillation. Ammonia forms a loose
compound, ammonium borate with boric acid,
which is titrated directly against standard
HCl. The protein content of food stuff is
obtained by estimating the nitrogen content of
the material and multiplying the nitrogen
content by the factor 6.25 (NIN, 1983).
Fat was estimated as crude ether extract of
moisture free sample by the method given by
Jain and Mogra (2006). Fat content of the
sample was estimated on Soxhlet Plus system,
which works on the principle of improved
soxhlet method. Weighed amount of moisture
free sample (5 g) was placed in a thimble. The
thimble was inserted in the thimble holder to
be kept in an already weighed beaker and 80
ml petroleum ether (60-80˚C) was poured in
the beaker. The beakers were loaded in the
system and temperature was set at100˚C. The
process was left to operate for 120 minutes
and the temperature was increased to the
Proximate composition
It is the determination of a group of closely
related compounds together. It includes
determination of amount of moisture, protein,
fat (ether extract), ash and fiber with nitrogen
free extract and carbohydrates being
estimated by subtracting the sum of these five
percentages from 100.
Moisture
563
Int.J.Curr.Microbiol.App.Sci (2019) 8(3): 561-570
recovery temperature, which was twice the
initial boiling temperature. Rinsing was thus
done twice in order to collect the remaining
fat in the sample. Beakers were taken out and
put Nitrogen (g/100g) = 14.01 x Normality of
HCL (0.1) x (TV-BV)SW (gm)x 100in a hot
air oven. Thimble holders were removed from
the beakers and the beakers were weighed.
The amount of fat present in the sample was
calculated using the following formula:
hot distilled water. This was filtered through
muslin cloth and the residue was washed with
hot distilled water till free from acid. The
residue was then transferred to same beaker
and boiled for 30 minute with 200 ml of 1.25
per cent sodium hydroxide solution. After
boiling, mixture was filtered through muslin
cloth and the residue was washed again with
hot distilled water till free from alkali
followed by washing with 50 ml alcohol and
ether. Then it was taken into a crucible (it was
weighed before as W1) and residue was dried
in an oven at 1300C for 2-3 hours, cooled and
weighed (W2). Heat in muffle furnace at
6000C for 2-3 hours, then cool and weigh
again (W3).
Weight of ether extract fat (B-A)
Fat (g/100g) = X100
Weight of sample (gm)
Ash
Ash was estimated by the method given by
Jain and Mogra (2006). Five grams of
moisture free sample was weighed in
previously heated, cooled and weighed
crucible. Sample was then completely charred
on the hot plate, followed by heating in
muffle furnace at 6000C for 5 hours. The
crucible was cooled in desiccators and
weighed. The process was repeated till
constant weights were obtained and the ash
was almost white or grayish in color. Ash
content of samples was calculated using
following formula:
Carbohydrate
The carbohydrate content of the sample on
dry weight basis was calculated by difference
method (Jain and Mogra 2006) as given
below:
Carbohydrate (g/100g) = 100 – (moisture +
crude fibre + ash + protein + fat)
Energy
The energy value of sample was calculated
using physiological fuel value i.e. 4, 9, 4 kcal
per gram of protein, fat and carbohydrate
respectively.
Weight of ash (g)
Ash (g/100g)=
X100
Weight of sample taken (g)
Energy (kcal/100g) = [(% protein x 4) + (%
carbohydrate x 4) + (% fat x9)]
Crude fibre
Fibre is an insoluble vegetable matter
indigestible by proteolytic and diastatic
enzymes and cannot be utilized except by
microbial fermentation. It is usually
composed of cellulose, hemicelluloses and
lignin. Crude fiber estimation was done as per
the method given by 3 gram of moisture and
fat free sample was placed in 500 ml beaker
and boiled with 200 ml of 1.25 per cent
sulphuric acid for thirty minutes. The volume
was kept constant during boiling by adding
Mineral profile
Mineral solutions of selected samples were
prepared by wet ashing method compiled by
Jain and Mogra (2006). The plant material
was digested with a mixture of acids to form a
clear white precipitate which was then
dissolved in water and made up to a definite
volume. An aliquot from this was used for
determination of selected minerals.
564
Int.J.Curr.Microbiol.App.Sci (2019) 8(3): 561-570
was raised to 1L and then filtered. Indigo
carmine was kept in brown bottle till the
experiment completed. The blank test was
carried out by titration of a mixture of 25ml
Indigo carmine solution and 750ml of (dd
H2O). All were analyzed in duplicates.
Wet ashing
One gram moisture free sample was taken in a
digestion tube and 5 ml of concentrated
HNO3 was added to it and was left overnight.
It was then heated slowly for 30 minutes and
cooled. Five ml of perchloric acid (70%) was
added and heated over digestion block until
the particles were completely digested and the
solution became clear. After digestion,
volume of digested matter was made up to 50
ml with double distilled water. Prepared
mineral solution was stored in makeup bottles
and mineral analysis was done by atomic
absorption spectrophotometer (AAS4141)
Phytate
Phytic acid content of the samples was
estimated using the method compiled by Jain
and Mogra (2006). One gram of moisture free
finely ground sample was taken in a conical
flask and added 50 ml HCl. The mixture was
shaken in a shaker for 3 hours and filtered.
The clear filtrate thus obtained was reduced to
25 ml over water bath. The filtrate was
neutralized adding required amount of sodium
hydroxide. Ten ml of 0.01 per cent ferric
chloride was then added and the mixture
heated over water bath for 15 minutes, cooled
to room temperature and filtered again using a
pre-weighed filter paper. The residue was
washed with ethanol and then ether.
Anti- nutritional factors
The nutritional quality and digestibility of
plant nutrients is affected by the presence of
anti nutritional factors. The presence of these
anti-nutrients was analyzed in selected maize
varieties.
Total tannin estimation
Results and Discussion
Total tannin content of the samples was
estimated using the method of Atanassova
and Christova (2009).Sample preparationThree g of the sample was mixed with 250 ml
distilled deionized water (dd H2O) and kept
for 4 hours at room temperature and filtered
in volumetric flask with filter paper. Tannin
Essay-Twenty five ml infusion was measured
into 1 litre conical flask then 25ml of indigo
solution and 750 ml distilled deionized water
was added 0.1 N aqueous solution of
potassium permanganate was used for
titration till the blue color of solution changes
to green color. Further few more drops were
added until solution becomes golden yellow.
Standard solution of indigo carmine was
prepared as follows- six gm indigo carmine
was dissolved in500 ml of distilled deionized
water by heating, after cooling 50 ml of 9597% sulphuric acid was added, the volume
Chemical properties of buckwheat whole
(BW), buckwheat groats (BG) and buckwheat
husk (BH) were analyzed and the results
obtained on dry matter basis have been
presented in following sections (Table 1-3).
Proximate analysis
Moisture, crude fat, ash, crude protein, crude
fibre, carbohydrates and energy contents of
BW, BG, and BH were estimated and results
are depicted in Table 1.
The chemical analysis of buckwheat fractions
for
proximate
composition
revealed
significant difference for moisture, fat, ash,
protein, fibre and energy. Moisture content
was significantly ((p≤0.05) higher in BW
(8.56g/100g) followed by BG (7.19g/100g)
565
Int.J.Curr.Microbiol.App.Sci (2019) 8(3): 561-570
and BH (5.16g/100g). Highest amount of
crude fat content was exhibited in BG
(2.68g/100g) followed by BW (2.02g/100g)
and BH (0.76g/100g). Ikeda and Yamashita
(1994) reported that seeds of common
buckwheat contain 1.5-3.7% total lipids. The
highest concentration is in embryo and the
lowest in the hull at 0.4-0.9%. Groats or
dehulled seeds of buckwheat contain 2.12.6% total lipids. Total ash was significantly
higher in BW (2.34g/100g) than BG
(2.04g/100g)
and
BH
(2.15g/100g).
Bonafaccia et al., (2003) studied the
composition and technological properties of
the flour and bran from common and tartary
buckwheat. The content of ash was found
between the range of 1.82-4.08% among
grain, brain and flour. Protein, the body
building nutrient, was significantly higher in
BG (14.88g/100g) than BW (11.34g/100g)
and BH (9.91g/100g). Fornal (1999) reported
that buckwheat flour contains from 8.5% to
near 19% of proteins depending on the
variety, pesticides used and fertilization that
are likely to affect the total concentration of
buckwheat proteins.
In the whole grain of buckwheat, starch
content varies from 59% to 70% of the dry
mass, demonstrating fluctuations under
variable climate and cultivation conditions.
However the difference was found to be
statistically non-significant. The energy
values can also be seen to be varying possibly
due to protein and carbohydrate content
among BW, BG and BH. The values ranged
from 329 kcal in BW to 362 kcal in BG.
Kim et al., 2004) reported that buckwheat
grains contain a variety of nutrients, the main
compounds being protein, dietary fibre, lipids
and carbohydrate. The total content of
components depends on the variety or
environmental factors (Barta et al., 2004). It
can be concluded that BG is rich in protein,
fat and content as compared to BW and BH.
Pomeranz and Robbins (1972) also suggested
that BG is a good protein supplement.
Mineral profile
The major mineral contents for BW, BG and
BH are presented in Table 2. The significant
difference was found between flours for
calcium, Iron, and Zinc. In case of calcium,
BH recorded higher value 149.66 ppm than
BW and BG (76.80 ppm and 38.13 ppm).
Buckwheat is rich in potassium (k),
magnesium (Mg) calcium (ca) and Sodium
(Na) (Wei et al., 1995) and most of minerals
are concentrated mainly in bran (Bonafacia et
al., 2003).
BW and BH showed significantly higher
content of crude fibre (9.35g/100g and
10.74g/100g) respectively than in BG
(3.46g/100g). It was found that crude fibre
was highest in bran (10.74 g/100g) and was
lowest in BG (3.46 g/100g) as buckwheat
groats was dehusked form of grain which
affects the fibre content. Bonafaccia and Kreft
(1994) found from 3.4% to 5.2% of total
dietary fibre in buckwheat samples and
products. Buckwheat may have, because of its
fibre content may have an important role in
prevention
and
treatment
of
hypercholestremia (He et al., 1995). It was
observed that all three fractions of buckwheat
exhibited
almost
similar
values
of
carbohydrate content which ranged from
66.35 g/100g in BW to 71.25 g/100g in BH.
Iron content was significantly higher in BW
(106.83 ppm) followed by BG (80.61 ppm)
and BH (47.10 ppm). Among three flours zinc
content was found significantly higher in BG
(23.83 ppm) than BW (20.50 ppm) and BH
(14.83 ppm). Bonafacia et al., (2003) studied
the content of Se, Zn, Fe, Co, Ni were
analyzed in the flour and bran of common and
tartary buckwheat. There is relatively small
difference in the content of Iron, and
566
Int.J.Curr.Microbiol.App.Sci (2019) 8(3): 561-570
chromium between flour and bran fractions.
Though there was no significant difference
observed for copper among BW, BG, and BH
but the copper content of BW (14.1567 ppm)
was found slightly higher than BG (10.9367
ppm) and BH (11.8333). Ikeda (1994)
analyzed the content of zinc, copper and
manganese in various samples of buckwheat.
Generally the content of minerals in
buckwheat grains and their morphological
fractions (dry basis) reaches (6: 2-2.5% in
whole grains, 1.8-2.0% in kernel, 2.2-3.5% in
dehulled grains, about 0.9% in flour, and 3.44.2% in hulls (Li and Zhang, 2001).
Table.1 Proximate analysis of buckwheat whole (BW), buckwheat groats (BG) and buckwheat
husk (BH)
S.N. Treatment
Moisture
1
2
3
BW
BG
BH
GM
Se
CD5%
CD1%
CV
Treatment
Error
Fat
Ash
Nutrients g/100g
Protein
Fibre
CHO
Mean SD Mean SD Mean SD Mean SD Mean SD Mean SD
8.56 0.62 2.02 0.42 2.34 0.03 11.34 0.05 9.35 1.18 66.35 1.48
7.19 0.45 2.68 0.22 2.04 0.02 14.88 1.31 3.46 0.45 69.72 1.89
5.16 0.62 0.76 0.34 2.15 0.04 9.91 0.91 10.74 1.00 71.25 2.50
6.97 1.56 1.82 0.89 2.18 0.13 12.05 2.35 7.85 3.44 69.11 2.77
0.32
0.19
0.02
0.53
0.54
1.1586
1.13*
0.68*
0.07*
1.84*
1.87*
4.00NS
1.72*
1.03*
0.11*
2.79*
2.83*
6.07NS
8.18
18.66
1.76
7.67
11.94
2.90
8.81
2.85
0.06
19.61
44.80
18.80
0.32
0.116
0.00
0.85
0.87
4.026
Energy
(Kcal)
Mean SD
329
8.11
362
3.79
331
4.99
341 16.98
3.41
11.83*
17.92*
1.74
1048.26
35.06
GM=General Mean, * Significant at 5% and 1% level of significance, NS = Non-significant
Table.2 Mineral composition of buckwheat whole (BW), buckwheat groats (BG) and buckwheat
husk (BH)
S.N.
Treatment
1
2
3
BW
BG
BH
GM
Se
CD5%
CD1%
CV
Treatment
Error
Calcium (ppm)
Mean
SD
76.80
0.57
38.13
0.97
149.66
6.12
88.20
49.14
2.07
7.18*
10.88*
4.08
9621.44
12.93
Iron (ppm)
Mean
SD
106.83
2.68
80.61
5.00
77.10
2.73
88.18
14.41
2.10
7.27*
11.01*
4.13
791.87
13.25
Zinc (ppm)
Mean
SD
20.50
1.58
23.83
1.28
14.83
1.17
19.72
4.11
0.78
2.71*
4.11*
6.90
62.11
1.85
GM=General Mean, * significant at 5% and 1% level of significance, NS = Non-significant
567
Copper (ppm)
Mean
SD
14.15
3.55
10.93
0.58
11.83
1.06
12.30
2.36
1.25
4.3342
NS
6.5659
NS
17.62
8.28
4.70
Int.J.Curr.Microbiol.App.Sci (2019) 8(3): 561-570
Table.3 Anti- nutritional analysis of buckwheat whole (BW), buckwheat groats (BG) and
buckwheat huck (BH)
S.N.
Teatment
1
2
3
BW
BG
BH
GM
Se
CD5%
CD1%
CV
Treatment
Error
Tannin%
Mean
SD
4.16
-0.00
4.16
-0.00
5.54
0.00
4.61
0.69
0.00
0.00
NS
0.00
NS
0.00
1.91
0
Phytic acid%
Mean
SD
18.36
1.90
6.23
2.40
18.30
3.71
14.30
6.51
1.60
5.55
8.41
19.45
146.41**
7.73
GM=General Mean, *significant at 5% and 1% level of significance, NS = Non-significant
Plate.1
(Buckwheat-BW) (Buckwheat Groats-BG) (Buckwheat Husk-BH)
and on ecological factors. The phytic acid
content was significantly ((p≤0.05) lower in
BG (6.233%) than BW (18.36%) and BH
(18.30%). Skrabanjia et al., (2004) studied
nutrient content in buckwheat milling
fractions. A unique distribution was found in
for phytate as correlation was significantly
positive in husk, bran and semolina fractions,
while correlation is significantly negative in
flour fractions.
Anti-nutritional analysis
The anti-nutritional factors viz tannin and
phytic acid was analyzed in all flour fractions.
The results obtained are presented in Table 3
and discussed below.
Tannin content was found to be highest in BH
(5.54%) than BW (4.16%) and BG (4.16%).
No significant difference was found in the
content of tannin. Sharma and Sahgal (1992)
reported that buckwheat seeds contain from
0.5 to 4.5% tannin depending on the genotype
Depending on chemical analysis of
buckwheat whole (BW), buckwheat groats
568
Int.J.Curr.Microbiol.App.Sci (2019) 8(3): 561-570
(BG) and buckwheat husk (BH), the
buckwheat groats considered nutritionally
dense due to its better macro and
micronutrient and low anti-nutritional content
than BW and BH. Pomranz and Rabbins
(1972) determined protein content and amino
acid composition in buckwheat and found that
groat is a good protein supplement. Phytic
acid was found significantly negative in flour
fraction than husk, bran and semolina
fractions (Skrabanja et al.,)
intakes and cardiovascular disease risk
factors in an ethnic minority of China.
American
Journal
of
Clinical
Nutrition.61: 366-732.
Ikeda S. and Yamashita Y. 1994.Buckwheat
as a dietary source of zinc, copper and
manganese. Fagopyrum. 14: 29-34.
Javornik
B.
&
Kreft,
I.
(1984),
Characterization
of
buckwheat
proteins, Fagopyrum4:30 38.
Jain S. and Mogra R. (2006), Analysis of food
components:
Practical
Mannual,
Department of Food and Nutrition,
College of Home Science, Maharana
Pratap University of Agriculture and
Technology, Udaipur, Rajasthan, India
Krotov A.S. 1963. Buckwheat, Izdatel' stvosel
Skonozjstvermij Literatury, Moscow
(In Russian).
Kim S.L., Kim S.K. and Park C.H. 2004.
Introduction and nutritional evaluation
of buckwheat sprouts as a new
vegetable.
Food
Research
International. 37:319–327.
Lipkin M., Reddy B., Newmark H.
&Lamprecht S.A. (1999), Dietary
fractors in human colorectal cancer,
Annual. Review of Nutrition.19:545586.
Li S. and Zhang Q.H. 2001. Advances in the
development of functional foods from
buckwheat. Critical Reviews in Food
Science and Nutrition.41: 451–464.
NIN. 1983. A manual of laboratory
techniques, Raghuramlu, N, Nair, K.
Mand Kalyanasundram, S. Eds.
National Institute of Nutrition, ICMR,
Hyderabad.
Pomeranz Y. and Robbins G.S. 1972.Amino
acid composition of buckwheat.
Journal
of
Agriculture
Food
Chernistry.20: 270-274.
Pomeranz Y. (1983), Buckwheat: structure,
composition and utilization, Critical
Review of Food Chemistry.19 : 213258.
References
Atanassova M. and Christova Bagdassarian
V. 2009. Determination of tannin
content by titrimetric method for
comparison of different plant species.
Journal of the University of Chemical
Technology and Metallurgy.44 (4)
413-415.
Bonafaccia G., Marocchini M. and Kreft I.
2003.Composition
and
technologicalproperties of the flour
and bran from common and tartary
buckwheat.Food Chemistry.80: 9-15.
Bonafaccia G. and Kreft I. 1994.
Technological
and
qualitative
characteristics of food products made
with buckwheat. Fagopyrum.14: 3542.
Barta J., Kalinova J., Moudry J. and Curn V.
2004.Effects of environmental factors
on protein content and composition in
buckwheat flour. Cereal Research
Communications.32: 541–548.
Fornal L. 1999. Chemizmnasiongryki i
kierunkispożywczegowykorzystania.
Biuletyn Naukowy. 4: 7–17.
Friendrich M., Stuhlfelder C., Theurer C.
2000. Buckwheat- herbal drug through
the ages. Zeitscrift-fur Phytotherapie,
21: 106-114
He J., Klag M. J., Whelton P. K., Mo J. P.,
Chen J. Y., Qian M. C., Mo P. S. and
He G. Q. 1995. Oats and buckwheat
569
Int.J.Curr.Microbiol.App.Sci (2019) 8(3): 561-570
Santos K.F.R., Oliveira T.T., Nagem T.J.,
Pinto A.S. and Oliveira M.G.A.
(1999),
Hypolipidaemic effects of narigenin, rutin,
nicotinic acid and their associations,
Pharma. Res. 40: 493-496.
Steadman K.J., Burgoon M.S., Lewis B.A.,
Edwardson S.E. and Obendorf R.L.
2001. Buckwheat seed milling
fraction: description, macronutrient
composition and dietary fibre. Journal
of Cereal Science.33: 271–278.
Skrabanja V., Kreft I., Golob T., Modic M.,
Ikeda, S., Ikeda K., Kreft S.,
Bonafaccia G., Knapp M. and
Kosmelj K. 2004. Nutrient Content in
Buckwheat Milling Fractions. In
Cereal Chemistry.172-176.
Wei Y., Zhang G.Q. and Li Z.X. 1995. Study
on nutritive and physico-chemical
properties of buckwheat flour.
Nahrung.39: 48–54.
How to cite this article:
Mani Mishra and Shashi Jain. 2019. A Comparative Study on Nutritional Profile and
Antinutrients of Buckwheat Fractions (Fagopyrum esculentum). Int.J.Curr.Microbiol.App.Sci.
8(03): 561-570. doi: />
570