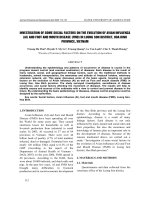
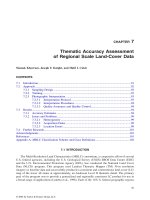
Remote sensing and gis application on forest cover change detection in Kim Tien commune, Kim Boi district, Hoa Binh province from 1995 to 2018
Bạn đang xem bản rút gọn của tài liệu. Xem và tải ngay bản đầy đủ của tài liệu tại đây (525.2 KB, 7 trang )
Management of Forest Resources and Environment
REMOTE SENSING AND GIS APPLICATION ON FOREST COVER
CHANGE DETECTION IN KIM TIEN COMMUNE, KIM BOI DISTRICT,
HOA BINH PROVINCE FROM 1995 TO 2018
Tran Quang Bao, Nguyen Thi Hue, Le Sy Hoa
Vietnam National University of Forestry
SUMMARY
Remote sensing technology and GIS are considered as an effective and objective tool in monitoring and
evaluating natural resources, especially in the detection of forest cover change. In this study, Landsat 5 TM
satellite images in 1995, 2002, 2011 and Landsat 8 OLI/TIRS in 2018 were used to classify and detect the areas
of forest change in Kim Tien commune, Kim Boi district, Hoa Binh province. NDVI (Normalized difference
vegetation index) was employed to classify the forest cover from downloaded satellite imagery after preprocessing. The study has constructed a database and maps about forest cover for 4 different years 1995, 2002,
2011, 2018 with the accuracy greater than 75%, maps of forest cover change during 4 periods 1995 – 2002,
2002 – 2011, 2011 – 2018 and 1995 – 2018. The results showed that the total area of forest cover increased
slightly, strongly fluctuated in the first period of 1995 – 2011, unevenly distributed and scattered throughout
the entire commune. The forest cover decrease was concentrated mainly near residential areas, tended to
expand gradually along the margin, especially according to the development of roads in the Southwest. Drivers
of forest cover increased during the period 1995 – 2018 were the effective applications of forest plantation
project, management, and protection.
Keywords: Change detection, forest cover, Hoa Binh province, Landsat, NDVI.
1. INTRODUCTION
Forests are important renewable natural
resources and have a significant role in
preserving an environment suitable for human
life (Ngai, 2009). Forest reduces flood,
drought, prevent erosion and landslide in both
frequency and intensity. In Vietnam, the forest
represents the characteristics of tropical
rainforest (De Queiroz et al., 2013). Forest
cover in 2016 is 41.19% (Loc, 2018). From
1979 to 1990 natural forest declined by 2.7
million hectares, accounted for 1.7%/year. In
the period 1999 - 2005, the area of rich natural
forest decreased and the medium forest
decreased by 10.2% and 13.4% respectively
(FIPI, 2009).
Nowadays, the development of the
technology of earth observation satellite,
remote sensing imagery and geographic
information systems (GIS) have been applied
in many fields of science and management (AlDoski et al., 2013). Currently many states, and
private forestry agencies, governments are
implemented GIS and remote sensing for
various applications (Pore, 2013), (Le et al.,
56
2015). In addition, it is a very useful tool for
analyzing change detection and mapping of the
land cover of the forest. It also has an
important contribution to make in documenting
the change in land use/land cover on regional
and global scales from the mid-1970s (Lambin
et al., 2003; Hung and Hoang, 2009; Ha, 2016;
Hoa et al., 2016).
The forest cover in Kim Tien commune,
Kim Boi district, Hoa Binh province accounted
for approximately 70% (Ha, 2016). However,
this area has many fluctuations between forest
land and productive land (Ngai, 2009). In
addition, satellite scenes available in this area
are often cloud-free. Based on GIS application
and remote sensing, this study was carried out
to construct maps and detail numbers of forest
cover and change detection in Kim Tien
commune as well as finding the key drivers of
forest change detection and solutions for
effective forest management.
2. RESEARCH METHODOLOGY
2.1. Study site
Kim Tien is a mountainous commune is
located in South-West of Kim Boi district (Hoa
JOURNAL OF FORESTRY SCIENCE AND TECHNOLOGY NO. 7 (2019)
Management of Forest Resources and Environment
Binh province) with a natural area of 2,178.79
ha, it is 4 kilometers to the center of Kim Boi
district (Figure 1).
Figure 1. Location of Kim Tien commune, Kimboi district, Hoa Binh province
2.2. Materials
The chosen period was from 1995 to 2018,
there were four different scenes: 1995, 2002,
2011 and 2018. Landsat 5 and Landsat 8
satellite images have been processed at level
L1 (include radiometric, geometric, and
precision correction, and uses a DEM to
correct parallax errors due to local topographic
relief) with a resolution of 30 m. The default
projected coordinate systems was WGS84
UTM zone 48N. All the satellite data were
downloaded freely on .
Table 1. Landsat images used in the study
Image codes
Acquisition date
LC81270462018158LGN00
2018/06/07
LT51270462011187BKT00
2011/07/06
LT51270462002290BJC00
2002/10/17
LT51270461995175BKT00
1995/06/24
2.3. Methods
2.3.1. Interviewing
To enhance the accuracy of the
classification method and forest cover change
detection: local people were interviewed,
including staffs and authorities of the Kim
Tien commune. For identifying the drivers of
land cover change: the study focused on local
people during the research period, middle-aged
people and elderly with traditional experiences.
2.3.2. Data processing
Image processing: ArcGIS 10.5 was
employed to construct maps of the forest over
the periods. The method of interpretation and
classification of images Landsat included three
main stages, preprocessing, classification and
change detection, representing in the following
workflows (Figure 2).
2.3.3. Classification using NDVI
Normalized Difference Vegetation Index
(NDVI) developed for estimating vegetation
cover from the reflective bands of satellite data
(Taufik et al., 2016). The multispectral remote
sensing data technique was used to find the
spectral signature of different objects such as
vegetation, concrete structure, road, urban
areas, rocky areas and remaining areas, the
formula of NDVI is expressed as follow (Singh
et al., 2016):
NDVI = (NIR – RED)/(NIR + RED)
Where: NIR is the reflection value of the
near-infrared band, RED is a reflection value
of the red band. Low NDVI value represents
where vegetation cover is low, in contrast, it is
high if the vegetation cover is high and range
from -1 to 1.
JOURNAL OF FORESTRY SCIENCE AND TECHNOLOGY NO. 7 (2019)
57
Management of Forest Resources and Environment
Figure 2. Workflows of the Study
2.3.4. Field survey
A field survey was conducted to collect
ground control points with the help of Global
Positioning System (GPS) device. The
surveyed points included information about
forest and other land use types as well as the
position (latitude and longitude) in order to
conduct the classification and accuracy
assessment. 210 points were collected in the
field, distributed evenly across the entire
boundary of the commune.
2.3.5. Accuracy assessment
Kappa coefficient was used to evaluate the
accuracy of classification result, based on the
land cover types from classified maps and real
field, Google Earth.
2.3.6. Change detection
Forest cover change detection was achieved
by overlay each pair of classified layers in a
specific period. The information of the overlay
map is a coincidence of unchanged objects and
the difference of objects in a region. From the
detection, the findings will provide information
about the change of forest cover over periods
58
in terms of spatial and time.
3. RESULTS AND DISCUSSION
3.1. Forest cover in Kim Tien in the period
1995 – 2018
3.1.1. NDVI thresholds
The study classified NDVI as follows: from
0.62 to 0.79: forest includes natural forest,
plantation forest; from 0.46 to 0.62: shrub and
grassland, from 0.36 to 0.45: residential area,
road, infrastructure, and bare land; from 0.1 to
0.36: agricultural land. The value of NDVI for
agriculture was lower than for the residential,
road and infrastructure because the acquisition
time was not in the crop season and almost was
bare land, the local people houses have been
unevenly distributed around the foot of the
mountain.
3.1.2. Forest cover maps
The forest cover maps were conducted by
using NDVI thresholds for each period: 1995,
2002, 2011 and 2018. The study focused on
forest change detection, so forest and nonforest were the two main objects for
interpreting.
JOURNAL OF FORESTRY SCIENCE AND TECHNOLOGY NO. 7 (2019)
Management of Forest Resources and Environment
Figure 3. Status of forest distribution in Kim Tien commune in the period 1995 – 2018
Figure 4 shows an area of forest in the study
site changed over the research period, there was
a change between forest and non-forest area
(residential, agriculture, water, bare land).
Area (ha)
2,500
2,000
1,690
1,764
1,822
1,919
Non-forest
1,500
1,000
484
500
Forest
411
352
256
0
1995
2002
2011
2018
Year
Figure 4. Non – forest and forest cover area changed over time
Forest cover in the study site was quite high
and has increased from 1995 to 2018, highest
in 2018, 1,918.62 ha (88.23%) and lowest in
1995, 1,690.29 (77.77%). The non-forest area
has declined from 1995 to 2018, 484.38 ha
(22.27%) to 256.05 ha (11.77%) respectively.
3.2. Accuracy assessment
Using the results of NDVI classification,
Google Earth and the field collected points, the
study determined the accuracy for each certain
year. The overall accuracy of the classified
forest cover map is 75.65% in 1995, 80% in
2002, 81.74% in 2011 and 84.35% in 2018.
3.3. Forest cover change from 1995 to 2018
3.3.1. Forest area
The forest change area value was extracted
from the change detection map (Figure 6) and
represented in table 2 with four different
objects: non-forest, forest decreases, forest
increase and forest unchanged.
JOURNAL OF FORESTRY SCIENCE AND TECHNOLOGY NO. 7 (2019)
59
Management of Forest Resources and Environment
Table 2. Forest area change detection from 1995 to 2018
Period
Objects
1995 - 2002
2002 - 2011
2011 - 2018
1995 - 2018
Area (ha)
Ratio (%)
Area (ha)
Ratio (%)
Area (ha)
Ratio (%)
Area (ha)
Ratio (%)
Non - forest
314.55
14.46
285.39
13.12
222.75
10.24
229.77
10.57
Forest decreases
96.30
4.43
66.87
3.07
33.30
1.53
26.28
1.21
Forest increases
169.83
7.81
125.46
5.77
129.51
5.96
254.61
11.71
Forest unchanged
1593.99
73.30
1696.95
78.03
1789.11
82.27
1664.01
76.52
Table 2 indicated the general trend of the
forest cover in the Yen Bai commune
illustration for the change detection of each
2,000
period. It is evident that from 1995 to 2013 the
forest increased significantly by 10% at the
end of this period.
1,789
1,697
1,594
1,664
Area (ha)
1,500
Non-forest
1,000
500
Forest decreases
315
96 170
285
67 125
223
33
130
255
230
26
Forest increases
Forest unchanges
0
1995 - 2002
2002 - 2011
2011 - 2018
Period
1995 - 2018
Figure 5. Forest area change in each period from 1995 to 2018
Figure 5 gives the big picture of what
happened in each surveyed period in terms of
forest cover changes over time. The two
objects forest cover decreases and increases
(indicated by orange and green respectively)
shows that the negative trend was forest
decrease almost all the time surveyed.
3.3.2. Change detection maps
Figure 6 illustrates how forest changed in
term of spatial distribution. The most
fluctuated areas were concentrated in the
northeast and the center of the commune.
Areas with forests increased scattered and
uneven while areas with forest declined were
concentrated near another land, mainly
residential and infrastructures.
Figure 6. Forest changed detection in three periods
60
JOURNAL OF FORESTRY SCIENCE AND TECHNOLOGY NO. 7 (2019)
Management of Forest Resources and Environment
Figure 7. Forest cover change in the period of 1995 – 2018
After the 23-year survey period, the map
was established to show a significant change in
forest cover. Similar to the mentioned periods,
the most changed forest area was still
concentrated around non-forest land, mainly
residential areas. After 2011, there was a clear
reduction in the forest to the southwest due to
the development of the road, along with the
development of the roadside residential area.
3.4. Driving forces of forest change
3.4.1. Forest decreases
Poor households occupied approximately
40% of the total population of Kim Tien,
awareness of local people was low. Because of
no land for production, and have no
investment, they destroyed the forest for their
own use. Some households illegally exploited
the forest to encroach on the land for
agricultural production. People always do
anything to get away from hunger, poverty and
they hunt animals, cut trees, exploit forest
product illegally to sell for money to serve the
need of their surviving.
3.4.2. Forest increases
From 1999 to 2017 there were two forest
plantation projects carried out in the commune:
661 and W7 project. The 661 project was
implemented since 1999 with the purposes
were planting, increasing forest cover, and
protecting forest also increasing awareness of
local people about protecting the forest. The
W7 project was carried out in 2010, it lasted in
7 years and finished in 2017 funded by
Germany. In this project, the commune was
supported on plant varieties and plant
techniques.
4. CONCLUSION
The research has successfully developed a
database and maps of forest status in 1995,
2002, 2011 and 2018 with appropriate
accuracy by using NDVI index, maps of forest
change detection in each period. According to
the results of the analysis, the proportion of
forest cover increased gradually from 1995 to
2018. In this period, the figures increased from
1690.29 ha to 1918.62 ha and the area without
forest decreased from 484.38 ha to 256.05 ha.
The number showed that forest land
management and forest plantation projects in
the research area has been conducted
effectively with some afforestation and
resforestation projects. The proposed solutions
to solve these forest losses are improving local
people’s livelihood, raising their awareness,
enhancing management and protection,
applying the cutting-edge technology in forest
management.
JOURNAL OF FORESTRY SCIENCE AND TECHNOLOGY NO. 7 (2019)
61
Management of Forest Resources and Environment
REFERENCES
1. Jwan Al-Doski, Shattri B Mansor & Helmi
Zulhaidi Mohd Shafri (2013). Image classification in
remote sensing. Department of Civil Engineering,
Faculty of Engineering, University Putra, Malaysia.
2. Menon Arr (2012). Remote sensing application in
agriculture and forestry.
3. JS De Queiroz, D Griswold, N Duc Tu & P Hall
(2013). Vietnam tropical forest and biodiversity
assessment. United States Agency for International
Development, the editor. Quito: Sun Mountain
International and Cadmus Group, Inc.
4. FIPI (2009). Vietnam forestry outlook study.
5. Tran Thu Ha (2016). Integrating GIS and Remote
sensing for supervising the forest changes in the area of
Cao Phong district, Hoa Binh province in the period
from 2005 to 2015.
6. Md Inzamul Haque & Rony Basak (2017). Land
cover change detection using GIS and remote sensing
techniques: A spatio-temporal study on Tanguar Haor,
Sunamganj, Bangladesh. The Egyptian Journal of
Remote Sensing and Space Science, 20, 251-263.
7. Nguyen Hai Hoa, Nguyen Thi Thu Hien &
Luong Thi Thu Trang (2016). Applications of GIS and
multi - temporal Landsat imageries to quantify changes
in extents of forest land in Xuan Dai and Kim Thuong
buffer zones, Xuan Son National Park.
8. Dang Ngoc Quoc Hung & Ho Dac Thai Hoang,
(2009). Study on the forest vegetation cover in Bach Ma
National Park, Thua Thien Hue province.
9. Pavneet Kaur Kingra, Debjyoti Majumder & Som
Pal Singh (2016). Application of remote sensing and GÍ
in agriculture and natural resource management under
changing climatic conditions.
10. Eric F Lambin, Helmut J Geist & Erika Lepers
(2003). Dynamics of land-use and land-cover change in
tropical regions. Annual review of environment and
resources, 28, 205-241.
11. Hien Thi Thu Le, Thang Nguyen Ngoc & Luc
Hens (2015). Assessment of the Irrigation Capacity
during the Dry Season Using Remote Sensing and
Geographical Information (Case Study in the Binh
Thuan Province, Vietnam). International Journal of
Geosciences, 6, 1214.
12. Ho Cong Loc (2018). Natural resources status in
Vietnam and the world.
13. Nguyen Ba Ngai (2009). Community forest
management in Vietnam: Status, problems and
solutions.
14. Madhavi Pore (2013). GIS & RS Application in
Forestry.
15. Ravi Prakash Singh, Neha Singh, Saumya Singh
& Saumitra Mukherjee (2016). Normalized difference
vegetation index (NDVI) based classification to assess
the change in land use/land cover (LULC) in Lower
Assam, India. International Journal of Advanced
Remote Sensing and GIS, 5, 1963-1970.
16. SH Sonti (2015). Application of Geographic
Information System (GIS) in Forest Management.
Journal of Geography & Natural Disasters, 5, 21670587.1000145.
17. Afirah Taufik, Sharifah Sakinah Syed Ahmad &
Asmala Ahmad (2016). Classification of Landsat 8
Satellite Data Using NDVI Thresholds. Journal of
Telecommunication,
Electronic
and
Computer
Engineering (JTEC), 8, 37-40.
18. Yinghui Xiao & Q. Zhan (2009). A review of
remote sensing applications in urban planning and
management in China.
ỨNG DỤNG VIỄN THÁM VÀ HỆ THỐNG THÔNG TIN ĐỊA LÝ ĐỂ
PHÁT HIỆN BIẾN ĐỘNG RỪNG TẠI XÃ KIM TIẾN, HUYỆN KIM BÔI,
TỈNH HOÀ BÌNH GIAI ĐOẠN 1995 - 2018
Trần Quang Bảo, Nguyễn Thị Huệ, Lê Sỹ Hòa
Trường Đại học Lâm nghiệp
TÓM TẮT
Công nghệ viễn thám và hệ thống thông tin địa lý (GIS) được coi là một công cụ hiệu quả và khách quan trong
việc giám sát và đánh giá tài nguyên môi trường, đặc biệt là trong việc xác định biến động diện tích rừng.
Trong nghiên cứu này, ảnh vệ tinh Landsat 5 TM năm 1995, 2002, 2011 và Landsat 8 OLI/TIRS năm 2018 của
xã Kim Tiến, huyện Kim Bôi đã được sử dụng để phân loại và xác định các khu vực có sự thay đổi của diện
tích rừng. Nghiên cứu sử dụng chỉ số khác biệt thực vật chuẩn hoá NDVI để thực hiện phân loại ảnh. Các bản
đồ phân loại đất rừng và đất khác năm 1995, 2002, 2011, 2018 đã được thành lập với độ chính xác trên 75%,
qua đó nghiên cứu cũng tạo được các bản đồ biến động lớp phủ rừng trong 4 giai đoạn khác nhau: 1995 - 2002,
2002 - 2011, 2011 - 2018 và 1995 - 2018. Kết quả cho thấy tổng diện tích che phủ rừng tăng dần qua các năm,
biến động nhiều nhất trong giai đoạn đầu, từ 1995 đến 2011 và phân bố không đồng đều, rải rác trên toàn bộ xã.
Khu vực giảm rừng tập trung chủ yếu ở gần khu dân cư, có xu hướng mở rộng theo sự phát triển của đường xá
ở phía Tây Nam của xã. Diện tích che phủ rừng tăng trong khoảng thời gian 1995 - 2018 có sự đóng góp của
các dự án trồng, quản lý và bảo vệ rừng trong hai năm là 1997 và 2017.
Từ khoá: Che phủ rừng, Chỉ số thực vật NDVI, Landsat, phát hiện biến động, tỉnh Hòa Bình.
Received
Revised
Accepted
62
: 04/3/2019
: 23/4/2019
: 02/5/2019
JOURNAL OF FORESTRY SCIENCE AND TECHNOLOGY NO. 7 (2019)