Distribution features of measured wave characteristics in coastal waters of Ninh Thuan province, Vietnam
Bạn đang xem bản rút gọn của tài liệu. Xem và tải ngay bản đầy đủ của tài liệu tại đây (749.51 KB, 8 trang )
Journal of Marine Science and Technology; Vol. 18, No. 4A; 2018: 13–20
DOI: 10.15625/1859-3097/18/4A/13633
/>
DISTRIBUTION FEATURES OF MEASURED WAVE
CHARACTERISTICS IN COASTAL WATERS OF
NINH THUAN PROVINCE, VIETNAM
Le Dinh Mau*, Nguyen Van Tuan
Institute of Oceanography, VAST, Vietnam
*
E-mail:
Received: 5-8-2018; accepted: 16-12-2018
Abstract. This paper presents the distribution features of wave characteristics based on the
continued measurement wave data with interval of 1 hour from January to December 2013 in
coastal waters of Ninh Thuan province. The study results show that the dominant wave directions
were in East-North-East (ENE), East (E), South-South-East (SSE) and South-East (SE) with
occurrence frequency of 36.7%, 20.5%, 18.2% and 11.6% respectively. During North-East (NE)
monsoon the dominant wave directions were in ENE and E. During South-West (SW) monsoon the
dominant wave directions were in SSE and SE. The remaining directions were rare. The maximum
values of wave height (Hmax) was 4.84 m (11/2013), wave period (T) was 10.9 s (11/2013). The
occurrence frequency of Hs ≤ 0.5 m was 43.9%, Hs ≈ 0.5–1.0m was 21.9%, Hs ≈ 0.5–1.0 m was
21.9%, Hs ≈ 1.0–2.0 m was 27.3%, Hs > 2.0 m was 6.8% and calm wave condition (Hs ≤ 0.25 m)
was 8.1%. The duration and intensity of wave action were dominant in NE monsoon period.
Keywords: Significant wave height (Hs), maximum wave height, Ninh Thuan, monsoon, coastal
zone.
INTRODUCTION
The East Sea is under the influence of
monsoon winds and synoptic systems such as
fronts and tropical cyclones. From November
to March, the weather in the sea is dominated
by northeasterly winter monsoon wind and
from June to August it is dominated by
southwesterly summer monsoon wind.
Vietnam is located in the South-East of Asia
and to the West of the East Sea, has 3,200 km
long coastline and many islands. Most of the
provinces of Vietnam are located along the
coastline. The coastal zone has an important
role in the economy of Vietnam through ports
and harbours, marine fisheries, tourism,
aquaculture,
petroleum
industries
and
environment protection. Wave characteristics
are the important factors in hydro-litho-
dynamic processes in the coastal zone and have
strong effects on economic and environment
protection activities. Therefore, determination
of wave characteristics in the nearshore region
has important role for design of marine
structures,
social-economical
activities...
Processes of formation, development and
dissipation of wave corresponding to the varied
conditions of wind, current and topography are
very complicated matters.
To obtain the wave regime at study area the
best choice is direct observation, but this way is
still limited in Vietnam since it needs modern
equipment and finance. The historical
development of measured wave equipment
was step by step modernized from using objectfinder, electrical resistance cable to pressure
sensors which were installed to AWAC, buoy
13
Le Dinh Mau, Nguyen Van Tuan
instruments,... Beside, the wave characteristics
are also observed by satellite and radar
equipment [1]. From 2009 the Center for
Oceanography, Ministry of Natural Resources
and Environment (MONRE) has installed
equipment to measure wave and current by
radar high frequency system (4.3–5.4 MHz) at
three stations at Quang Binh, Ha Tinh and Hai
Phong provinces [2]. The central station at Ha
Noi controls and manages the transmission and
reception of signal from 3 stations based on
installed softwares in a server which has
automatically received data with frequency of
24/24 h in a day. However, the radar data only
cover the Tonkin Gulf area. At present the
observed wave data in Southern Vietnam waters
are rare.
This paper presents the distribution features
of measured wave characteristics based on the
continued measurement with interval of 1 hour
from January to December 2013 in coastal
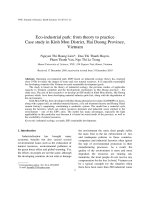
waters of Ninh Thuan province. Location of
study area is shown in fig. 1.
Fig. 1. Location of wave measurement station
MATERIAL AND METHOD
The field survey was carried out in
accordance with the Circular No. 34/2010/TTBTNMT: “The regulation for survey and
investigation of the oceanography, chemistry
and environment in the coastal and island
areas” dated December, 2010 issued by the
Vietnamese Ministry of Natural Resources and
Environment. Wind regime in the offshore
region of study area can be taken from Phu Quy
14
island wind station (1979–2012) which was
measured with the interval of 6 h. Typhoon
data along the coast from Da Nang to Binh
Thuan (1945–2010) were collected from
www.weather.unisys.com/hurricane (National
Weather Service, USA).
The automatic gauging station is placed
within the study area, as it is shown in fig. 1
in Vinh Truong hamlet, Phuoc Dinh
commune, Thuan Nam district, Ninh Thuan
Distribution features of measured wave…
province. The work was carried out based on
the Contract No. 142/HD-TV2-P02 dated
7/6/2012 between the Power Engineering
Consulting Joint Stock Company 2 (PECC2)
with the Institute of Oceanography for
subconsultant’s services for surveys and
investigation for the development of site
approval dossier and environment impact
assessment (EIA) of Ninh Thuan 1 Nuclear
Power Plant Project. The measured station is
at depth of about 20 m and offshore about 1.5
km with the coordinate of 109o1’10”E,
11o26’13”N by AWAC equipment (Made in
Norway), fig. 1.
STUDY RESULTS
Related natural conditions. Ninh Thuan
waters has narrow continental shelf and direct
interaction with hydro-dynamical processes
from open sea such as wind, wave, current,
storm-surge... Main oceanographical processes
are irregular dual tide with mean high tide of
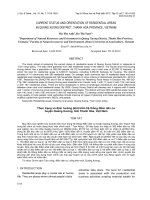
about 2 m. Wind regime in the offshore region
of study area can be taken from Phu Quy
island Station. The wind data show that the
study area undergoes the effect of seasonal
wind regime: NE and SW monsoons. The
main wind directions are from NE and SW
(fig. 2).
Fig. 2. Annual wind rose diagram at Phu Quy Station (1979–2012)
Occurrence of typhoon along the coast
from Da Nang to Binh Thuan were dominant in
October, November and December (table 1).
Table 1. Occurrence of typhoon along the coast from Da Nang to Binh Thuan (1945–2010)
Months
Number of typhoon
Rate (%)
5
6
7
8
9
10
11
2
0
1
0
5
22
28
9
3.0
0.0
1.5
0.0
7.5
32.8
41.8
13.4
The above mentioned information show
that the deploying site of AWAC equipment is
most strongly affected by wave action from
NE-E directions. That means the study site is
strongly affected by wave action during NE
monsoon and typhoon activity period
12
(October–December) and less affected during
SW monsoon. However, wave energy from
open sea especially in case of strong wave was
strongly transformed by the effects of
morphological conditions such as shallow
water and shoreline direction.
15
Le Dinh Mau, Nguyen Van Tuan
Distribution features of measured wave
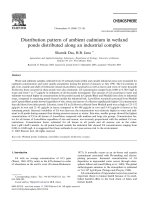
characteristics. Statistic results of distribution
features of measured wave height and direction
for the year 2013 show the dominant wave
directions were in ENE, E, SSE and SE with
occurrence frequency of 36.7%, 20.5%, 18.2%
and 11.6% respectively and calm wave
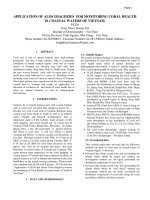
condition of 8.1% (fig. 3a). During NE
monsoon period (November, December,
January, February) the dominant wave
directions were in ENE and E (fig. 3b). During
SW monsoon period (June, July, August) the
dominant wave directions were in SSE and SE
(fig. 3c). And duration and intensity of wave
action were dominant in NE monsoon period.
Fig. 3a. Frequency distribution of significant wave height-Hs (m) in 2013
Fig. 3b. Frequency distribution of significant wave height-Hs (m) during NE monsoon
period of the year 2013 (November, December, January, February)
16
Distribution features of measured wave…
Fig. 3c. Frequency distribution of significant wave height-Hs (m) during SW monsoon
period of the year 2013 (June, July, August)
Wind data from fig. 2 and wave data from
fig. 3a, 3b, 3c indicate that the study site was
less affected by incident wave from SW
direction. That means during SW monsoon wave
energy in study area was mainly induced by
breeze or wave refraction from offshore region.
During 2013 the maximum wave height
Hmax(m) value was 4.84 m in November 2013
and minimum value was 0.18 m in June 2013
(table. 2, fig. 4). The maximum value of H max
also occurred during NE monsoon.
Similarly, the monthly distribution of
significant wave height Hs(m) shows that the
maximum value was 3.24 m in February 2013
and minimum value was 0.12 m in September
2013 (table 3, fig. 5).
Table 2. Monthly distribution of maximum wave height-Hmax(m) during 2013
Average Hmax(m)
Max Hmax(m)
Min Hmax(m)
January
Months
2.32
4.20
1.02
February
2.13
4.21
0.51
March
1.21
3.97
0.24
April
0.90
2.54
0.24
May
0.60
3.36
0.19
June
0.58
1.55
0.18
July
0.56
1.58
0.21
August
0.62
1.17
0.26
September
0.65
1.94
0.18
October
1.37
4.22
0.45
November
1.89
4.84
0.74
December
2.72
4.63
0.83
Year
1.29
4.84
0.18
17
Le Dinh Mau, Nguyen Van Tuan
Fig. 4. Diagram of the monthly distribution of maximum wave height-Hmax(m) during 2013
Table 3. Monthly distribution of significant wave height-Hs(m) during 2013
Months
January
February
March
April
May
June
July
August
September
October
November
December
Year
Average Hs(m)
Max Hs(m)
Min Hs(m)
1.53
1.41
0.80
0.60
0.39
0.38
0.37
0.41
0.43
0.92
1.24
1.81
0.85
2.58
3.24
2.61
1.59
2.01
1.03
1.09
0.73
1.11
2.17
3.23
2.93
3.24
0.65
0.37
0.19
0.15
0.13
0.14
0.15
0.19
0.12
0.30
0.53
0.60
0.12
Fig. 5. Diagram of the monthly distribution of significant wave height-Hs(m) during 2013
18
Distribution features of measured wave…
Monthly distribution of wave period T(s)
shows that the maximum value was 10.9 s in
November 2013 and minimum value was 1.98 s
in April 2013 (table 4, fig. 6). That means
during NE monsoon wave period was larger
than that of SW monsoon.
Table 4. Monthly distribution of wave period-T(s) during 2013
Months
January
February
March
April
May
June
July
August
September
October
November
December
Year
Average
Max
Min
4.67
4.42
4.17
3.68
3.31
3.30
3.37
3.37
3.79
4.53
4.69
4.93
4.01
6.25
6.17
7.77
6.51
6.34
5.06
5.79
5.28
7.14
9.92
10.90
6.83
10.90
2.66
2.09
2.34
1.98
2.10
2.01
2.03
2.30
2.01
2.52
3.10
2.97
1.98
Fig. 6. Diagram of the monthly distribution of wave period-T(s) during 2013
During 2013 the occurrence frequency of
Hs ≤ 0.5 m was 43.9%, Hs ≈ 0.5–1.0 m was
21.9%, Hs ≈ 0.5–1.0 m was 21.9%, Hs ≈ 1.0–2.0
m was 27.3%, Hs > 2.0 m was 6.8% and calm
wave condition (Hs ≤ 0.25 m) was 8.1%.
CONCLUSIONS
Ninh Thuan waters has narrow continental
shelf and direct interaction with hydrodynamical processes from open sea such as
wind, wave, current, storm-surge... especially
during NE monsoon and typhoon activity
period.
During 2013 the dominant wave directions
were in ENE, E, SSE and SE with occurrence
frequency of 36.7%, 20.5%, 18.2% and 11.6%
respectively and calm wave condition of 8.1%.
During NE monsoon period (November,
December, January, February) the dominant
wave directions were in ENE and E. During
SW monsoon period (June, July, August) the
dominant wave directions were in SSE and SE.
And duration and intensity of wave action were
dominant in NE monsoon and typhoon activity
period.
19
Le Dinh Mau, Nguyen Van Tuan
The maximum value of wave height (H max)
was 4.84 m (11/2013), that of wave period (T)
was 10.9 s (11/2013). The occurrence
frequency of Hs ≤ 0.5 m was 43.9%, Hs ≈ 0.5–
1.0 m was 21.9%, Hs ≈ 0.5–1.0 m was 21.9%,
Hs ≈ 1.0–2.0 m was 27.3%, and Hs > 2.0 m was
6.8%.
The duration and intensity of wave action
were dominant in NE monsoon period.
Acknowledgements: The authors gratefully
acknowledge the Vietnam Electricity (EVN)
and the Power Engineering Consulting JSC 2
(PECC2) for permission of the publication of
the observed data to the Contract No. 142/HDTV2-P02 dated 7/6/2012 between PECC2 and
the
Institute
of
Oceanography
for
subconsultant’s services for surveys and
investigation for the development of site
approval dossier and environment impact
assessment (EIA) of Ninh Thuan 1 Nuclear
Power Plant Project. The authors also gratefully
acknowledge the colleagues in the Institute of
Oceanography for their kind help and
encouragement throughout the preparation of
the paper.
REFERENCES
[1] CEM, 2010. Coastal Engineering Manual.
U.S. Army Corps of Engineers.
[2] Le, D. M., Tran, H. L., Nguyen, M, C.,
2015. Present state of ocean observation
and service in Vietnam. Journal of Marine
Science and Technology, 15(4), 309-319.
DOI: 10.15625/1859-3097/15/4/7376.
ĐẶC ĐIỂM PHÂN BỐ CÁC ĐẶC TRƯNG SÓNG
TẠI VÙNG BIỂN VEN BỜ TỈNH NINH THUẬN
Lê Đình Mầu, Nguyễn Văn Tuân
Viện Hải dương học, Viện Hàn lâm Khoa học và Công nghệ Việt Nam, Việt Nam
Tóm tắt. Bài báo trình bày đặc điểm phân bố các đặc trưng sóng từ chuỗi số liệu sóng tự ghi liên
tục với tần suất 1 giờ/lần từ tháng 1 đến tháng 12 năm 2013 tại vùng biển ven bờ tỉnh Ninh Thuận.
Kết quả phân tích, thống kê cho thấy hướng sóng chủ đạo là đông-đông bắc, đông, nam-đông nam
và đông nam với tần suất xuất hiện tương ứng là 36,7%, 20,5%, 18,2% và 11,6%. Thời kỳ gió mùa
Đông Bắc hướng sóng chủ đạo là đông-đông bắc và đông. Thời kỳ gió mùa Tây Nam hướng sóng
chủ đạo là nam-đông nam và đông nam. Các hướng còn lại có tần suất xuất hiện không đáng kể. Độ
cao sóng (Hmax) lớn nhất là 4,84 m (11/2013), chu kỳ sóng lớn nhất là 10,9 s (11/2013). Tần suất
xuất hiện của độ cao sóng hữu hiệu Hs ≤ 0,5 m là 43,9%, Hs ≈ 0,5–1,0 m là 21,9%, Hs ≈ 0,5–1,0 m là
21,9%, Hs ≈ 1,0–2,0m là 27,3%, Hs > 2,0 m là 6,8% và lặng sóng (Hs < 0,25 m) là 8,1%. Thời gian
và cường độ tác động của sóng chiếm ưu thế trong thời kỳ gió mùa Đông Bắc.
Từ khóa: Độ cao sóng hữu hiệu (Hs), độ cao sóng cực đại (Hmax), Ninh Thuận, gió mùa, dải ven
biển.
20