Water quality assessment using the Pollution Index (PI) and statistical tools: A case study of Thi Vai river, Dong Nai, Vietnam
Bạn đang xem bản rút gọn của tài liệu. Xem và tải ngay bản đầy đủ của tài liệu tại đây (2.41 MB, 7 trang )
Environmental Sciences | Ecology
Doi: 10.31276/VJSTE.60(4).71-77
Water quality assessment using the Pollution Index (PI)
and statistical tools: a case study of Thi Vai river,
Dong Nai, Vietnam
Thi Hong Nguyen*
Faculty of Environment, Ho Chi Minh city University of Natural Resource and Environment
Received 18 May 2018; accepted 29 August 2018
Abstract:
The quality of river water is influenced by two
factors: nature and man. The aims of this paper are
to determine the influence of anthropogenic sources
of pollution on water quality, by assessing integrated
measurements from use of the Pollution Index (PI) of
Indonesia and diverse statistical techniques, including
one-way analysis of variance (ANOVA) and ArcGIS.
In this study, 10 physicochemical parameters for the
determination of water quality, from surface water
taken the Thi Vai river, are examined: dissolved
oxygen (DO), biochemical oxygen demand (BOD5),
chemical oxygen demand (COD), ammonium (NH4+-N),
phosphate (PO43--P); total dissolved solids (TSS),
pH, nitrite (NO2-), nitrate (NO3-), total coliforms, and
fecal E. coli. The samples were collected from seven
monitoring sites, for assessing spatial and temporal
water quality, in the three years 2015 to 2017.
The findings revealed that water quality index values
within the study area showed a significant pollution
level for nitrite, and fecal E. coli. Water quality was
detrimental at the sites TV2, TV3, and TV4. A further
finding was that there was significant variation
recorded between the two methods of measuring PI
- that of the Ministry of the Environment, Indonesia,
and that of Vietnam. Finally, this integrated technique
could, it is suggested, be an effective approach for
communicating information on water quality for
sustainable waste management in Thi Vai river.
Keywords: affect, assessment, Dong Nai, environment,
Pollution Index, surface water, Thi Vai, Water Quality
Index.
Classification number: 5.1
Introduction
Human beings in modern society adversely affect the
quality of surface water through various areas of activity,
such as agriculture and industry. Natural forces such as
stormwater run-off events, can also cause problems, such as
the seasonal phenomenon of soil erosion, which is largely
affected by factors such as climate, land cover, land slope,
and soil resilience [1].
Without doubt, a variety of physical, chemical, and
biological factors can be harmful to human health, if they
occur over and above permissible limits [1-3]. The PI is
one of the most effective methods for assessing the status
of water. The values of the Water Quality Index (WQI)
or PI (PI) can be used to modify policies and to forward
feasible measures for management and use of surface
water resources, as formulated by various environmental
monitoring agencies [4-6].
River water quality is readily affected by both
anthropogenic impacts and natural processes, leading to
degradation of surface water, which in turn fails to meet
various purposes [1, 2]. Furthermore, the WQI has been
considered to pose sorting water quality [6, 7].
Statistical techniques are useful for verifying changes
over time and space that are caused by natural and
anthropogenic processes [1, 2]. Of these, Analysis of
Variance (ANOVA) was applied to evaluate the significant
disparity between groups of monitoring stations and across
seasons. Assessing the relationships between dependent and
independent variables by use of Spearman’s Correlation
Analysis (SCA) has been popular in scientific research [2-4,
8].
QCVN 08-MT:2015/BTNMT is presently being
harnessed as the national technical regulation on evaluation
of surface water in Vietnam. This monitoring programme
*Email:
December 2018 • Vol.60 Number 4
Vietnam Journal of Science,
Technology and Engineering
71
Environmental Sciences | Ecology
requires numerous parameters to be measured, analyzed,
and explained, through the multivariate approach. The
Water Quality Index (WQI), which involves a single number
expressing water quality by integrating measurement values
across many physicochemical parameters, is used to indicate
the overall status of surface water quality [4-7].
The Ministry of Natural Resources and Environment
of Vietnam (MONRE) has developed the WQI approach,
as explained in Decision No. 879/QD-TCMT, to create
guidelines on surface water quality for the protection and
management of water resources. The WQI, which suits
conditions in Vietnam well, evolved from the combination
of weighted arithmetic WQI values with River Status Index
(RSI) [4]. Accordingly, nine water quality parameters, those
of temperature, DO, BOD5, COD, NH4+-N, PO43--P; TSS,
pH, and total coliforms, were chosen to calculate WQI. The
WQI number ranges, which are colour-banded, are from 0
to 100; the higher the number, the better the water quality.
This study also monitors additional indicators such as
NO2-, NO3-, and fecal E. coli. Hence, another method, that
of the PI (PI) of Indonesia, is also used to evaluate water
quality. This method is based on the Indonesian Ministry
of the Environment’s Decree No115/2003 regarding the
“Guidelines for determination of water quality status”.
Thanh and Nhon Trach districts, through canals which
flow into the river. One of the most common sources of
pollution is that of water pollution, which is characterized
by the presence of organic pollutants (BOD5, COD),
TSS, nutrients, oils, and microorganisms in the water. At
present, urban centres in Dong Nai province do not have
concentrated wastewater treatment systems, and wastewater
is drained into the common drainage system. The results of
a survey of 50 households situated along the Thi Vai river
indicated that these households use groundwater, which is
then discharged untreated directly into the canal, draining
into Thi Vai river.
Most canals in the upstream area of the Thi Vai river
have poor water quality. The parameters for COD, BOD5,
ammonium, nitrite, coliform, and E. coli exceed those
specified in QCVN 08-MT:2015/BTNMT, column B1, on
multiple occasions.
Sampling, measuring, and analysis
This topic will offer support for scientists as well as
managers in the field, such as those working in ecology,
resources, and environmental protection, who can use this
study for monitoring the ecological health of Thi Vai river,
Dong Nai province [9].
Materials and methods
Study area
The Thi Vai river starts in the Nhon Tho town of Dong
Nai’s Long Thanh province, running through the Tan Thanh
district of Ba Ria - Vung Tau province and the Can Gio
district of HCMC before flowing into the Eastern Sea. Its
total length is approximately 76 kilometers and its total
basin area around 300 square kilometers. The river receives
around 34,000 cubic meters of discharged untreated
wastewater daily, from nearly 200 operating enterprises
situated along the basin; it also receives untreated wastewater
from populated areas, aquaculture, fish farming, and cattleraising farms.
The rainy season in the Thi Vai river area begins at
the end of May and ends in the last week of October. This
accounts for 90% of the whole year’s rainfall; the remainder
of the year is the dry season.
The total discharged volume into Thi Vai river directly
from industrial activities in Dong Nai and Ba Ria - Vung
Tau provinces, is 36,357 m3/day. Besides the direct sources
mentioned above, the river also receives indirect wastewater
from production facilities and industrial zones in Long
72
Vietnam Journal of Science,
Technology and Engineering
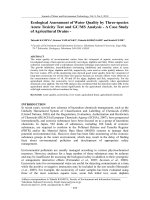
Fig. 1. Map of Monitoring Positions on Thi Vai river.
Where: TV1: confluence of Ba Ky canal on Thi Vai river; TV2:
Long Tho Ward; TV3: Vedan large water ditch; TV4: Go Dau
port; TV5: float number 23; TV6: Phu My Thermal Power Plant;
TV7: float number 7.
December 2018 • Vol.60 Number 4
WQI =
�
�
���
���
WQI�� 1
1
� � WQI� x � WQI� xWQI� �
100 5
2
�
Where: WQIa is determined through five parameters: DO, BOD5, COD, NH4+-N, and PO43-P; WQIb is calculated by TSS and turbidity; WQIc was calculated with total coliform
Sciences | Ecology
parameter.
parameter, and WQIpH is determined by pHEnvironmental
WQI is distinguished according to a range from 0 to 100, the values corresponding to
specific colours, and higher numbers signifying better water quality. The WQI process of
water quality
ranking
was performed
as corresponding
in Table 1.
Technical guidance for sampling
water and
sample
the values
to specific colours, and higher
treatments is specified in TCVN 6663-6:2008 (ISO 5667- numbers signifying better water quality. The WQI process
Table 5667-3:1985),
1. Surface water
classification
basedwas
on performed
WQI.
6:2005), TCVN 6663-3:2003 (ISO
andquality
of water
quality ranking
as in Table 1.
Water
Quality
TCVN 6663-6:2008 (ISO 5667-6:2005) respectively. The WQI range/colour
ratingclassification based on WQI.
Table 1. Surface water quality
measurements for pH and DO were analyzed in the field;
Excellent water
others samples were brought to the laboratory for analysis. 91-100
WQI (Blue)
range/colour
Water quality rating
quality
91-100 (Blue)
Excellent water quality
Good
water
The data on 11 physical and chemical parameters for 71-90
(Green)
quality
71-90 (Green)
Good water quality
surface water quality were collected at seven sampling
Medium
water
locations in the Thi Vai river basin, during the period 2015- 51-70
51-70
(Yellow)
Medium water quality
(Yellow)
quality
2017, by the Centre for Monitoring Natural Resources and
26-50 (Orange)
Poor water quality
Poor
water
Environment (DONRE) of Dong Nai province (Fig. 1.) 26-50 (Orange)
quality
0-25 (Red)
Very bad water quality
After collection, physicochemical parameters including
Very bad water
+
3- 0-25 (Red)
DO, BOD5, COD, NH4 -N, PO4 -P, TSS, pH, NO2 , NO3 ,
quality
The analysis of river
water quality according to the
total coliforms, and fecal coli were analyzed according to
PI followed the guidelines designated by the Ministry of
the procedures laid down in APHA, 1999
[10]. Theofdata
The analysis
river Natural
water Resources
quality according
to the PIDecree
followed
the guidelines
and Environment’s
No 115/2003,
were then structured through use
of
the
SPSS
designated by thesoftware
Ministry of
Natural
Resources
and
Environment’s
Decree
No 115/2003,
which uses the equation below:
program for statistical analysis. which uses the equation below:
Statistical analysis and ArcGIS
�
��� ��� � � ��� ��� �
�
�I = �
2
�
The box-and-whisker plot statistical technique was
where: Lij is the concentration of water quality parameters; Ci: concentration of water
used to evaluate seasonal variance in the pollution status where: L is the concentration of water quality parameters;
quality parameters; PIj: PI of water; R:
ij average; M: maximum.
of the Thi Vai river basin. One-way
Analysisofofthe
Variance
Ci:is:
concentration
of water
qualityofparameters;
PIj: PI1.0
standards
excellent quality;
Assessment
PI estimate
0≤PIj≤1.0: meets
(0.01≤alpha≤0.05) was used to investigate
substantial
≤10:
steadily
polluted;
PI
>10:
drastically
polluted.
5.0: slightlythe
polluted;
5.0
average;
M:
maximum.
J
j
disparity in the mean of the PI across locations and seasons
Results and discussion
Assessment of the PI estimate is: 0≤PIj≤1.0: meets
[2, 4]. Furthermore, Spearman’s Correlation Analysis
standards
of physicochemical
excellent quality; 1.0
Water quality
assessment
based on
parameters
J
(SCA) was used to evaluate the relationships
between
the
WQI (or PI) and physicochemical parameters. This study 5.0<PIJ ≤10: steadily polluted; PIj>10: drastically polluted.
also monitored additional indicators such as NO2-, NO3-, and Results and discussion
fecal E. coli. The PI of Indonesia was used to evaluate water
Water quality assessment based on physicochemical
quality, and was essential for this research. In this study,
parameters
all statistical procedures were executed by using the SPSS
ross locations and22.0
seasons
[2, In
4]. addition,
Furthermore,
Spearman’s
tool.
ArcGIS
10.0Correlation
was also Analysis
applied,(SCA)
to
Table 2 and Figure 2 below compare the disparity in
as used to evaluate the relationships between the WQI (or PI) and physicochemical
the
percentage of samples that failed to meet Vietnamese
distinguish water quality for specific purposes
[3,
4,
6,
7].
arameters. This study also monitored additional indicators such as NO2-, NO3-, and fecal E.
oli. The PI of Indonesia
was quality
used to evaluate
water quality, and was essential for this technical requirements regarding surface water quality
Water
index (WQI)
search. In this study, all statistical procedures were executed by using the SPSS 22.0 tool. QCVN 08-MT:2015:BTNMT (B1) during the period 2015
addition, ArcGIS 10.0The
was Vietnamese
also applied, toWQI
distinguish
waterNo.
quality
for specific purposes
Decision
879/QD-TCMT
is to 2017.
, 4, 6, 7].
used to determine water quality based on nine parameters:
Water quality index (WQI)
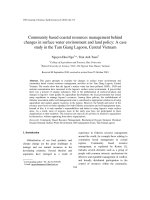
Overall, what is striking from looking at the table and
, COD,
NH4+-N, PO43-is-P;
TSS,
pH, temperature,
The VietnameseDO,
WQIBOD
Decision
No. 879/QD-TCMT
used
to determine
water quality graphs is that surface water is polluted significantly by
5
ased on nine parameters:
DO,coliforms
BOD5, COD,
and total
[8].NH4+-N, PO43--P; TSS, pH, temperature, and
concentrations of COD, NO2-, and E. coli. In fact, COD
tal coliforms [8].
�
concentrations in both the dry and the rainy season failed
�
�
�
WQI�� 1
1
to meet admissible standards and varied considerably,
WQI =
� � WQI� x � WQI� xWQI� �
2
100 5
���
���
at 33.33% and 46.33% respectively, with great variance
Where: WQIa is determined through five parameters: DO, BOD5, COD, NH4+-N, and PO43between the seasons. Likewise, there was an upward trend
; WQIb is calculated
by TSS
WQIcthrough
was calculated
with total coliform
where:
WQIand
isturbidity;
determined
five parameters:
DO,
a
in E. coli, the samples of which exceeded the permissible
arameter, and WQIpH is determined
by pH
parameter.
+
3, COD, NH
-N, and
-P; WQI
is calculated
by to
BODaccording
5
b
WQI is distinguished
to a 4range
fromPO
0 to4 100,
the values
corresponding
levels in the dry season and the wet season, at 13.10 and
was calculated
with
total
coliform
andnumbers
turbidity;
WQIc better
ecific colours, andTSS
higher
signifying
water quality.
The
WQI
process of
24.14, respectively, again with a great difference between
ater quality rankingparameter,
was performed
in Table
is 1.determined by pH parameter.
andasWQI
pH
the two seasons. With regards to NO2-, almost 100% of the
able 1. Surface water WQI
quality
based
on WQI.
is classification
distinguished
according
to a range from 0 to 100, sampling sites failed to meet acceptable standards, with an
WQI range/colour
91-100 (Blue)
71-90 (Green)
51-70 (Yellow)
Water Quality
rating
Excellent water
quality
Good
water
quality
Medium water
quality
December 2018 • Vol.60 Number 4
Vietnam Journal of Science,
Technology and Engineering
73
Environmental Sciences | Ecology
Table 2. The proportion of samples that failed to meet the necessary standards.
TV-1
Parameter
QCVN*
pH
TV-2
TV-3
TV-4
TV-5
TV-6
TV-7
Mean
Dry
(%)
Wet
(%)
Dry
(%)
Wet
(%)
Dry
(%)
Wet
(%)
Dry
(%)
Wet
(%)
Dry
(%)
Wet
(%)
Dry
(%)
Wet
(%)
Dry
(%)
Wet
(%)
Dry
(%)
Wet
(%)
5,5-9
0.00
0
0.00
0
0.00
0
0.00
0
0.00
0
0.00
0
0.00
0
0.00
0.00
DO
≥4 mg/l
0.00
0
12.50
12.5
0.00
12.5
12.50
25
0.00
0
0.00
0
0.00
0
1.79
3.57
BOD5
<15 mg/l
0.00
0
0.00
0
0.00
0
0.00
0
0.00
0
0.00
0
0.00
0
0.00
0.00
COD
<30 mg/l
50.00
50
50.00
50
37.50
62.5
37.50
62.5
62.50
62.5
16.67
60
16.67
40
33.33
46.43
NH4+-N
<0.9 mg/l
0.00
0
0.00
0
0.00
0
0.00
0
0.00
0
0.00
0
0.00
0
0.00
0.00
TSS
<50 mg/l
12.50
0
12.50
12.5
12.50
0
0.00
0
0.00
0
16.67
0
0.00
0
7.74
1.79
NO2--N
<0.05 mg/l
100.00
100
100.00
100
100.00
100
100.00
100
100.00
100
83.33
80
50.00
60
76.19
77.14
NO3--N
<10 mg/l
0.00
0
0.00
0
0.00
0
0.00
0
0.00
0
0.00
0
0.00
0
0.00
0.00
PO43--P
<0.3 mg/l
0.00
0
0.00
0
0.00
0
0.00
0
0.00
0
0.00
0
0.00
0
0.00
0.00
E. Coli
<100 mg/l
37.50
50
25.00
50
0.00
37.5
12.50
37.5
12.50
12.5
16.67
20
0.00
20
13.10
27.14
Coliform
<7,500 mg/l
0.00
0
0.00
0
0.00
0.00
0.00
0
0.00
0
0.00
0
0.00
0
0.00
0.00
Note: QCVN*: national technical regulations on surface water quality, QCVN 08-MT:2015/BTNMT (B1). B1 is the surface water
source for irrigation or other purposes.
Dry: dry season; Wet: wet season.
Fig. 2. Nitrite (A) and E. Coli (B) concentrations across the seasons, in the observed period of 2015-2017.
average range of 91.56±9.01 during the observed period,
and significant seasonal variation. The causes of this issue
could include the discharge of untreated wastewater from
domestic use, seafood processing, aquaculture, fish farming,
industrial activities, and agricultural run-off.
74
Vietnam Journal of Science,
Technology and Engineering
Water quality index assessment
The Vietnamese WQI is calculated on nine parameters.
These do not include NO2-, or NO3-. However, the water
quality of the Thi Vai river was polluted by these indicators.
Therefore, the results of the statistical analysis illustrate the
December 2018 • Vol.60 Number 4
Environmental Sciences | Ecology
great disparity between the WQI method of Vietnam and the
PI of Indonesia. Hence, this study uses the Indonesian PI
method for assessing water quality.
PI analysis
The striking observation from Fig. 3 is that the period
in question witnessed a considerable downward trend in PI
from upstream to downstream, corresponding to improved
water quality (Fig. 3, Table 3). Furthermore, PI value
was the highest in 2015, estimated at 2.09±0.68; this was
followed by the PI value of 2017 (1.69±0.54); with the
smallest estimation being 1.59±0.63 in 2016 (Table 3, Figs.
(A)
4, 5). Thus, the average difference between 2015, 2016, and
2017 was negligible (Fig. 4). Furthermore, the statistical
analysis by ANOVA showed no dramatic difference in PI
value between the three years.
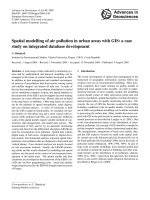
The Box-and-whisker plots (Fig. 3) show that the
PI values at the various sampling locations witnessed
remarkable differences during the period 2015 to 2017, with
PI values in the wet season being much greater than in the
dry season. This seasonal change is most marked in 2016
(Fig. 3A). Moreover, in the wet season of 2015, the values
for the two observations were outside the graph range. It
is therefore important to determine the exact causes of this
phenomenon, in order to bring in effective measures for
the Thi Vai river. Furthermore, the PI value demonstrated
a surge from TV1 to TV2, after which it declined slightly,
from TV2 to TV4, then continued to drop rapidly to TV7.
In general, pollution is seen to be mainly concentrated in
the upstream areas of the river, such as the Ba Ky - Thi Vai
canal, Long Tho, Vedan, and Go Dau areas. It is noteworthy
that sites TV2 and TV3 receive a large quantity of untreated
waste from industrial zones, fish farming, and aquaculture,
which would have a detrimental effect on water quality.
The summary in Table 2 shows that at locations TV1,
TV2, TV3, TV4, TV5, and TV6, water quality failed to meet
permissible standards for the supply of residential domestic
water, and was lightly polluted. The exception to this was
site TV7, where water quality met the necessary standards
(Table 3, Figs. 5, 6).
Table 3. Average annual PI and rankings.
(B)
Average annual PI
Code
Fig.
about
seasonal
changes;
wasspatial
aboutchanges
spatial
Fig. 3.
3. A(A)
waswas
about
seasonal
changes;
B was(B)
about
changes.
2015
2016
2017
Ranking
TV-1
2.68
1.45
1.36
Lightly polluted (LP)
TV-2
2.55
2.25
1.88
Lightly polluted
TV-3
2.56
2.32
2.49
Lightly polluted
TV-4
2.48
2.30
2.21
Lightly polluted
TV-5
1.89
1.14
1.87
Lightly polluted
TV-6
1.34
0.94
1.20
Lightly polluted
TV-7
0.77
0.75
0.85
Met quality standards
Mean
2.09±0.68
1.59±0.63
1.69±0.54
Table 3. Average annual PI and rankings.
Average annual PI
Code
2015
2016
2017
TV-1
2.68
1.45
1.36
TV-2
2.55
2.25
1.88
Ranking
Lightly polluted
(LP)
December
2018 • Vol.60 Number 4
Lightly polluted
Vietnam Journal of Science,
Technology and Engineering
75
Environmental Sciences | Ecology
3.00
2.00
1.00
0.00
TV-1 TV-2 TV-3 TV-4 TV-5 TV-6 TV-7
2015
2016
12
10
8
6
4
2
0
TV-1
2017
Fig. 5. Average annual PI.
Fig. 5. Average Annual PI.
TV-2
TV-3
TV-4
TV-5
TV
Fig. 6. Partition water qualit
12
Spatial and temporal variations at the monitoring sites (ANOVA
10
The results of the one-way HP
ANOVA analysis illustrate that
2.00
8
the
dry seasonis dramatically diMPerent to that in the wet season
6
statistical
results indicate the seasonal
changes were very distinc
LP
1.00
4 not for2017. The results also indicate thee
acy of the ANO
but
MQS
0.00
to2 this study. Seasonal factors 2015
strongly impact water quality in
TV-1 TV-2 TV-3 TV-4 TV-5 TV-6 TV-7
0
for the
areas
(Sig. =0.000, α=0.05), which
2016 is a bene
TV-1 TV-2
TV-3 TV-4 TV-5
TV-6 range
water
environment.
A wide
2015
2016
2017
2017 of parameter concentratios
pollution at the monitoring stations w
ere recorded during the pe
Fig. 6. Partition
quality according
to PI. at each sampling site may b
indicates
that water
the sources
of pollution
3.00
Fig. 5. Average Annual PI.
Fig. 6. Partition water quality according to PI.
Spatial and temporal variations at the monitoring sites
Spatial and temporal variations at (ANOVA)
the monitoring sites (ANOVA )
The results of the one-way ANOVA (I)analysis
illustrate that the mean PI value in(I -J)
TheSeason
results of the one-way ANOVA analysiserence
illustrate that the
*
the dry seasonis dramatically di erent
to
that
in
the
wet
season
4). Indeed,
the to that
Dry
2015
Wet
2015
mean PI value in the
dry
season(Table
is-1.80467
dramatically
different
statistical results indicate the seasonal
change
s
were
very
distinct
in
2015
and
2016,
Dry
2016
.44
in the wet season (Table 4). Indeed, the statistical results indicate
-.56
acy Wet
ofwere
the2016
ANOVA
tool in reference
but not for2017. The results also indicate
thee changes
the seasonal
very
distinct
Dry
2017
.13 in 2015 and 2016, but not
to this study. Seasonal factors strongly
impact
water
quality
in
each
of theofstudied
for 2017. The resultsWet
also 2017
indicate the
efficacy
the ANOVA tool
-.51
*
areas (Sig.=0.000, α=0.05), which isinareference
bene
for
the management
ofimpact
the water
to this Dry
study.2016
Seasonal
factors strongly
2.24848
Wet 2015
*
water environment. A wide range quality
of parameter
s 1.24229
and
indications
of which is
Wet
2016
in each of concentration
the
studied
areas
(Sig.=0.000,
α=0.05),
*
Dry
1.93252
pollution at the monitoring stations awere
recorded
during
the
period
in of
question.
beneficial
finding
for the2017
management
the* waterThis
environment.
Wet
1.29110
indicates that the sources of pollutionAatwide
eachrange
sampling
site 2017
mayconcentrations
bedi
erent (Table
5).
of parameter
and indications
of
Dry 2016 Wet 2016 -1.00619*
pollution at the monitoring
stations
were
recorded
during
the
Dry 2017 -.32
*
Table 4 . Di erences in WQI value between
two seasons
the observed
period.of pollution at
period the
in question.
This over
indicates
that
the sources
Wet
2017
-.95738
Drybe
2017
2016
eachWet
sampling
site may
different.69
(Table 5).
Wet
2017 .05Interval
95%
Con
Fig. 4. PI of the Thi Vai river in 2015
Table 4 . Di erences in WQI value between the two seasons over the
95% Con
Lower Bound
-2.61
-0.30
-1.30
-0.69
-1.33
1.48
0.48
1.09
0.45
-1.71
-1.10
-1.74
-.09
-.73
Dry
Wet
-.64between the two seasons -1.50
Table
4. 2017
Differences
in 2017
WQI value
*.the
The
mean
disparity
at 0.05.
over
observed
period.
erence
(I
-J)
Lower
Boundis signi
Upper Bound
(I) Season
Dry 2015 Wet 2015 -1.80467*
-2.61
Fig. 4. PI of the Thi Vai river in 2016
Mean difference
Dry 2016 .44
-0.30
(I) Season
(I-J)
-1.30
Wet 2016 -.56
Dry 2017 .13
Wet 2015-0.69
-1.80467
Wet 2017 -.51
-1.33
Dry 2016
.44
Wet 2015 Dry 2016 2.24848* Dry 2015 Wet 20161.48-.56
Wet 2016 1.24229*
Dry 20170.48
.13
Dry 2017 1.93252*
Wet 20171.09
-.51
Wet 2017 1.29110*
Dry 20160.45
2.24848
Dry 2016 Wet 2016 -1.00619*
Wet 2016-1.71
1.24229
Wet 2015
Dry 2017 -.32
Dry 2017-1.10
1.93252
*
Wet 2017 -.95738
Wet 2017-1.74
1.29110
Wet 2016 Dry 2017 .69
Wet 2016-.09-1.00619
Wet 2017 .05
Dry 2016
Dry 2017-.73-.32
Dry 2017 Wet 2017 -.64
Wet 2017-1.50
-.95738
*. The mean disparity is signi
at 0.05. Dry 2017 .69
*
*
*
*
*
*
*
Wet 2016
Dry 2017
PI of the
Thi Vai
river into
2017.
Fig. 4. PI of the Thi Fig.
Vai4.river
from
2015
2017.
76
Vietnam Journal of Science,
Technology and Engineering
December 2018 • Vol.60 Number 4
-1.0095% Confidence interval
1.18
0.18 Lower bound Upper bound
0.95 -2.61
-1.00
0.30 -0.30
1.18
3.01 -1.30
0.18
2.01 -0.69
0.95
2.77 -1.33
0.30
2.13 1.48
3.01
-0.310.48
2.01
0.47 1.09
2.77
-0.180.45
2.13
1.47 -1.71
-0.31
.83 -1.10
0.47
.21 -1.74
-0.18
-.09
1.47
Wet 2017
.05
-.73
.83
Wet 2017
-.64
-1.50
.21
Environmental Sciences | Ecology
Table 5. The difference in WQI values between monitoring sites during
the observed period.
Mean
difference (I-J)
95% Confidence interval
Lower bound
Upper bound
TV2
-.38
-1.33
0.57
TV3
-.55
-1.51
0.40
TV4
-.45
-1.40
0.51
TV5
.28
-0.67
1.24
TV6
.82
-0.24
1.87
TV7
1.15432*
0.10
2.21
TV3
-.17
-1.13
0.78
TV4
-.07
-1.02
0.89
TV5
.66
-0.29
1.62
TV6
1.19614*
0.14
2.25
TV7
1.53432*
0.48
2.59
TV4
.107
-.847
1.062
TV5
.836
-.118
1.791
TV6
1.37114*
0.31
2.43
TV7
1.70932*
0.65
2.77
TV5
.73
-0.23
1.68
TV6
1.26364*
0.21
2.32
TV7
1.60182*
0.54
2.66
TV6
.53
-0.52
1.59
TV7
.87
-0.18
1.93
TV7
.34
-0.81
1.49
(I) Station
TV1
TV2
TV3
TV4
TV5
TV6
DO
TSS
COD
BOD5
NH4+-N
NO2--N
NO3---N
PO43--P
E Coli
Coliform
DO
1.000
.017
-.219
*
-.287
.112
-.527
-.115
-.111
-.279**
-.292**
-.529**
COD
-.219*
.315**
1.000
.912**
-.256**
.227*
-.321**
-.216*
-.120
-.121
.244*
BOD5
-.287**
.263**
.912**
1.000
-.200*
.309**
-.346**
-.131
-.125
-.121
.326**
NO2--N
-.527**
-.111
.227*
.309**
-.007
1.000
.220*
.034
.268**
.301**
.999**
NO3---N
-.115
-.153
-.321**
-.346**
.161
.220*
1.000
.228*
.377**
.439**
.218*
E Coli
-.279
.037
-.120
-.125
.418
.268
.377
.333
1.000
.932
**
.272**
Coliform
-.292
-.043
-.121
-.121
.412
.301
.270
.932
1.000
.305**
**
**
**
**
**
**
**
.439
**
**
**
**
The PI and statistical tools are effective and useful methods
for communicating information on, and managing, water quality,
both with regard to citizens and policymakers. The surface water
quality of the Thi Vai river can be clarified in the following
order: TV7>TV6>TV5>TV1>TV4>TV3>TV2. Furthermore, in
2015 and 2016, a strong difference between parameter in the dry
season and those in the wet season can be observed; in addition,
concentrations in the wet season were consistently higher than in
the dry season. This study also indicates the anthropogenic effects
of activities such as aquaculture industries and fish farming, which
are seen to be principal sources of pollution. Furthermore, the
efficacy of the Indonesian PI method is clear when assessing water
quality in the Thi Vai river. Based on investigation of PI results, it
can be concluded that effective treatment solutions and appropriate
management processes are urgently required to enhance the water
quality of the Thi Vai river.
REFERENCES
Table 6. Summarized correlation between PI and seven
physicochemical parameters.
**
Conclusions
The authors declare that there is no conflict of interest regarding
the publication of this article.
*The mean disparity is significant at 0.05.
**
declining NO2- concentrations and increasing DO are the urgent
issues.
PI
*Correlation is significant at the 0.05 level (2-tailed).
**Correlation is significant at the 0.01 level (2-tailed).
Statistical correlations between physicochemical parameters
and the PI
The correlation between PI and specific parameters is indicated
in Table 6. The main observation from this is the considerable
negative correlation between PI value and DO, at r=-0.53.
Considerable positive correlations can be observed between PI
values and COD, BOD, NO3-, E. coli, and coliform concentrations,
at r=0.24, 0.33, 0.22, 0.27, 0.31, respectively. In particular,
there was a strong positive correlation between PI and NO2concentration, at r=0.99, which indicates that NO2- concentrations
substantially impact PI value, followed by DO. Other parameters
had a low correlation with PI, because these showed good quality
and mostly met the required standards. Thus, it can be stated that
[1] J. Sebastian, S.M. Yamakanamardi (2013), “Assessment of water
quality index of Cauvery and Kapila Rivers and at their confluence”, Int.
J. Lakes Rivers, 6(1), pp.59-67.
[2] A. Tiria, L. Belkhiria, L. Mounib (2018), “Evaluation of surface
water quality for drinking purposes using fuzzy inference system”,
Groundwater for Sustainable Development, 6, pp.235-244.
[3] N. Chazanah1, P. Sudjono1, F.A. Hasby2, G. Suantika, B.S.
Muntalif1 (2017), “Development of bioassessment tools for ecological
status using macrozoobenthic community in upstream area (case study:
Citarum river, West Java, Indonesia)”, Journal of Water Resource and
Protection, 9, pp.770-785.
[4] Z. Wu, D. Zhang, Y. Cai, X. Wang, L. Zhang, Y. Chen (2017),
“Water quality assessment based on the water quality index method in
Lake Poyang: the largest freshwater lake in China”, Scientific Reports,
7(17999), pp.017-18285.
[5] M.T. Samadi, S. Sadeghi, A. Rahmani, M.H. Saghi (2015),
“Survey of water quality in Moradbeik river basis on WQI index by
GIS”, Environmental Health Engineering and Management Journal,
2(1), pp.7-11.
[6] I. Naubi1, N.H. Zardari, S.M. Shirazi, N.F.B. Ibrahim1, L. Balo
(2016), “Effectiveness of water quality index for monitoring Malaysian
river water quality”, Pol. J. Environ. Stud., 25(1), pp.231-239.
[7] M. Bora1, D.C. Goswami1 (2017), “Water quality assessment
in terms of water quality index (WQI): case study of the Kolong river
Assam, India”, Appl. Water Sci., 7, pp.3125-3135.
[8] H. Pham, Md.M. Rahman, N.C. Nguyen, Ph.L. Vo, Tr.L. Van,
H.H. Ngo (2017), “Assessment of surface water quality using the water
quality index and multivariate statistical techniques - a case study:
the upper part of Dong Nai river basin, Vietnam”, Journal of Water
Sustainability, 7(4), pp.225-245.
[9] M. Ibrahim, S.Al. Zyoud, E. Elhaddad (2018), “Surface water
quality monitoring for river Nile, Egypt using GIS-techniques”, Open
Journal of Geology, 8, pp.161-173.
[10] APHA (1999), Standard methods for the examination of water
and wastewater, American Public Health Association, Washington DC.
December 2018 • Vol.60 Number 4
Vietnam Journal of Science,
Technology and Engineering
77