Evaluation of hydrogeochemical and isotopic properties of the geothermal waters in the east of Mount Sabalan, NW Iran
Bạn đang xem bản rút gọn của tài liệu. Xem và tải ngay bản đầy đủ của tài liệu tại đây (3.68 MB, 13 trang )
Turkish Journal of Earth Sciences
Turkish J Earth Sci
(2017) 26: 441-453
© TÜBİTAK
doi:10.3906/yer-1705-11
/>
Research Article
Evaluation of hydrogeochemical and isotopic properties of the geothermal waters in the
east of Mount Sabalan, NW Iran
1,
1
1
2
Rahim MASOUMI *, Ali Asghar CALAGARI , Kamal SIAHCHESHM , Soheil PORKHIAL
1
Department of Earth Sciences, Faculty of Natural Sciences, University of Tabriz, Tabriz, Iran
2
Iranian Renewable Energy Organization, Tehran, Iran
Received: 13.05.2017
Accepted/Published Online: 09.11.2017
Final Version: 23.11.2017
Abstract: The Mount Sabalan district is regarded as the best place to investigate geothermal activities in northwest Iran. Since the last
episode of volcanic activity in the Plio-Quaternary time, hot springs and surficial steams as conspicuous manifestation of geothermal
activities have appeared around the slopes of Mount Sabalan. The hot fluids circulating in this geothermal field contains anions chiefly
of HCO3– and Cl–; however, SO42– content in some water samples is relatively high, imparting sulfate characteristics to such fluids.
Geothermometric studies provided compelling evidence for estimation of the reservoir temperature (~150 °C) in the study areas. Thus,
in this respect, the geothermal systems in the east of Mount Sabalan were categorized as high-temperature. The composition of stable
isotopes of oxygen (δ18O) and hydrogen (δD) indicated that the waters involved in this geothermal field have mainly meteoric origin. On
the basis of 3H isotopes, only a few water samples exhibited a residence time of ~63 years, which can be grouped as old waters.
Key words: Mount Sabalan, geothermal field, geothermometry, stable isotopes, residence time
1. Introduction
Geothermal research is used to identify the origin of
geothermal fluids and to quantify the processes that
govern their compositions and the associated chemical
and mineralogical transformations of the rocks with
which the fluids interact. The variation in the chemistry
of geothermal fluids provides information regarding the
origins, mixing, and flow regimes of the systems (Smith
et al., 2011). The subject has a strong applied component.
Geothermal chemistry constitutes an important tool for
the exploration of geothermal resources and in assessing
the production characteristics of drilled geothermal
reservoirs and their response to production. Geothermal
fluids are also of interest as analogues to ore-forming
fluids. Understanding chemical processes within active
geothermal systems has been advanced by thermodynamic
and kinetic experiments and numerical modeling of fluid
flow (Arnosson et al., 2007).
The Mount Sabalan district in the northwest of Iran
is a part of the Azarbaidjan block. From the geotectonic
point of view, this block is situated between the Arabian
and Eurasian plates (McKenzie, 1972; Dewey et al., 1973).
In fact, the Sabalan volcano is a part of a volcanic belt
stretching from the Caspian Sea in the east to the Black
Sea in the west (Neprochnov et al., 1970). The volcanic
*Correspondence:
activities along this belt are observed in various parts of
Armenia, Anatolia, and western Alborz.
The geothermal gradient in the young volcanic regions
is normally higher and shows thermal anomalies. This was
noted by various researchers in the early twentieth century
and many countries having such anomalously high
geothermal gradients in potential areas took measures
to harness such endless thermal energies accumulated
beneath the surface.
The areas around the Mount Sabalan volcano in
northwest Iran were geothermally active during the PlioQuaternary period (Alberti et al., 1976) and have higher
surficial thermal anomalies relative to the other parts of
the country. Thus these areas were recognized to be very
important and hence were regarded as the first priority for
exploiting the geothermal energy. The primary appearance
of geothermal systems including hot springs and surficial
steams in many areas around the Mount Sabalan is
indicative of widespread young subsurface magmatic
activities in this region.
The main objective of this study involves consideration
of hydrogeologic characteristics, chemical composition,
and isotopic aspects of the hot springs in the east of Mount
Sabalan with emphasis on lithologic units hosting the
geothermal fluids in this district. Since the geothermal
441
MASOUMI et al. / Turkish J Earth Sci
fields in this district were not investigated comprehensively,
the authors hope the results of this research will further
contribute to the recognition and assessment of these
fields.
2. Materials and methods
After implementing the primary geologic works like
identification of the lithologic units and determination of
tectonic occurrences in various areas, an accurate geologic
map of the district was prepared. Among the numerous
hot springs to the east of Mount Sabalan, those with higher
flow rate and temperature were chosen for sampling.
The temperature and electrical conductivity (EC) of the
water samples were directly measured in the field and
their HCO3– content was determined by titration. All
water samples were collected and kept in polypropylene
bottles and were used for laboratory experiments such
as quantitative analysis of cations, anions, rare elements,
and stable isotopes. The prepared samples were first
passed through 0.45-µm filters and treated with 1% of
concentrated HNO3 to prevent precipitation of cations and
rare elements.
In the present study, the chemical and stable isotope
(δ18O and δD) analyses were carried out in G.G. Hatch stable
isotope laboratory (Gasbench + DeltaPlus XP isotope ratio
mass spectrometer, ThermoFinnigan, Germany) at Ottawa
University, Canada. The chemical analyses were done using
ICP-MS in ACME Analytical Laboratories Ltd, Canada.
Still some more samples were analyzed for δ18O and δD
in the hydrogeologic labs at Berman University, Germany.
The precision of the measurements for δ18O was ±0.2‰
and for δD ±1‰. The main cations including Mg, Ca, K,
Na, and Si were analyzed by ICP-OES (PerkinElmer) and
the main anions such as Cl–, F–, and SO42– were measured
by ion chromatography using an IC-Plus Chromatograph
(Metrohm).
The 3H values were measured in terms of tritium unit
(TU), where 1 TU = ([T]/[H]) × 1018 (IAEA, 1979).
3. Results and discussion
The study district encompasses the eastern part of the
Mount Sabalan strato-volcano and its geology was
influenced by the Sabalan volcanic activities with calcalkaline nature. The volcanic rocks in this district
vary in composition from andesite through dacite to
scarcely rhyolite (Dostal and Zerbi, 1978). The volcanosedimentary rocks (agglomerate, lahar, and tuff) are the
major lithologic units in this district covering the older
sediments. Glacial moraines are also present in some
localities. The agglomerate and lahar were likely deposited
synchronously with explosive volcanic activities during
the glacial period. In the Sarein and Viladara areas, there
are many hot springs within these rocks. In the north of
442
the district, the dominant lithologic units are trachyandesitic, dacitic, and basaltic lavas with porphyry texture
manifested by plagioclase and occasionally pyroxene and
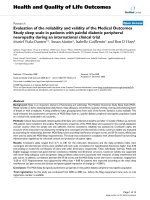
amphibole phenocrysts (Figure 1) (Haddadan and Abbasi
Damani, 1997). The hot springs in the Sardabeh area are
discharging through these lithologic units. Around the hot
springs in the Sardabeh area massive silica (principally of
chalcedony and opal) accumulations (silica sinters) were
formed with thicknesses up to about 300 m. The south of
the district was covered by 15-m-thick porous limestone,
which was likely deposited in a freshwater lacustrine
environment. In addition, Quaternary alluvial sediments
were also observed in this part.
Tectonically, numerous faults and fractured zones
developed in this district. The major faults passed through
the Sarein and Sardabeh areas (with NW–SE trend) and
played a crucial role in the development of surficial hot
springs. In the southern part of the district, there are some
folded zones with an overall NE–SW trending. It appears
that these tectonic occurrences were influenced by the last
volcanic activities of Mount Sabalan and to some extent
control the geothermal systems in this district.
3.1. Hydrogeochemistry
Hydrogeochemistry is an indispensable unit of
hydrogeological studies because it aids in the determination
of chemical properties as well as the overall qualities of
groundwater, including their genesis and relationship with
surface and rain waters. Therefore, it is an important part
of geothermal research programs (Tarcan, 2002).
So far, little work on geothermal fluids has been carried
out to the east of Mount Sabalan, and most of the previous
studies were done on geothermal activities in other areas
around Mount Sabalan (Masoumi et al., 2016, 2017a,
2017b, 2017c). Despite the lack of deep diamond drilling
data, the important subjects such as hydrogeochemical
characteristics of the fluids, isotopic issues, geologic
conditions governing the geothermal reservoirs, lithologic
compositions, and fluid-feeding localities in the study area
merit more detailed investigations.
Hydrogeochemical studies were reckoned to be the
most suitable method to consider the potential geothermal
characteristics of the district with the aim of approaching
to applicable geothermal energy. The data obtained from
chemical (major cations and anions, rare and heavy
elements), stable (δ18O and δD), and radioactive isotope
(3H) analyses, and physico-chemical characteristics
(temperature, pH, TDS, EC, and hot springs flow rate) are
listed in Tables 1 and 2.
From the physico-chemical point of view, the hot
springs in the Sabalan region demonstrate characteristics
of surficial geothermal fluids (acid-sulfate waters), and the
physico-chemical parameters of these hot waters vary in a
wide range. Thermally, the maximum temperatures at the
MASOUMI et al. / Turkish J Earth Sci
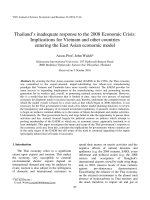
Figure 1. (a) An index map showing the position of the study district in the northwest of Iran. (b) Geologic map of the geothermal
field to the east of Mount Sabalan. (c) Geological cross section in NW–SE direction (A–B).
point of discharge belong to hot springs in the Sarein area
(~53 °C) and the minimum to those in the Villadara area
(~20 °C).
These waters in light of acidity (pH) display notable
changes, so that the minimum pH values belong to those in
the Sardabeh area (4.5–8.8, mean of 5.2) and the maximum
values to those in the Sarein area (5.3–6.6, mean of 5.9).
These values compared to the waters derived from
melted snow in the region (pH = 7.2) or even to waters
in small lake in the Sabalan caldera (pH = 8.2) show a
remarkable decrease in pH. The release of proton (H+)
during the reaction of
H2S(g) + 2O2(aq) = 2H+(aq) + SO42–(aq) accounts for the low
pH and hence the acidic nature of these waters (Nicholson,
1993).
The measured total dissolved solutes (TDS) in
geothermal waters in this region exhibit a direct
relationship with the temperature of these hot springs, so
443
444
Viladara
Viladara
Viladara
Viladara
ES27
ES28
ES29
ES30
Yeddiboloug
Viladara
ES25
ES26
Yeddiboloug
Yeddiboloug
ES23
ES24
Sardabeh
Yeddiboloug
ES21
ES22
Sardabeh
Sardabeh
ES19
Sardabeh
ES18
ES20
Sardabeh
Sardabeh
ES16
ES17
Sardabeh
Sardabeh
ES14
ES15
Sardabeh
Sardabeh
ES12
ES13
Sarein
Sarein
ES10
ES11
Sarein
Sarein
ES8
Sarein
ES7
ES9
Sarein
Sarein
ES5
ES6
Sarein
Sarein
ES3
ES4
Sarein
Sarein
ES1
ES2
Sampling
stations
Sample
ID
430
390
288
369
275
ˉ
ˉ
ˉ
ˉ
ˉ
ˉ
ˉ
ˉ
ˉ
777
510
891
876
830
ˉ
ˉ
ˉ
ˉ
ˉ
910
910
277
396
936
1016
TDS
mg/L
642
582
430
551
410
ˉ
ˉ
ˉ
ˉ
ˉ
ˉ
ˉ
ˉ
ˉ
1160
761
1330
1307
1239
ˉ
ˉ
ˉ
ˉ
ˉ
1358
1358
413
591
1397
1516
1795
1850
1830
1840
1850
1940
1950
1930
1970
1915
1934
1966
1907
1890
1900
1945
1930
1910
1900
1670
1690
1685
1685
1676
1650
1620
1620
1620
1670
1670
EC
Elev
μS/cm (m)
30
6
15
600
400
25
30
45
60
15
60
25
20
10
3
3
150
60
-
60
45
30
25
60
45
50
4
30
80
600
23
20
22
22
21
32
36
34
35
28
35
27
33
34
22
22
37
36
36
46
45
45
44
53
52
52
26
25
53
50
6.2
5.9
6.3
5.5
5.8
4.6
4.7
5.1
4.9
5.0
4.7
8.8
4.6
4.7
4.5
6.5
4.8
4.6
4.5
6.1
6.0
6.1
6.2
5.9
6.3
6.6
5.6
5.4
6.0
5.3
Flow rate T
pH
(L/min) (°C)
32
25
12
23
14
23
23
23
26
22
25
0.03
24
23
20
15
22
23
21
200
200
198
202
202
240
172
13
19
191
179
8.6
6.6
2.0
7.0
3.1
6.8
6.8
7.0
6.6
6.7
6.8
0.0
7.0
6.8
6.3
2.5
7.0
6.3
6.6
35.0
34.9
34.6
34.6
36.7
40.0
34.8
2.5
3.8
36.0
39.1
19.4
17.4
17.3
17.2
17.5
17.5
ˉ
20.7
9.8
10.9
18.2
9.6
0.6
56.0
54.0
46.0
54.0
48.0
13.4
13.4
12.0
14.6
12.0
183.2 8.3
181.1 8.1
185.0 8.1
170.5 8.2
177.1 9.7
198.8 9.3
0.1
178.0 8.6
172.3 8.6
170.0 8.7
92.0
180.0 9.2
174.0 8.6
184.0 9.5
69.2
69.0
68.9
68.6
73.0
75.0
72.0
42.0
46.0
72.0
70.0
ˉ
1.10
1.10
0.54
0.01
0.10
0.01
0.07
0.01
0.00
0.01
0.05
0.01
0.02
0.15
1.10
0.05
0.02
ˉ
0.03
0.01
0.00
0.00
0.10
ˉ
1.86
1.10
0.05
3.16
2.42
6.0
4.0
4.0
5.0
3.0
ˉ
ˉ
ˉ
ˉ
ˉ
6.0
0.0
ˉ
ˉ
4.0
ˉ
2.0
2.0
6.0
ˉ
ˉ
ˉ
3.0
214.0
194.0
209.0
5.0
11.0
209.0
199.0
Na
K
Ca
Mg
Fe
Cl–
mg/L mg/L mg/L mg/L mg/L mg/L
ˉ
0.1
0.4
0.5
0.5
ˉ
ˉ
ˉ
ˉ
ˉ
ˉ
ˉ
ˉ
ˉ
0.4
0.6
0.4
0.5
ˉ
ˉ
ˉ
ˉ
ˉ
ˉ
ˉ
ˉ
0.4
0.4
0.3
0.4
F–
mg/L
37.0
35.0
12.0
44.0
37.0
ˉ
6.5
ˉ
6.5
ˉ
ˉ
ˉ
ˉ
ˉ
442.0
231.0
528.0
480.0
480.0
ˉ
ˉ
ˉ
3.4
ˉ
170.0
96.0
48.0
58.0
96.0
96.0
SO4–2
mg/L
299
256
195
250
183
ˉ
ˉ
ˉ
ˉ
ˉ
ˉ
ˉ
ˉ
ˉ
28
79
35
16
33
ˉ
ˉ
ˉ
ˉ
ˉ
ˉ
329
134
140
415
439
118.0
106.0
84.0
98.0
79.0
37.5
38.1
36.5
35.8
38.4
36.0
27.7
38.3
37.7
68.0
56.0
81.0
84.0
85.0
47.9
47.5
46.6
46.7
44.9
60.0
103.0
78.0
73.0
105.0
98.0
HCO3– SiO2
mg/L
mg/L
3.7
1.9
5.0
1.0
2.4
8.6
4.5
ˉ
ˉ
ˉ
1.8
0.9
0.7
ˉ
7.4
14.7
1.9
1.2
0.5
13.4
9.8
ˉ
ˉ
5.7
12.1
8.5
19.5
13.5
1.5
1.3
3
H
TU
–11.5
–12.8
–10.8
–11.5
–11.8
–12.1
–10.0
ˉ
ˉ
ˉ
–11.6
–10.2
–10.7
ˉ
–11.6
–12.0
–11.9
–12.5
–11.4
–11.1
–10.1
ˉ
ˉ
–11.1
–11.2
–11.2
–12.4
–13.4
–11.2
–13.4
δ18O
‰
ˉ
–74.6
ˉ
–74.4
ˉ
–80.2
–68.4
ˉ
ˉ
ˉ
–75.0
–68.9
–74.8
ˉ
ˉ
ˉ
–74.9
–74.9
ˉ
–78.6
–75.8
ˉ
ˉ
–76.1
ˉ
ˉ
–74.8
–74.7
–74.3
–75.8
δD
‰
Table 1. Physico-chemical parameters, chemical analyses, and isotopic composition data for the selected hot spring water samples from geothermal field to the east of Mount
Sabalan. The sign (–) stands for lack of analytical data.
MASOUMI et al. / Turkish J Earth Sci
MASOUMI et al. / Turkish J Earth Sci
Table 2. Concentration values of trace elements for the selected hot spring water samples from geothermal field to the east of Mount
Sabalan. The sign (–) stands for lack of analytical data.
Sample ID
Sampling
stations
Li
mg/L
Ba
mg/L
Rb
mg/L
Sr
mg/L
Cs
mg/L
B
mg/L
As
mg/L
Se
mg/L
Hg
mg/L
Al
mg/L
ES1
Sarein
0.97
0.12
0.41
0.21
0.31
2.10
-
-
0.0081
-
ES2
Sarein
0.47
1.50
0.35
0.24
1.05
1.90
-
-
0.0005
-
ES3
Sarein
0.03
1.50
0.02
0.10
0.01
0.20
-
-
0.0015
-
ES4
Sarein
0.01
1.50
0.02
0.07
0.05
-
-
-
0.0005
-
ES5
Sarein
0.97
-
0.25
0.30
-
7.00
-
-
ˉ
-
ES6
Sarein
-
-
-
0.30
-
-
ˉ
-
ˉ
-
ES7
Sarein
0.87
1.60
0.27
0.07
1.29
2.30
0.15
2.3
0.1000
0.01
ES8
Sarein
0.97
0.06
0.24
0.57
-
2.05
0.12
76.2
ˉ
0.01
ES9
Sarein
0.93
0.06
0.23
0.56
-
2.45
0.1
65.7
ˉ
0.01
ES10
Sarein
0.97
0.06
0.22
0.58
-
2.33
0.12
170.2
ˉ
0.01
ES11
Sarein
0.97
0.06
0.24
0.58
-
2.24
0.14
102.2
ˉ
0.01
ES12
Sardabeh
-
-
-
0.27
-
0.10
-
-
-
-
ES13
Sardabeh
0.01
1.50
0.04
0.20
0.06
2.80
-
-
0.0050
-
ES14
Sardabeh
0.02
1.50
0.02
0.39
-
-
-
-
0.0006
-
ES15
Sardabeh
-
0.18
0.01
0.26
0.06
2.80
-
-
0.0050
-
ES16
Sardabeh
0.02
1.50
0.02
0.33
-
0.40
-
-
0.0006
-
ES17
Sardabeh
0.02
0.02
0.03
0.32
-
0.77
0.06
0.05
ˉ
0.15
SS18
Sardabeh
0.02
0.02
0.04
0.32
-
0.78
0.06
6.05
ˉ
0.13
ES19
Sardabeh
0.01
0.05
5.37
2.90
2.30
0.99
0.05
0.50
0.0100
0.15
ES20
Sardabeh
0.05
0.17
0.06
0.33
1.42
0.59
0.17
0.50
0.1000
0.14
ES21
Sardabeh
0.02
0.02
0.05
0.31
-
0.10
0.08
0.05
ˉ
0.05
ES22
Yeddiboloug
0.02
0.01
0.03
0.35
-
0.52
0.05
0.05
ˉ
0.12
ES23
Yeddiboloug
0.02
0.01
0.05
0.37
-
0.73
0.06
0.05
ˉ
0.13
ES24
Yeddiboloug
0.02
0.01
0.04
0.37
-
0.28
0.07
5.32
ˉ
0.16
ES25
Yeddiboloug
0.02
0.01
0.04
0.33
-
0.23
0.04
0.05
ˉ
0.12
ES26
Viladara
0.01
1.50
0.01
0.36
0.02
0.10
-
-
0.0015
-
ES27
Viladara
0.03
1.50
0.04
0.57
0.01
0.10
-
-
0.0004
-
ES28
Viladara
-
1.50
0.01
0.10
0.04
0.10
-
-
0.0015
-
ES29
Viladara
0.02
1.50
0.06
0.14
0.07
-
-
-
0.0005
-
ES30
Viladara
-
-
-
0.20
-
-
-
-
ˉ
-
ES31
Snow water
-
0.02
0.03
0.13
-
0.33
0.04
0.05
ˉ
0.62
that the maximum measured TDS belongs to samples from
the Sarein area (TDS = 1016 mg/L) and the minimum to
those from the Viladara area (TDS = 275 mg/L).
The origin and chemical history of hydrothermal
fluids can be explored in a Cl, SO4, and HCO3 ternary
diagram (Chang, 1984; Giggenbach, 1991; Nicholson,
1993; Giggenbach, 1997). Based on their position in the
diagram, hydrothermal waters can be divided into neutral
chloride, acid sulfate, and bicarbonate waters, but mixtures
of the individual groups are common.
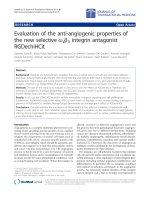
According to Figure 2, samples belonging to hot springs
in this region demonstrate relatively different composition.
Compositionally, the samples from the Sardabeh, Viladara,
and Sarein areas chiefly contain sulfate, bicarbonate, and
bicarbonate–chloride anions, respectively. In fact, their
compositions are related to peripheral waters, HCO3–,
SO42–, and diluted Cl–.
The comparison of the concentration values of
cations and anions in geothermal waters to the east of
Mount Sabalan is shown in the diagram presented by
445
MASOUMI et al. / Turkish J Earth Sci
Figure 2. Ternary plot of HCO3–SO4–Cl for the geothermal fluids to the east of Mount Sabalan.
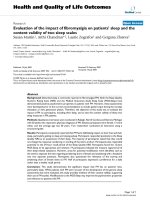
Schoeller (1962) (Figure 3). According to this diagram
the concentration values of cations and anions in the hot
springs representing the three above-mentioned areas
are not similar and show different distribution patterns.
However, an overall trend for cations like Ca2+ > Na+ >
K+ > Mg2+ and for anions like SO42– > HCO3– > Cl– can be
observed (Figure 3)
Concentration in Meq/L
100.00
Sarein
Viladara
Among the cations, Na+ (240 mg/L) and Ca2+ (198
mg/L) have the highest concentration values. The hot
springs in the Sarein area contain the highest Na+ content.
The highest Ca2+ content belongs to the hot springs in
the Sardabeh and Yeddiboloug areas. The maximum
concentration values for K and Mg are 40 mg/L and 20
mg/L, respectively.
Sardabeh
10.00
1.00
0.10
0.01
Na
K
Ca
Mg
Cl
Major Cations and Anions
SO4
HCO3
Figure 3. Concentration variations of major cations and anions for the geothermal water
samples to the east of Mount Sabalan.
446
MASOUMI et al. / Turkish J Earth Sci
Among the major anions, the maximum concentration
values of the sulfate (SO42– = 528 mg/L) and bicarbonate
(HCO3– =439 mg/L) belong to samples from the Sardabeh
and Sarein areas, respectively. Chloride ion (Cl–), relative to
the other two, has a lower concentration, with a maximum
value of 214 mg/L in the Sarein area.
The silica content of the geothermal fluids to the east of
Mount Sabalan displays a wide range (27–118 mg/L) and
the maximum values belong to the springs in the Viladara
(118 mg/L) and Sarein (105 mg/L) areas.
Among the trace elements, the highest values belong
to selenium, ranging from 0.05 mg/L to 170 mg/L. The
water samples from the Sarein area possess the highest
Se concentration (170 mg/L), which is very high in
comparison with crustal rocks (0.05–0.09 mg/L) and
normal fresh waters (0.2 mg/L) (Wetang’ula, 2004). This
high Se content in the geothermal fluids can be justifiable
as its main source in nature, analogous to sulfur (having
similar geochemical behavior), is the volcanic rocks
(ATSDR, 2001).
Although Se, due to its similar behavior to sulfur, can
concentrate in hydrothermal fluids, the anomalously high
Se content in certain samples seems to be rather abnormal.
Despite careful sampling, the occurrence of errors during
the sampling and laboratory stages cannot be ruled out.
Boron in various geothermal systems shows different
concentration values, which are influenced by enclosing
lithologic units. Einarsson et al. (1975) reported the boron
content of geothermal fluids in Ahuachapán area (El
Salvador) ~150 mg/L, but its concentration is very low
(within the range of 0.1–6.6 mg/L) in high-temperature
geothermal systems within basalts of the volcanic belt
in Iceland (Arnórsson and Andrésdóttir, 1995). The
high boron values in most geothermal systems have
been attributed to the existing B-rich sedimentary and/
or metamorphic units in the reservoirs (Smith, 2001).
Nevertheless, the geothermal waters hosted by basaltic
rocks have low boron content. In the study district, the
maximum boron concentration value belongs to the hot
springs in the Sarein area (7 mg/L). Furthermore, water
samples from the Sardabeh and Viladara areas have boron
contents of 2.8 mg/L and 0.1 mg/L, respectively. Therefore,
the concentration values of this element in the geothermal
systems of the east of Mount Sabalan range from 0.1 mg/L
to 7 mg/L, which are compatible with volcanic facies of
corresponding systems in other parts of the world.
Arsenic enrichment in geothermal systems occurs
predominantly near the surface, along with other
epithermal elements such as Sb, Au, and Hg (White, 1981).
The arsenic content of the geothermal waters in the
east of Mount Sabalan varies from 0.04 mg/L to 0.17 mg/L.
The average concentration of As in worldwide geothermal
systems has a range of 0.1–10 mg/L, while its permissive
standard limit in drinkable waters is ~0.01 mg/L. Therefore,
the range of concentration variation of As to the east of
Mount Sabalan (0.04–0.17 mg/L) is comparable with the
world’s important geothermal systems. Ellis and Mahon
(1964) perceived that the principal source of arsenic in
geothermal systems could be the host rocks from which
this element was derived by leaching processes. They also
asserted that from unmineralized andesitic host rocks
about 1.3 mg/L arsenic can be released into geothermal
systems.
3.2. Geothermometry
Geothermometers enable the temperature of the reservoir
fluid to be estimated. They are therefore valuable tools
in the evaluation of new fields and in monitoring the
hydrology of systems on production (Nicholson, 1993).
The
basic
assumptions
underlying
most
geothermometers are that ascent of deeper, hotter waters
(and the accompanying cooling) is fast enough such that
kinetic factors will inhibit re-equilibration of the water,
and minimal mixing with alternate water sources occurs
during ascent; it should be noted that compliance with
these assumptions is often “exceedingly difficult to prove”
(Ferguson et al., 2009; Smith et al., 2009).
Only 13 of all analyzed samples were recognized
to be suitable for geothermometric calculations and a
great number of samples for various reasons were not
qualified for geothermometric purposes. The analyzed
samples (ES12-21) having sulfate ion (SO42–) derived
from near surface water–rock reactions because of mixing
with surface waters cannot represent deep fluids and are
inapplicable for geothermometric purposes (Nicholson,
1993). Similarly, some other analyzed samples (ES2630), despite having bicarbonate (HCO3–) content, because
of having low temperature (as the result of mixing with
surficial waters) were omitted from the list of samples
chosen for thermometry.
To determine the reservoir temperature of the
geothermal field to the east of Mount Sabalan, the
geothermometry was done on the basis of certain cations
and the results are presented in Table 3.
The calculations were done according to methods
presented by Fournier (1977, 1979), Fournier and Truesdell
(1973), and Kharaka et al. (1982). The geothermometry of
cations (Na–K, Na–Li, and Na–K–Ca) is on the basis of
exchange reactions. The estimated reservoir temperatures
using the above-mentioned methods (Table 3) are
different. In general, the temperatures obtained from silica
and Na–K–Ca methods are lower than those acquired by
Na–Li and Na–K methods. The estimated temperatures
obtained on the basis of the silica method (Fournier, 1977)
range from 118 °C to 170 °C.
As mentioned above, the silica geothermometry is
based upon solubility of quartz and chalcedony and is
447
MASOUMI et al. / Turkish J Earth Sci
Table 3. Results of the solute-based geothermometries for the fluids from the geothermal field to the east of Mount Sabalan.
Sample ID
Station ID
Silica
(Fournier, 1977)
Na–K–Ca
(Fournier and Truesdell, 1973)
Na/K
(Fournier, 1979)
Na/Li
(Kharaka et al., 1982)
ES1
Sarein
170
189
242
249
ES2
Sarein
163
181
229
225
ES5
Sarein
161
184
235
252
ES6
Sarein
142
174
218
-
ES7
Sarein
130
179
225
247
ES8
Sarein
125
175
220
240
ES9
Sarein
124
177
222
238
ES10
Sarein
137
177
222
240
ES11
Sarein
140
177
222
240
ES22
Yeddiboloug
120
182
255
134
ES23
Yeddiboloug
118
188
271
139
ES24
Yeddiboloug
121
188
272
140
ES25
Yeddiboloug
122
188
270
140
widely used for estimation of subsurface temperatures.
The solubility of quartz and chalcedony varies with
temperature and pressure changes. At temperatures <300
°C the effect of pressure on the solubility of quartz and
other silica polymorphs decreases. In fact, at temperatures
>120–180 °C the silica solubility is controlled by quartz.
Therefore, this method provides better results within
the temperature range of 150–250 °C (Gendenjamts,
2003). At lower temperatures the other silica phases (i.e.
chalcedony) control the concentration of silica in the
solution (Fournier, 1977). In contrast, the results obtained
from Na–K geothermometry unveiled a temperature range
of 218–272 °C, which are similar to those acquired by the
Na–Li method (samples Es1–10). In high-temperature
geothermal systems (>150 °C) the Na–K geothermometry
is influenced by other minerals such as clay minerals
(Nicholson, 1993).
Considering the ternary plot of HCO3–SO4–Cl (see
Figure 2) and other evidence concerning the geochemical
parameters, there is much possibility of mixing surface
waters with the ascending hydrothermal fluids in this
geothermal field. Since the silica geothermometer is so
sensitive to the mixing, the results obtained from this
geothermometer in the studied samples are not very
reliable and the temperatures estimated on the basis of this
geothermometer show lower values in comparison with
the other geothermometers (Table 3).
Although Khosrawi (1996) classified geothermal
waters in the study district as immature waters by using
the diagram of Na–K–Mg (Giggenbach, 1988) and this
clearly points to the fact that the geothermometry of
448
these waters is not suitable for this purpose, it is suitable
for estimation of the temperature of the reservoir, which
categorized Mount Sabalan’s geothermal systems as hightemperature (>150 °C).
3.3. Isotopic characteristics
It has long been recognized that chemical and isotopic
compositions are important tools for studying the origin
and history of geothermal waters (Young and Lewis,
1982). Hydrogen, oxygen, and carbon isotopes play
particularly important roles in determining the genesis
of thermal waters and when studying the hydrodynamics
of geothermal systems. These parameters are also
important in identifying mixing processes between cold
and thermal water, tracing groundwater movement, and
also in estimating the relative ages of thermal waters
(Sveinbjörnsdóttir et al., 2000; Wangand Sun, 2001; Chen,
2008). Craig (1961) observed that δ18O and δD values of
precipitation that has not been evaporated are linearly
related by δD = 8δ18O + 10. However, the equation of mean
local precipitation slightly differs from that of the world’s
precipitation as determined to be δD = 6.89δ18O + 6.57
by Shamsi and Kazemi (2014) (Figure 4). The measured
δ18O, δD, and 3H values for hot springs to the east of
Mount Sabalan are listed in Table 1. As can be observed
in this table, the δ18O and δD values vary from –9.96‰
to –13.4‰ and from 68.37‰ to 80.19‰, respectively.
According to Figure 4, most of the data points lie between
GMWL and NMWL (National Meteoric Water Line)
lines. In fact, the maximum oxygen shift, which resulted
from fluid–reservoir rock interactions (Truesdell and
Hulston, 1980), is about 5‰. This indicates that the
MASOUMI et al. / Turkish J Earth Sci
40
δD (‰)
0
Sarein
Sardabeh
Yeddiboloug
Viladara
SMOW
-40
Magmatic
Waters
-80
Water-rock interactions
-120
-20
-10
δ18 O (‰)
0
10
Figure 4. Bivariate plot of δ18O versus δD values for the selected cold and hot spring water samples
in the east of Mount Sabalan. Shown on this figure are also the national meteoric water line (NMWL)
(Shamsi and Kazemi, 2014) and global meteoric water line (GMWL) (Craig, 1961).
enrichment of these waters in δ18O is low. In fact, the
δ18O of meteoric waters can be increased by water–rock
exchange reactions, mixing with magmatic waters, or
a combination of the two (Craig, 1966; Gokgoz, 1998;
Ohbaetal., 2000; Varekamp and Kreulen, 2000; Purnomo
and Pichler, 2014). Therefore, the low δ18O values of
these waters can be attributed to the surficial meteoric
waters but it should be noted that factors such as altitude,
geographic latitude, and distance from sea can affect the
δ18O values. Under such conditions and because of the
high precipitation rate relative to evaporation in this
district, dilution of δ18O is justifiably conceivable. On
the other hand, since the sampling was carried out in the
wet season and because of the likelihood of mixing with
meteoric waters, this may be another logical reason for
the low δ18O values. The overall δ18O data illustrated that
the magmatic isotopic signature for these hot springs to
the east of Mount Sabalan is negligible, and as can be seen
in Figure 4 the data points have a great distance from the
magmatic fluid box.
As is observed in Table 1, the δD values in most
samples are about –74‰, but in certain samples like
ES11, Es13, and Es14 the values are –68‰, –68‰, and
–80‰, respectively, which can be regarded as slight
deuterium shift. Ellis and Mahon (1977) stated that
since most of rocks contain small amounts of hydrogen,
relative to water, the direct water–rock interaction cannot
be considered an agent for deuterium shift, and only in
cases in which there exist considerable clays and micas
(hydrogen-bearing minerals) in the environment can
hydrogen exchange take place to some extent.
Since 3H (half-life = 12.4 years) is an excellent tracer
for estimation of temporal range of water flow and
potential mixing and is also regarded as geochemically
relatively conservative, it is normally used for studies of
residence time <100 years (Kendall and Doctor, 2005). Gat
(1980) proved that after nuclear bomb testing in 1953 the
3
H values remarkably increased in the atmosphere. The 3H
< 1TU in waters indicates that they entered their present
environment of residence before 1953 (Mazor, 1991; Güleç
and Mutlu, 2002). The 3H values of the geothermal waters
to the east of Mount Sabalan are listed in Table 1 and vary
from 0.5 TU to 14.7 TU.
Tritium–chloride relationship is a method used
for separating shallowly and deeply circulating waters
(Çelmen and Çelik, 2009; Bozdağ, 2016).
According to Figure 5, only two samples show values
<1 TU and six others have values of approximately 1 TU.
Therefore, it may suggest that the samples having 3H values
around 1 TU represent deep circulation while those being
<1 TU have indication of surficial waters.
The bivariate plot of δ18O versus 3H can be used for
estimation of residence time of waters in geothermal
systems (Figure 6). Waters having 3H < 1 TU have
residence time older than 1953 (Clark et al., 1997) while
values >1 TU are regarded as submodern and modern
waters. Ravikumar and Somashekar (2011) and Alçiçek et
al. (2016) stated that tritium values varying from 1 to 8
TU are interpreted as an admixture of recent water with
old groundwater and groundwater having been subjected
to radioactive decay. According to Figure 6 most of the
water samples from the east of Mount Sabalan lie in the
“submodern waters” field.
449
MASOUMI et al. / Turkish J Earth Sci
Sarein
Sardabeh
Yeddiboloug
Viladara
Tritium (TU)
100
10
Shallow circulation
1
Deep circulation
0.1
0.01
0.1
1
10
100
1000
Cl (mg/l)
Figure 5. Bivariate plot of Cl– versus 3H for the selected hot spring water samples to the
east of Mount Sabalan.
100
Tritium (TU)
Modern waters
10
Sarein
Sardabeh
Yeddiboloug
Viladara
SubModern waters
1
Old waters
0.1
-15
-10
18
δ O (‰)
-5
Figure 6. Bivariate plot of δ18O versus 3H for the selected hot spring water samples to the
east of Mount Sabalan.
4. Conceptual model
The reservoir rocks of the geothermal system to the
east of Sabalan consist generally of volcanic units
that suffered intense fracturing imposed by tectonic
stresses. The fracturing provided suitable secondary
permeability and facilitated the upward migration of
high-temperature geothermal fluids (Figure 7). The
high-temperature chloride-bearing ascending fluids
reach the surface as geothermal springs in the Sarein
area. There are also hot spring waters of carbonate
composition generated from condensation of the
ascending CO2-rich vapors by low-ƒO2 underground
waters in this area (Nicholson, 1993).
450
In the northern parts of the studied areas (the Sardabeh
and the Yadibolagh), the compositions of the spring waters
are different, and have chiefly acid-sulfate composition
(Figure 7) resulting from oxidation of sulfides by highƒO2 underground waters (Nicholson, 1993). Based upon
geothermometric calculations, the geothermal reservoirs
in these areas have a temperature range of 150–250 °C.
Field observations along with examination of satellite
images revealed that the principal feeding areas are located
around the Sabalan caldera, which is covered constantly by
glaciers and snow throughout the year. The melted waters
in these areas percolate deep into the ground through the
existing numerous fault zones around the caldera.
MASOUMI et al. / Turkish J Earth Sci
Figure 7. Conceptual model of Eastern Sabalan geothermal field showing the lithological composition
of the reservoir, geothermal water types, and the reservoir thermal condition.
5. Conclusions
The most important results obtained from this study are
as follows:
1- Geological considerations east of Mount Sabalan
indicate that the calc-alkaline volcanic-sedimentary
units constitute the great volume of the geothermal
reservoir in the study district. The rocks that suffered
argillic alteration acted as cap rocks for this reservoir. In
some localities in the study district siliceous (chalcedony
and opal) sinters developed around the orifice of the hot
springs. Tectonically, the NW–SE trending faults played an
important role in the development of these hot springs.
2- The geothermal fluids in the study district, in terms
of physico-chemical parameters, have characteristics that
differ from those of other geothermal fields around
Mount Sabalan, particularly in the southern and
northwestern districts. These differences are: (a) the
measured pH values of the geothermal fluids range from
approximately 4.5 to 8.8, signifying a variation from
acidity to alkalinity; (b) the measured TDS values of
these waters, in comparison with the average TDS values
for most types of geothermal systems, are low and the
minimum values were recorded in the Viladara area; (c)
estimations of concentration values of anions and cations
in the selected spring water samples indicate that they
have chiefly chloride and bicarbonate anions; however,
samples from the Sardabeh area contain relatively high
sulfate (SO42–) content.
451
MASOUMI et al. / Turkish J Earth Sci
3- The concentration values of trace elements in these
waters are notable. Selenium has the highest concentration
value (170 mg/L) among the rare elements, and considering
its similarities in geochemical behavior with sulfur and
besides volcanic activities are the principal source of
selenium, the high selenium content in these waters can be
justifiable. The maximum concentration values of boron
and arsenic were measured to be 7 mg/L and 10 mg/L,
respectively. The rest of the rare elements have relatively low
concentration values in the studied samples.
4- The calculation of solute-based geothermometry was
done on the basis of Na–Li, Na–K, Na–K, Ca, and silica for
the water samples. The results of all these procedures for
estimation of temperature of the geothermal reservoir to
the east of Mount Sabalan were very close to one another.
Nevertheless, the temperatures determined by the Na–Li
and Na–K geothermometric methods are 225 °C and 239 °C,
respectively, while by Na–K–Ca and silica methods they are
181 °C and 136 °C, respectively, for the geothermal reservoir.
5- Consideration of hydrogen and oxygen stable isotopes
(δ18O and δD) of the geothermal fluids to the east of Mount
Sabalan revealed that their δD and δ18O values vary from
–63.37‰ to –80.19‰ and from –9.96‰ to –13.4‰,
respectively. The bivariate plot of δ18O versus δD shows
that the data points mainly lie between lines GMWL and
NMWL, indicating that the great portion of these waters
have meteoric origin and the role of magmatic waters is
almost negligible.
6- Consideration of radioactive isotope of 3H
delineated that the average 3H content of these waters is 5.1
TU. Illustration of diagrams of tritium–δ18O and tritium–
Cl– showed that most of these waters are categorized as
“submodern” waters and in respect of depth have shallow
circulation.
Acknowledgments
The authors would like to express their thanks for the
financial support provided by the University of Tabriz
and Renewable Energy Organization of Iran (REOI). We
are also so thankful to the personnel of the Faculty of
Earth Sciences of Bremen University (Germany) for their
generous cooperation with this study.
References
Alberti A, Chiaramonti P, Batistini G, Nicoletti M, Petrucciani C,
Sinigoi S (1976). Geochronology of Eastern Azerbaijan volcanic
plateau (North-West Iran). Ital Min Petr 32: 579-589.
Clark WB, Jenkins WJ, Top Z (1976). Determination of tritium by
mass spectrometric measurements. Int J Appl Radiat Is 27:
515-522.
Alçiçek H, Bülbül A, Alçiçek MC (2016). Hydrogeochemistry of
the thermal waters from the Yenice geothermal field (Denizli
Basin, Southwestern Anatolia, Turkey). J Volcanol Geoth Res
309: 118-138.
Craig H (1966). Isotopic variations in meteoric waters. Science 133:
1702-1703.
Arnórsson S, Andrésdóttir A (1995). Processes controlling the
distribution of boron and chlorine in natural waters in Iceland.
Geochim Cosmochim Ac 59: 4125-4146.
Arnorsson S, Stefansson A, Bjarnason J (2007). Fluid-fluid interactions
in geothermal systems. Institute of Earth Sciences, University of
Iceland. Rev Mineral Geochem 65: 259-312.
ATSDR (2001). Draft toxicological profile for selenium. U.S.
Department of Health and Human Services. Agency for Toxic
Substances and Disease Registry.
Bozdağ A (2016). Hydrogeochemical and isotopic characteristics of
Kavak (Seydişehir-Konya) geothermal field, Turkey. J Afr Earth
Sci 121: 72-83.
Çelmen O, Çelik M (2009). Hydrochemistry and environmental
isotope study of the geothermal water around Beypazarı
granitoids, Ankara, Turkey. Environ Geol 58: 1689-1701.
Chang CL (1984). Triangular diagrams for predication of aquifer
chemistry. Geoth Res T 8: 373-376.
Chen G (2008). The isotopic and chemical characteristics of geothermal
fluids from the western Fjords, Iceland and two selected hot
spring area in Jiangxi province, SE China. Geothermal training
program, Report, The United Nations University.
452
Craig H (1966). Isotopic composition and origin of the Red Sea and
Salton Sea geothermal brines. Science 154: 1544-1548.
Dewey JF, Pitman WC, Ryan WBF, Bonnin J (1973). Plate tectonics
and the evolution of the Alpine system. Geol Soc Am Bull 84:
3137-3180.
Dostal J, Zerbi M (1978). Geochemistry of the Savalan volcano
(Northwestern Iran). Chem Geol 22: 31-42.
Einarsson SS, Vides RA, Cuéllar G (1975). Disposal of geothermal
waste water by reinjection Proceedings. 2nd United Nations
Symposium on the Development and Use of Geothermal
Resources, San Francisco: 1349-1363.
Ellis AJ, Mahon WAJ (1977). Chemistry and Geothermal Systems.
New York, NY, USA: Academic Press.
Ferguson G, Grasby SE, Hindle SR (2009). What do aqueous
geothermometers really tell us? Geofluids 9: 39-48.
Fournier RO (1977). Chemical geothermometers and mixing models
for geothermal systems. Geothermics 5: 41-50.
Fournier RO, Truesdell AH (1973). An empirical Na-K-Ca
geothermometer for natural waters. Geochim Cosmochim Ac
37: 1255-1275.
Fournier RO (1979). A revised equation for the Na/K geothermometer.
Geoth Res T 3: 221-224.
MASOUMI et al. / Turkish J Earth Sci
Gat JR (1980). The isotopes of hydrogen and oxygen in precipitation.
In: Fritz P, editor. Handbook of Environmental Isotope
Geochemistry, The Terrestrial Environment. Amsterdam,
Netherlands: Elsevier, pp. 21-48.
Masoumi R, Calagari AA, Siahcheshm K (2017c). Using geochemical
and isotopic techniques for exploration of geothermal energy
in Southern Sabalan geothermal field, NW Iran. EGU General
Assembly, Vol. 19, EGU2017-761.
Gendenjamts OE (2003). Interpretation of chemical composition
of geothermal fluids from Arskogsstrond, Dalvik and Hrisey,
N-Iceland and in the Khangai area, Mongolia. Geothermal
training program report, The United Nations University,
Iceland.
Mazor E (1991). Applied Chemical and Isotopic Groundwater
Hydrology. 1st ed. Buckingham, UK: Open University Press.
Giggenbach WF (1988). Geothermal solute equilibria. Derivation
of Na–K–Mg–Ca geoindicators. Geochim Cosmochim Ac 52:
2749-2765.
Giggenbach WF (1991). Chemical techniques in geothermal
exploration. In: D’Amore F, Editors. Application of
Geochemistry in Geothermal Reservoir Development. Rome,
Italy: UNITAR/UNDP, pp. 252-270.
Giggenbach WF (1997). The origin and evolution of fluids in
magmatic–hydrothermal systems. In: Barnes HL, editor.
Geochemistry of Hydrothermal Ore Deposits. New York, NY,
USA: Wiley, pp. 737-796.
Mckenzie D (1972). Active tectonics of the Mediterranean region.
Geophys J Roy Astr S 30: 109-185.
Nicholson K (1993). Geothermal Fluids: Chemistry and Exploration
Techniques. New York, NY, USA: Springer.
Ohba T, Hirabayashi J, Nogami K (2000). D/H and 18O/16O ratios of
water in the crater lake at Kusatsu-Shirane volcano, Japan. J
Volcanol Geoth Res 97: 329-346.
Purnomo BJ, Pichler T (2014). Geothermal systems on the island of
Java, Indonesia. J Volcanol Geoth Res 285: 47-59.
Schoeller H (1962). Les eaussouterrians Masson et. Cie. Paris, France.
Smith M, Bisiar T, Putra T, Blackwood V (2011). Geochemistry of
geothermal fluids Rico, Colorado. Final report: 22p.
Gokgoz A (1998). Geochemistry of the Kizildere-TekkehamambuldanPamukkale geothermal fields, Turkey. Geothermal training
program report, United Nations University, Iceland.
Sveinbjörnsdóttir ÁE, Arnórsson S, Heinemeier J, Boaretto E (2000).
14
C ages of groundwater in Iceland. Proceedings of the World
Geothermal Congress 2000, Kyushu-Tohoku, Japan: 17971802.
Güleç N, Mutlu H (2002). Isotope geochemistry in geothermal field.
Application of earth science in geothermal, Summer School,
Dokuz Eylül University: 74-103.
Tarcan G (2002). Geothermal water chemistry. Research and
Application Center for Geothermal Energy (Jenarum) Summer
School, Dokuz Eylül University, İzmir: 230-272.
Haddadan M, Abbasi Damani A (1997). 1:100000 geologic map of
Ardabil. Geologic survey of Iran.
IAEA (1979). Behaviour of Tritium in the Environment. Vienna,
Austria.
Truesdell AH, Hulston JR (1980). Isotopic evidence of environments
of geothermal systems. In: Fritz P, Fontes JC, editors. Handbook
of Environmental Isotope Chemistry. New York, NY, USA:
Elsevier, pp. 179-226.
Kendall C, Doctor DH (2005). Stable isotope applications in
hydrologic studies. In: Drever JI, editor. Surface and Ground
Water, Weathering and Soils. New York, NY, USA: Elsevier.
Varekamp JC, Kreulen R (2000). The stable isotope geochemistry
of volcanic lakes, with examples from Indonesia. J Volcanol
Geoth Res 97: 309-327.
Kharaka YK, Lico MS, Law LM (1982). Chemical geothermometers
applied to formation waters, Gulf of Mexico and California
basins. Am Assoc Petr Geol B 66: 588.
Wang J, Sun Z (2001). Brief review on the development of isotope
hydrology in China. Sci China Ser E 44: 1-5.
Khosrawi K (1996). Geochemistry of geothermal springs in the
Sabalan area, Azarbayjan-Iran. Geothermal training program,
Report, The United Nations University.
Masoumi R, Calagari AA, Siahcheshm K, Porkhial S (2016).
Hydrogeochemistry and origin of hydrothermal fluids on
the basis of isotopic data in Sabalan geothermal system.
Quaternary Journal of Iran 2: 183-195.
Masoumi R, Calagari AA, Siahcheshm K, Porkhial S, Pichler T
(2017a). Consideration of geological aspects and geochemical
parameters of fluids in Bushdi geothermal field, south of mount
Sabalan, NW Iran. J Afr Earth Sci 129: 692-700.
Wetang’ula GN (2004). Assessment of geothermal wastewater
disposal effects, Case studies: Nesjavellir (Iceland) and Olkaria
(Kenia) fields. Master thesis, University of Iceland.
White DE (1981). Active geothermal systems and hydrothermal ore
deposits. Econ Geol 75th Anniversary: 392-423.
Young HW, Lewis RE (1982). Hydrology and geochemistry of
thermal ground water in Southwestern Idaho and NorthCentral Nevada. Geological survey of United States,
Professional paper: 26p.
Masoumi R, Calagari AA, Siahcheshm K, Porkhial S (2017b).
Investigation of concentration values of heavy and rare
elements within active hydrothermal fluids in Geothermal
field, south of mount Sabalan, Ardebil province, NW Iran. J
Geosci in press.
453


![Structures and electronic properties of si nanowires grown along the [1 1 0] direction role of surface reconstruction](https://media.store123doc.com/images/document/14/rc/td/medium_tdu1394959072.jpg)