Improvement of the magnetic properties for Mn–Ni–Zn ferrites by rare earth Nd3+ ion substitution
Bạn đang xem bản rút gọn của tài liệu. Xem và tải ngay bản đầy đủ của tài liệu tại đây (1.22 MB, 5 trang )
Journal of Advanced Research (2014) 5, 601–605
Cairo University
Journal of Advanced Research
ORIGINAL ARTICLE
Improvement of the magnetic properties for
Mn–Ni–Zn ferrites by rare earth Nd3+ ion
substitution
M.M. Eltabey
a,b
, W.R. Agami
c,*
, H.T. Mohsen
b,d
a
Basic Engineering Science Department, Faculty of Engineering, Menoufiya University, Shebin El-Kom, Egypt
Science Department – Physics, Preparatory Year Deanship, Jazan University, Saudi Arabia
c
Department of Physics, Faculty of Science, Ain Shams University, 11566 Abbasia, Cairo, Egypt
d
Accelerators and Ion Sources Department, Nuclear Research Center, P.O. Box 13759, Cairo, Egypt
b
A R T I C L E
I N F O
Article history:
Received 24 June 2013
Received in revised form 27 August
2013
Accepted 29 August 2013
Available online 3 September 2013
Keywords:
Ferrites
EDX
Magnetization
Initial permeability
A B S T R A C T
Single spinel phases of Mn0.5Ni0.1Zn0.4NdxFe2ÀxO4 ferrite samples (x = 0.0, 0.01, 0.02, 0.05,
0.075, and 0.1) have been prepared by ceramic method and the composition dependence of
the physical and magnetic properties has been investigated. SEM micrographs and EDX analysis revealed that there is no considerable effect for the Nd3+ ion substitution on the average
grain size or porosity, whereas its concentration in the grain boundaries is higher than that in
the grains. Saturation magnetization (MS) increased with the Nd3+ ion concentration (x) and
reached a maximum value at x = 0.05. In addition, both the initial permeability and the magnetic homogeneity increased by increasing the Nd3+ ion content. The value of Curie temperature increased due to the substitution by Nd3+ ions to record about 170 K, for the sample with
x = 0.05, higher than that of the un-substituted one.
ª 2013 Production and hosting by Elsevier B.V. on behalf of Cairo University.
Introduction
Both Mn–Zn and Ni–Zn ferrites have a great importance from
the application point of view, where they are used in many ferrite devices such as inductor cores, converters, magnetic heads,
and electromagnetic wave absorbers. Although Mn–Zn ferrites
have distinctive magnetic properties as high initial permeabil* Corresponding author. Tel.: +20 1144105038; fax: +20 24665630.
E-mail address: (W.R. Agami).
Peer review under responsibility of Cairo University.
Production and hosting by Elsevier
ity and magnetization, they have low electrical resistivity and
high power losses. So, they are not suitable for magnetic applications especially at high frequencies. On the other hand, Ni–
Zn ferrites are characterized by their high resistivity, low
dielectric loss and high Curie temperature, but they have relatively low initial permeability at high frequencies. Combinations between these two ferrites were carried out by many
studies trying to obtain favorable magnetic properties with
low losses especially at high frequencies in bulk and powder
forms [1–10]. In a previous work, the magnetic and electrical
properties of such a combination were investigated [11,12].
The sample with the chemical formula Mn0.5Ni0.1Zn0.4Fe2O4
was found to possess the optimum properties for promising
applications. Moreover, it was noticed clearly that the properties of Mn–Ni–Zn ferrites are predominantly governed by the
2090-1232 ª 2013 Production and hosting by Elsevier B.V. on behalf of Cairo University.
/>
602
M.M. Eltabey et al.
Ferrite samples with the chemical formula Mn0.5Ni0.1Zn0.4
NdxFe2ÀxO4 (x = 0.0, 0.01, 0.02, 0.05, 0.075 and 0.1) were
prepared by the usual standard ceramic method. Details about
the preparation conditions were previously reported [11].
X-ray diffraction patterns were performed using a diffractometer of type X’Pert Graphics and identified with Cu Ka radiation. The Scanning Electron Microscope (SEM) of type
JSM-5600-LV was used for imaging the samples. Digital Image Processing (DIP) software was used for image analysis of
samples. Different image analysis filters were used for determination of grains. The observed samples were polished and
etched before imaging by SEM. According to the American
Society for Testing and Materials (ASTM) intercept method,
and after imaging the sample by SEM, the average particle size
of grains was determined using particle counting method [13].
Energy Dispersive X-ray spectrometer (EDX) was used to
analyze both the grain and the grain boundaries. The magnetization was measured for powder samples, at room temperature, using Vibrating Sample Magnetometer (VSM, EG&G
PARC model no. 1551 USA). The porosity percentage (P%)
and the initial permeability (li) were measured according to
the techniques and methods mentioned elsewhere [11,12].
8.465
8
8.460
6
8.455
a
P(%)
8.450
4
8.445
Porosity P (%)
Material and methods
10
8.470
Lattice parameter a (Angstrom)
type of substituted ions [2,12]. Accordingly, this work deals
with the improvement of the magnetic properties of this last
optimum sample when Nd3+ ions substitute only Fe3+ ions.
This may present a candidate for magnetic applications in high
frequency field.
2
8.440
8.435
0
0.00
0.02
0.04
0.06
0.08
0.10
Nd- concentration (x)
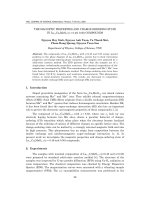
Fig. 2 Variation of the lattice parameter a (A˚) and Porosity P
(%) with Nd-concentration (x).
X-ray diffraction
Porosity, SEM and EDX
X-ray diffraction patterns, (Fig. 1), showed that all the investigated samples have single cubic spinel phase. Values of the lattice parameter (a) were calculated according to the procedure
mentioned before [14]. Fig. 2 shows the variation of the lattice
parameter as a function of Nd-concentration (x). It can be seen
that the lattice parameter decreases dramatically with the
The composition dependence of porosity is illustrated in Fig. 2.
One can note the absence of any considerable change in the value of porosity by increasing the Nd-content. This could be
linked to the constancy in the average value of the grain size
shown by SEM micrographs.
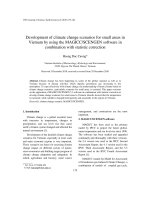
Fig. 3 shows the SEM micrographs for the samples with
x = 0.0, 0.05, and 0.1. It is obvious that the substitution by
Nd3+ ions in our system has no noticeable effect on the grain
size. The average value of the grain size determined by ASTM
intercept method is about 4.2 lm.
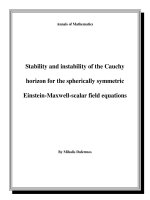
The energy dispersive X-ray spectra (EDX) for the sample
with x = 0.05 at the grain and grain boundaries are represented
in Fig. 4. The analysis of EDX data is collected in two tables as
insets in the same figure. Each table contains two columns; one
is for the element percentage and the other is for the atomic percentage. The element percentage values represent the raw data
of the emitted X-ray intensities which arrive to the detector of
the EDX spectrometer. On the other hand, the atomic percentage values come from three iterations for the ZAF quantitative
method. This method takes three parameters in consideration:
the atomic number of each element (Z), the absorption of the
emitted X-ray by the sample elements themselves (A), and the
amount of X-ray fluorescence which results from the sample
elements due to the absorption of emitted X-ray (F). One can
note that the element percentage data show that the concentrations of elements are in non-stoichiometric proportion form,
Counts (a. u)
(533)
(440)
(511)
(422)
(400)
(222)
x=
0.1
(220)
(311)
Results and discussion
Nd-concentration up to x = 0.05 then it becomes nearly constant for 0.05 < x 6 0.1. For x 6 0.05, the decrease in the lattice parameter could be attributed to that some rare earth ions
reside at the grain boundaries [15]. Hence, they hinder the grain
growth and may exert a pressure on the grains and lead the lattice parameter to decrease. The presence of higher concentrations of Nd3+ ions in the grain boundaries than that in the
grains was confirmed by EDX analysis and it will be discussed
in the next section. On the other side, for 0.05 < x 6 0.1, some
of the Nd3+ ions (radius = 0.983 A˚) [16] that substitute Fe3+
ions (radius = 0.645 A˚) [16] in the unit cell may cause the increase in the lattice parameter which in turn compensates the
decrease due to the grain boundaries pressure.
0.075
0.05
0.02
0.01
0.00
20
30
40
50
60
70
2theta (degree)
Fig. 1
X-ray diffraction patterns for Mn0.5Ni0.1Zn0.4NdxFe2ÀxO4.
Improving the magnetic properties of Mn–Ni–Zn ferrites
603
x= 0
Counts
Elem.
Cl
Mn
Fe
Ni
Zn
Nd
O
Grain Percentage
Elem.
Atomic
13.75
8.52
43.79
26.69
1.71
0.99
13.17
6.86
0.92
0.22
26.66
56.73
10 µm
x = 0.05
Energy (keV)
Elem.
Counts
10 µm
Cl
Mn
Fe
Ni
Zn
Nd
O
GrainBoundary
Percentage
Elem.
Atomic
1.56
1.5
11.46
7.09
46.39
28.23
1.73
1
10.02
5.21
0.53
2.26
26.57
56.44
x = 0.1
Energy (keV)
10 µm
Fig. 3 SEM micrographs for Mn0.5Ni0.1Zn0.4NdxFe2ÀxO4 ferrite
samples with x = 0.0, 0.05, and 0.1.
Fig. 4 EDX spectra for sample with x = 0.05 at the grain and
grain boundaries. Tables of the EDX data analysis at the grain
and grain boundaries are in two insets.
Magnetic studies
Magnetization
whereas the atomic percentage one is nearly fully stoichiometric. The difference between the data of the two columns could
be discussed according to the previously reported parameters of
the ZAF quantitative method. Although the concentration of O
element in the prepared sample is higher than that of Fe, the
element percentage value of oxygen is lower than that of iron.
This could be attributed to the energy of the emitted oxygen
X-ray which is much lower than that of iron. The lower the energy the lower the penetration, so the amount of X-ray arrives
to the detector from O anions is lower than that arrives from Fe
cations. Moreover, some traces of Cl element were detected in
grain boundaries. These traces remained after washing the sample through the etching process.
One of the clearest remarks in these tables is that the concentration of Nd element in the grain boundaries, in both columns, is more than twice that in the grains. In other words, the
Nd3+ rare earth ions in our ferrite system tend to concentrate
in the grain boundaries, which is in agreement with the previously reported results [17,18].
The variation of the magnetization M (emu/g) versus the applied magnetic field H (Oe), at room temperature, is illustrated
in Fig. 5. The dependence of the saturation magnetization (MS)
on the Nd-concentration (x) is shown in an inset in Fig. 5. It can
be seen that MS increases with x and attains a maximum value
at x = 0.05 with a percentage increase of 26.5% relative to that
of the un-substituted sample. Further increase in the Nd-concentration leads MS to decrease but with values still larger than
that for the sample with x = 0. Such a result could be discussed
assuming the following cation distribution:
þ2
3þ
2þ
3þ
2þ
3þ
ðZn2þ
0:4 Mn0:4 Fe0:2 Þ½Ni0:1 Mn0:1 Ndx Fe1:8Àx
where the brackets () and [ ] denote A- and B-sites, respectively.
Such a cation distribution is based on the following facts:
1. Zn2+ ions have a strong preference to occupy the A-site
[19].
2. 80% of Mn2+ ions occupy the A-site while 20% occupy the
B-site [20].
3. Rare earth ions, as Nd3+, occupy the B-site [17,18,21].
604
M.M. Eltabey et al.
500
60
450
Initial permeability µi
40
65
20
10
0
0
1000
S
x=0.00
x=0.01
x=0.02
x=0.05
x=0.075
x=0.1
60
55
350
300
250
200
150
100
50
2000
0.00
0.02
0.04
0.06
0.08
50
0.10
Nd concentration (x)
3000
4000
5000
0
300
6000
350
450
500
550
600
650
Temperature (K)
H (Oe)
According to the assumed cation distribution, the total magnetization (Mmol = MB À MA), where MA and MB are the
magnetizations of A- and B-sites respectively, is expected to be
Mmol ¼ ð6:7 À 1:5xÞlB
ð1Þ
where lB is Bohr magneton. It is valuable to note that for Mn–
Zn and Ni–Zn ferrites, there exists a canting Yafet-Kittel angle
(hYK) between moments in B-sites at Zn-concentration 0.4.
This angle depends on the relative strength of B–B to A–B
interactions [11,12,22]. In this case, the last equation could
be rewritten as
Mmol ¼ ð6:7 cos hYK À 1:5xÞlB
ð2Þ
3+
It is suggested that for 0 6 x 6 0.5, substituting Fe ions
(moment = 5 lB) by Nd3+ ions (moment = 3.5 lB) leads the
B-B interaction between these moments to decrease and hence
the canting angle (hYK) decreases. Such a decrease in (hYK) improves the parallelism between the magnetic moments in the Bsite and leads to increase MS according to Eq. (2) to reach its
maximum value at x = 0.05. For more substitution by Nd3+
ions (x > 0.05), the canting angle (hYK) could be neglected
and hence MS decreases due to equation (1), where the value
of magnetic moments in the B-site decreases and hence the value of MS goes down.
Initial permeability
Fig. 6 shows the variation of the initial permeability li with temperature for the investigated system. It is seen that the initial
permeability decreases with temperature up to Curie temperature TC. There is a sharp drop in li near TC. This result could
be explained according to Globus relation [23] which is given by
ð3Þ
where D is the average grain size and k1 is the anisotropy constant. It was reported that for Mn–Zn ferrites, the anisotropy
constant is independent of temperature for temperatures higher than the room temperature [24]. Accordingly, the decrease
in li with temperature can be attributed to the decrease in
saturation magnetization. At TC, MS drops sharply with
Fig. 6 Temperature dependence of the initial permeability for
Mn0.5Ni0.1Zn0.4NdxFe2ÀxO4.
temperature leading to the rapid decrease in li. Moreover,
one can notice from Fig. 6 that the slope of the linear part
of li(T) curve, at the sudden decrease in li, increases with
increasing Nd3+ concentration. Previous studies have reported
that the value of |(dli/dT)T=Tc| gives a good indication about
the sample homogeneity where higher slope corresponds to
higher homogeneity [23,25]. Thus, one can conclude that the
homogeneity increases with increasing Nd-concentration.
The dependence of the initial permeability li, at room temperature, on Nd3+ ion concentration is represented in Fig. 7.
It is clear that li increases with increasing Nd-concentration.
To explain this behavior, the following aspects have to be taken
in consideration. The SEM micrographs revealed that the average grain size D is nearly independent of the Nd-concentration
(x). Moreover, the increase in x leads to a decrease in the iron
ions concentration in the ferrite molecule. It is well known that
the main source of anisotropy in ferrites is the presence of
Fe2+ ions [22]. Hence, the anisotropy constant k1 decreases. This
decrease in the value of k1 in turn increases li according to
Globus relation. Furthermore, the enhancement of MS due to
the Nd3+ ion substitution enforces the increase in li for the samples with 0 6 x 6 0.05.
650
450
400
Initial permeability µi
Fig. 5 Variation of magnetization at room temperature M (emu/
g) with the magnetic field H (Oe). Inset: Variation of saturation
magnetization MS (emu/g) with Nd-concentration.
li aðM2s D=k1=2
1 Þ
400
600
350
550
300
250
500
µi
200
TC
450
150
Curie temperature TC (K)
30
M (emu/g)
M (emu/g)
x=0.00
x=0.01
x=0.02
x=0.05
x=0.075
x=0.1
400
50
100
400
0.00
0.02
0.04
0.06
0.08
0.10
Nd-concentration
Fig. 7 Variation of initial permeability li, at room temperature
and Curie temperature TC (K) with Nd-concentration (x).
Improving the magnetic properties of Mn–Ni–Zn ferrites
Values of Curie temperature (TC) were determined from the
extrapolation of the linear part at the sudden decrease in li
with temperature, Fig. 6, for all investigated samples. The
dependence of TC on Nd3+ ion concentration is shown in
Fig. 7. It is clear that TC increases considerably with increasing
Nd-content (about 170 K for the sample with x = 0.05 higher
than that with x = 0). For x > 0.05, TC decreases but its value
is still higher than that of the un-substituted sample. One can
notice from Figs. 5 and 7 that generally MS and TC behave in a
same manner. The increase in TC for 0 6 x 6 0.05 with Ndconcentration could be understood in view of the behavior
of both MS and the lattice parameter (a). The decrease in
(a), Fig. 2, and the increase in MS, Fig. 5, with increase in
the Nd-content lead to increase the A–B interaction between
the moments. This in turn increases the value of TC. On the
other hand, for x P 0.05, the constancy in the value of (a),
Fig. 2, and the decrease in MS, Fig. 5, lead the A–B interaction
between moments to decrease and, hence, TC goes down.
Conclusions
– Single phase Mn0.5Ni0.1Zn0.4NdxFe2ÀxO4 ferrite samples up
to x = 0.1 were obtained.
– Nd3+ ions were found to concentrate in grain boundaries
more than in grains, and they had no effect on both average
grain size and porosity.
– The saturation magnetization increased by Nd3+ substitution up to 26% relative to that of the un-substituted sample.
– Both initial permeability and Curie temperature were
increased due to the Nd3+ substitution from (111 to 442)
and from (448 K to 627 K), respectively.
Conflict of interest
The authors have declared no conflict of interest.
Compliance with Ethics Requirements
This article does not contain any studies with human or animal
subjects.
Acknowledgement
The authors express their deep thanks to Dr. W.A. Ghaly,
Accelerators and Ion Sources Department, Nuclear Research
Center, Cairo, Egypt, for his helpful advice guidance and stimulating discussions.
References
[1] Amarendra KS, Goel TC, Mendiratta RG. Magnetic properties
of Mn-substituted Ni–Zn ferrites. J Appl Phys 2002;92:3872–6.
[2] Kulkarni Suresh R. Development of In3+ substituted Mn–Ni–
Zn nanoferrite core material. Arch Phys Res 2012;3(2):116–22.
[3] Amarendra KS, Verma A, Thakur OP, Prakash C, Goel TC,
Mendiratta RG. DC resistivity of Mn–Ni–Zn ferrites. Jpn J
Appl Phys 2002;41:5142–4.
[4] Japes B, Ashim KS, Aravind M. Sintering and surface
microstructure of Ni–Zn ferrites. In: Proc (ICF 8), Kyoto and
Tokyo, Japan; 2000. p. 536–8.
605
[5] Amarendra KS, Goel TC, Mendiratta RG. Low-temperature
synthesis of Mn0.2Ni0.2Zn0.6Fe2O4 ferrites by citrate precursor
method and study of their properties. Phys Status Solidi a
2004;201(7):1453–7.
[6] Choi WO, Kwon WH, Lee JG, Kang BS, Chae KP. Structural
and magnetic properties of nanoparticle Mn–Zn–Ni ferrite
powders grown by using a sol–gel method. J Korean Phys Soc
2012;61(11):1812–6.
[7] Amarendra KS, Verma A, Thakur OP, Prakash C, Goel TC,
Mendiratta RG. Electrical and magnetic properties of Mn–Ni–
Zn ferrites processed by citrate precursor method. Mater Lett
2003;57(5–6):1040–4.
[8] Amarendra KS, Goel TC, Mendiratta RG. Effect of manganese
impurity on the conductivity, dielectric behavior and magnetic
properties of Ni03 MnxZn0.7Àx Fe2O4. Jpn J Appl Phys
2003;42:2690–1.
[9] Rezlescu E, Sachelarie L, Popa PD, Rezlescu N. Effect of
substitution of divalent ions on the electrical and magnetic
properties of Ni–Zn–Me ferrites. IEEE Trans Magnet
2000;36(6):3962–7.
[10] Shirsath SagarE, Toksha BG, Kadam RH, Patange SM, Mane
DR, Jangam S, Ganesh, Ghasemi Ali. Doping effect of Mn2+
on the magnetic behavior in Ni–Zn ferrite nanoparticles
prepared by sol–gel auto-combustion. J Phys Chem Sol
2010;71(12):1669–75.
[11] Sattar AA, El-Sayed HM, El-Shokrofy KM, El-Tabey MM.
Effect of manganese substitution on the magnetic properties of
nickel-zinc ferrite. J Mater Eng and Perform 2005;14(1):99–103.
[12] Sattar AA, El-Sayed HM, El-Shokrofy KM, El-Tabey MM.
Improvement of the magnetic properties of Mn–Ni–Zn ferrite by
the non-magnetic Al3+-ion substitution. J Appl Sci 2005;5(1):162–8.
[13] Al-Kofahi MM, Al-Tarawneh KF. Analysis of Ayyubid and
Mamluk dirhams using X-ray fluorescence spectrometry. X-ray
Spectrom 2000;29:39–47.
[14] Sattar AA, El-Sayed HM, Agami WR. Physical and magnetic
properties of calcium-substituted Li–Zn ferrite. J Mater Eng
Perform 2007;16:573–7.
[15] Sattar AA, Wafik AH, El-Sayed HM. Infrared spectra and
magnetic studies of trivalent doped Li-ferrites. Phys Status
Solidi a 2001;186(3):415–22.
[16] Shannon RD. Revised effective ionic radii and systematic
studies of interatomic distances in halides and chalcogenides.
Acta Cryst 1976;A32:751–67.
[17] Rezlescu N, Rezlescu E, Pasnicu C, Craus ML. Effect of the
rare-earth ions on some properties of a nickel–zinc ferrite. J Phys
Condens Matter 1994;6:5707–16.
[18] Rezlescu N, Rezlescu E, Popa PD, Rezlescu L. Effects of rareearth oxides on physical properties of Li–Zn ferrite. J Alloys
Compds 1998;275–277:657–9.
[19] Xu ZC. Magnetic anisotropy and Mo¨ssbauer spectra in
disordered lithium–zinc ferrites. J Appl Phys 2003;93:4746–9.
[20] Patil F, Lenglet M. Spectroscopic evidence of the Mn3+–Fe2+
octahedral pair in lithium-manganese ferrites near the order–
disorder transition. Solid State Commun 1993;86:67–71.
[21] Kolekar CB, Kamble PN, Vaingankar AS. Structural and dc
electrical resistivity of Gd3+-substituted Cu–Cd mixed ferrites. J
Magn Magn Mater 1994;138:211–5.
[22] Chikazumi S, Charap S. Physics of magnetism. New York,
London, Sydney: John Wiley and Sons, Inc.; 1964.
[23] Globus A, Pascard H, Cagan VJ. Distance between magnetic ions
and fundamental properties in ferrites. J Phys 1977;38, C1-163-8.
[24] Ohta K. Magnetocrystalline anisotropy and magnetic permeability
of Mn–Zn–Fe Ferrites. J Phys Soc Jpn 1963;18:685–90.
[25] Sattar AA, Wafik AH, El-Shokrofy KM, El-Tabey MM.
Magnetic properties of Cu–Zn ferrites doped with rare earth
oxides. Phys Status Solidi a 1999;171:563–9.