Determination of species distribution and formation constants of complexes between ion Cu2+ and amino acids using multivariate regression analysis
Bạn đang xem bản rút gọn của tài liệu. Xem và tải ngay bản đầy đủ của tài liệu tại đây (594.13 KB, 8 trang )
Tạp chí Đại học Thủ Dầu Một, số 1 - 2011
DETERMINATION OF SPECIES DISTRIBUTION AND FORMATION
CONSTANTS OF COMPLEXES BETWEEN ION Cu2+ AND AMINO ACIDS
USING MULTIVARIATE REGRESSION ANALYSIS
Le Thi My Duyen(1) – Pham Van Tat (2)
(1) University of Dalat – (2) University of Thu Dau Mot
ABSTRACT
In present work, the formation constants, logb110, logb120 and the concentration of [M] and [MLi]
in complex solutions of Cu2+ and the amino acids were determined by using the quantitative electron
structure and properties relationships (QESPRs) and quantitative complex and complex relationships
(QCCRs). The relative charge nets for complex structures were calculated by using molecular mechanics
MM+ and semiempirical quantum chemistry calculations ZINDO/1. The QESPRs and QCCRs models
were constructed by the atomic charge net on complex structures and the multivariate regression analysis.
These were employed for approximate determination the formation constants logb110, logb120 and the
distribution diagram of species [M], [MLi] in various solutions. These results were compared with those
from literature [[3]]. They were also validated by the statistical method ANOVA. The dissimilarities
between these models and experimental data are insignificant.
Keyworks: formation constants, semiempirical quantum chemistry calculations ZINDO/1,
multivariate regression analysis, quantitative complex and complex relationships
*
1. INTRODUCTION
In recent years computer is becoming a helpful tool, an effective means of strong calculation in many
different areas. It is used in the inorganic chemistry, analytical chemistry, organic chemistry, physical
chemistry, material simulation and data mining [[1],[2]]. The multivariate analysis methods are becoming
a convenient and an easy tool for building empirical and theoretical models. The linear correlation
relationships can be assessed from different characteristics of the system.
Formation constants of complexes are one of the most important factors to explain reaction
mechanisms, chemical properties of biological systems in nature. From the formation constants we can
calculate the equilibrium concentration of components in a solution. These can forecast the changes of
complex electronic structure in solution from the initial concentration of the central ion and ligand. In
recent years the formation constants of the complexes can be determined by experimental ways using
UV-Vis spectral data [[7]] and computational techniques. The theoretical methods used for predicting
stability constants of complexes based on the relationship between structural and topological descriptors
were introduced [[8]]. A few topological descriptors of complexes Cu2+ with amino acids were determined
by molecular mechanics methods [[4],[5],[6]].
In this work, the linear relationship between topological parameters and formation constants of
the complexes is not done. We focused only on constructing the quantitative electron structure and
57
Journal of Thu Dau Mot university, No1 - 2011
properties relationships (QESPRs) from the atomic charge nets and formation constants of complexes
Cu2+ with amino acids. These linear models were carried out by using principal component analysis.
The atomic charges are calculated using the semiempirical quantum chemical method ZINDO/1 SCF
MO. We also reported the quantitative complex and complex relationships (QCCRs) using the atomic
charges. The formation constants logb110 and logb120 of complexes Cu2+ and amino acids were predicted
from these linear models. Those were also compared to predictive ability of artificial neural networks.
The distribution diagram of ions in complex solution was built upon the predicted values of logb110 and
logb120. All the results were also compared with experimental data from literature.
2. METHODS
2.1. Reaction equations
In aqueous solution, amino acid dissociates into anion L2- then reacts with metal ion Cu2+:
kCu 2+ + lL2− + mH + = [Cu k Ll H m ] (1)
Ions Cu2+ participate in reactions with L2- ligands to form complexes [CukLlHm]:
b klm =��������������������������������������������������������������������������������������������������������������������������������������������������������������������������������������������������������������������������������������������������������������������������������������������������������������������������������������������������������������������������������������������������������������������������������������������������������������������������������������������������������������������������������������������������������������������������������������������������������������������������������������������������������������������������������������������������������������������������������������������������������������������������������������������������������������������������������������������������������������������������������������������������������������������������������������������������������������������������������������������������������������������������������������������������������������������������������������������������������������������������������������������������������������������������������������������������������������������������������������������������������������������������������������������������������������������������������������������������������������������������������������������������������������������������������������������������������������������������������������������������������������������������������������������������������������������������������������������������������������������������������������������������������������������������������������������������������������������������������������������������������������������������������������������������������������������������������������������������������������������������������������������������������������������������������������������������������������������������������������������������������������������������������������������������������������������������������������������������������������������������������������������������������������������������������������������������������������������������������������������������������������������������������������������������������������������������������������������������������������������������������������������������������������������������������������������������������������������������������������������������������������������������������������������������������������������������������������������������������������������������������������������������������������������������������������������������������������������������������������������������������������������������������������������������������������������������������������������������������������������������������������������������������������������������������������������������������������������������������������������������������������������������������������������������������������������������������������������������������������������������������������������������������������������������������������������������������������������������������������������������������������������������������������������������������������������������������������������������������������������������������������������������������������������������������������������������������������������������������������������������������������������������������������������������������������������������������������������������������������������������������������������������������������������������������������������������������������������������������������������������������������������������������������������������������������������������������������������������������������������������������������������������������������������������������������������������������������������������������������������������������������������������������������������������������������������������������������������������������������������������������������������������������������������������������������������������������������������������������������������������������������������������������������������������������������������������������������������������������������������������������������������������������������������������������������������������������������������������������������������������������������������������������������������������������������������������������������������������������������������������������������������������������������������������������������������������������������������������������������������������������������������������������������������������������������������������������������������������������������������������������������������������������������������������������������������������������������������������������������������������������������������������������������������������������������������������������������������������������������������������������������������������������������������������������������������������������������������������������������������������������������������������������������������������������������������������������������������������������������������������������������������������������������������������������������������������������������������������������������������������������������������������������������������������������������������������������������������������������������������������������������������������������������������������������������������������������������������������������������������������������������������������������������������������������������������������������������������������������������������������������������������������������������������������������������������������������������������������������������������������������������������������������������������������������������������������������������������������������������������������������������������������������������������������������������������������������������������������������������������������������������������������������������������������������������������������������������������������������������������������������������������������������������������������������������������������������������������������������������������������������������������������������������������������������������������������������������������������������������������������������������������������������������������������������������������������������������������������������������������������������������������������������������������������������������������������������������������������������������������������������������������������������������������������������������������������������������������������������������������������������������������������������������������������������������������������������������������������������������������������������������������������������������������������������������������������������������������������������������������������������������������������������������������������������������������������������������������������������������������������������������������������������������������������������������������������������������������������������������������������������������������������������������������������������������������������������������������������������������������������������������������������������������������������������������������������������������������������������������������������������������������������������������������������������������������������������������������������������������������������������������������������������������������������������������������������������������������������������������������������������������������������������������������������������������������������������������������������������������������������������������������������������������������������������������������������������������������������������������������������������������������������������������������������������������������������������������������������������������������������������������������������������������������������������������������������������������������������������������������������������������������������������ng from PCR model and ANN I(5)-HL(2)-O(2) are not different.
61
Journal of Thu Dau Mot university, No1 - 2011
3.2. Constructing models QCCRs
Besides the regression constructing technique and artificial neural network based on the atomic
charge distribution of the complex, in this work we also built the regression models using the complex
structure relationships, as illustrated in following equation (6):
m
Com-i = ∑ b j Com-j + b 0 with m = 1 - 8
(6)
j =1
where Com-i and Com-j are target complex i and predicted complexes j; bj is the parameter for
complex j; b0 is the constant.
The QCCRs models are constructed by the ordinary regression techniques. Each complex in Table
2 was selected as a target complex, and independent variables were chosen from remaining compounds.
The atomic net charge of complexes in Table 2 are used to establish the regression models using forward
and elimination technique. The best models were found by this technique. The selected complex models
QCCRs consist of the predicted complexes with the similar structural properties.
Table 6. The quantitative complex and complex relationships, and regression-statistical values.
Statistical values,
predictive complex
Com-1
Com-2
Com-3
Target complex
Com-4 Com-5
Com-6
Com-7
Com-8
R2-training
99.999 100.000
99.994
99.537
99.978
99.996
99.883
99.996
R2 -adjusted
Standard error, SE
99.998
0.002
99.999
0.001
99.992
0.003
99.486
0.022
99.973
0.005
99.995
0.002
99.833
0.013
99.994
0.002
R2 -prediction
Constant
Com-1
Com-2
Com-3
Com-4
99.995
-0.001
1.859
-0.910
-0.052
99.999
0.001
0.536
0.490
0.029
99.986
0.001
0.952
-
99.275
-0.004
-
99.956
-0.002
-1.381
2.399
-
99.991
-0.001
0.278
0.727
-
99.758
0.006
4.895
-8.563
4.649
-
99.992
0.001
0.557
0.105
-
-
-
0.344
-
Com-5
Com-6
Com-7
Com-8
0.757
0.108 -0.057
- -0.706
0.974
The complex model (7) for the Com-1 complex is shown in
Com-1 = -0.001 + 1.859(Com-2) – 0.910(Com-3) – 0.052(Com-4) + 0.108(Com-7)
(7)
The 8 regression models between different complex structures with their statistical values depict
the regression quality, shown in Table 6. All R2-training and R2-prediction values are larger than 99%
from the standard statistical values. The complex structural models QCCRs were used to estimate the
target complex properties using features of predicted complexes in the regression model. In this work
we used the formation constants of the complexes Cu2+ with amino acids, as a important properties for
calculating the stability constant of target complex in the respective models. The predicted results for
logβ120 and logβ110 were validated by the values ARE% for the models, are given in Table 7.
62
Tạp chí Đại học Thủ Dầu Một, số 1 - 2011
Table 7. The predicted formation constants by complex models QCCRs with values ARE,%.
Ref.[[3]]
logβ110
8.380
7.940
7.300
7.340
6.880
7.250
7.320
6.700
Complex
Com-1
Com-2
Com-3
Com-4
Com-5
Com-6
Com-7
Com-8
Models QCCRs
logβ110
logβ120
8.524
15.535
7.861
14.675
7.822
14.482
6.523
12.125
7.475
13.321
8.104
14.976
6.978
14.973
7.804
14.589
logβ120
15.700
14.590
13.560
13.550
12.860
13.310
13.520
12.450
ARE,%
logβ110
1.717
0.997
7.150
11.131
8.650
11.777
4.669
16.483
logβ120
1.050
0.583
6.796
10.520
3.582
12.515
10.746
17.182
The absolute values of relative errors ARE% are calculated by
ARE,% =
logb k ,l ,m −exp - logb k ,l ,m −cal
logb k ,l ,m −exp
.100 (8)
Where logβk,l,m-exp and logβk,l,m-cal are the experimental and calculated formation constants.
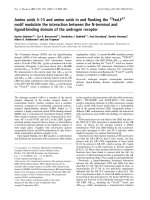
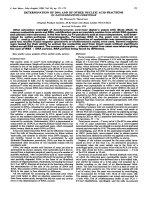
From the obtained results for logβ120 logβ110 in Table 7, distribution diagram of ions is illustrated for
the complex Cu(Gly)2 and Cu (GlyMe)2, as is shown in Figure 3.
2
4
Cu(Gly)2
8
10
pL
12
14
16
2
1E-01
1E-01
1E-02
1E-02
1E-04
1E-05
1E-03
Cu+2
log [c]
1E-03
log [c]
6
L-2
CuL
CuL2-2
1E-04
1E-05
1E-06
1E-06
1E-07
1E-07
1E-08
1E-08
1E-09
1E-09
4
6
Cu(GlyMe)2
8
10
pL
12
14
16
Cu+2
L-2
CuL
CuL2-2
Figure 3. Species distribution of the complex solution Cu(Gly)2 and Cu(GlyMe)2
The logβ120 logβ110 values in Table 7 obtained from the ordinary regression techniques are in very
good agreement with the reference values [[3]]. The one-way ANOVA is used to evaluate logβ110 values
(F = 0.705 < F0.05 = 4.600) and logβ120 (F = 1.473 < F0.05 = 4.600), and values ARE% (F = 0.0003 < F0.05
= 4.6001). Thus, PCR model for logβ110, logβ120 and QCCRs model fitted well with those from neural
network I(5)-HL(2)-O(2) and literature [[3]].
4. CONCLUSION
This work has successfully built the quantitative electron structure and properties (QESPRs) and the
quantitative complex and complex relationships (QCCRs) from complexes Cu2+ and amino acids using
the atomic charge net. The formation constant values and values ARE% were assessed by ANOVA.
63
Journal of Thu Dau Mot university, No1 - 2011
Determination of formation constants of complexes Cu2+ and amino acids is one important direction to
understand and to explain many biological properties. This research can be applied in different ways as
a potential method to quickly determine the formation constants of complexes between metal and amino
acids combining theory and experimental way. The ion H+ affects for complex formation, this will be
carried out by next work.
*
XÁC ĐỊNH PHÂN BỐ CÁC CẤU TỬ VÀ HẰNG SỐ TẠO THÀNH CỦA CÁC PHỨC GIỮA
ION Cu2+ VÀ CÁC AXIT AMINO SỬ DỤNG PHƯƠNG PHÁP PHÂN TÍCH HỒI QUY ĐA BIẾN
Lê Thị Mỹ Duyên(1) – Phạm Văn Tất(2)
(1) Trường Đại học Đà Lạt - (2) Trường Đại học Thủ Dầu Một
TÓM TẮT
Trong công trình này, các hằng số tạo thành logb110, logb120 và nồng độ [M] và [MLi] trong các dung
dịch phức của Cu2+ với các acid amino được xác định bằng mối quan hệ định lượng cấu trúc điện tử và tính
chất (QESPRs) và quan hệ định lượng phức chất và phức chất (QCCRs). Mạng lưới điện tích tương đối của
các cấu trúc phức được tính toán bằng cơ học phân tử MM+ và hóa lượng tử bán kinh nghiệm ZINDO/1.
Các mô hình QESPRs và QCCRs được xây dựng bằng mạng điện tích nguyên tử của phức chất và phân tích
hồi quy đa biến số. Những mô hình này được dùng để xác định gần đúng hằng số tạo thành logb110, logb120 và
giản đồ phân bố các cấu tử [M] và [MLi] trong các dung dịch. Các kết quả này được so sánh với những giá
trị thực nghiệm tham khảo[[3]] và cũng được đánh giá bằng phương pháp thống kê ANOVA. Sự khác nhau
giữa các phương pháp lý thuyết và dữ liệu thực nghiệm tham khảo là không có ý nghĩa.
Từ khóa: hằng số tạo thành, tính toán lượng tử bán thực nghiệm ZINDO/1,
phân tích hồi quy, quan hệ phức chất và phức chất
REFERENCES
[1] E. J. Billo., Excel For Scientists And Engineers-Numerical Methods., Wiley, 2007.
[2] D. Harvey, Modern analytical Chemistry, Mc.Graw Hill, Boston, Toronto, 2000.
[3] B. Grgas, S. Nikolic, N. Paulic, and N. Raos., Croatica Chemica Acta, 72, 885-895, 1999.
[4] A. Milicevic and N. Raos., Acta. Chim. Slov, 56, 373-378, 2009.
[5] M. Ante and N. Raos., Croatica Chemica Acta, 79, 281-290, 2006.
[6] S. Nikolic and N. Raos., Croatica Chemica Acta, 74, 621-631, 2001.
[7] N. Raos., Croatica Chemica Acta, 75, 117-120, 2002.
[8] Pham Van Tat., Development of QSAR and QSPR, Publisher of Natural sciences and Technique, HaNoi, 2009.
[9] Ha Tan Loc, Pham Van Tat., J. Analytical Sciences, Vol. 15, No 4, 2010.
[10] D. D. J.Werner, P. R.Yeater, Essential Regression and Experimental Design for Chemists and Engineer, 2000.
[11] MINITAB v 14 for Windows, Minitab. Inc, Ltd, 2010.
[12] HyperChem Release 7.5 for Windows, Hypercube Inc. Getting Started., USA, 2002.
[13] INForm v2.0, Intelligensys Ltd., UK, 2002.
64