Preperation of nanochitosan from radiation degraded oligochitosan for shelf life extension of strawberry
Bạn đang xem bản rút gọn của tài liệu. Xem và tải ngay bản đầy đủ của tài liệu tại đây (419.84 KB, 8 trang )
Nuclear Science and Technology, Vol.7, No. 3 (2017), pp. 34-41
Preperation of nanochitosan from radiation degraded
oligochitosan for shelf life extension of strawberry
Nguyen Trong Hoanh Phong1, Le Xuan Cuong1, Nguyen Duy Hang1, Nguyen Tan Man1,
Nguyen Minh Hiep1, Tran Thi Thuy1, Le Huu Tu1, Nguyen Tuong Ly Lan1,
Le Van Toan1, Pham Thi Sam1, Tran Thi Tam1, Vu Ngoc Boi2
1
Radiation Technology Center, Nuclear Research Institute.01 Nguyen Tu Luc - Da Lat
2
Nha Trang University. 02 Nguyen Dinh Chieu - Nha Trang- Khanh Hoa
Email:
(Received 01 Octorber 2017, accepted 25 Octorber 2017)
Abstract: Oligochitosans (OCT) were prepared from chitosan (CTS) by gamma irradiation
technique. The parameters affecting to the chitosan degradation were studied. And then, OCT
nanoparticles wereformed using the method of tripolyphosphate (TPP) cross-linking. Effect of
concentration and molecular weight of OCT, concentration of TPP on particle size of the formed
OCT nanoparticles were also studied. The formation of OCT nanoparticles was verified by Fourier
transform infrared (FT-IR) spectrometer and differential scanning calorimeter (DSC), the
morphology was observed using scanning electron microscope (SEM), and the characteristics
(particle size and zeta potential) of OCT nanoparticles were also studied. The effect of OCT
nanoparticles on strawberry presevation was carried out using the coating method. Results showed
that an increase in radiation dose resulted in a decrease of chitosan molecular weight. The OCT
with molecular weight of approximately 7.7 kDa was obtained by the synergistic effect of hydrogen
peroxide (5 %, v/v) and gamma ray at dose of 30 kGy. The smaller OCT nanoparticles was obtained
with a lower molecular weight of OCT. The results of FTIR, DSC indicated the success in the
formation of OCT nanoparticles with the particle size approximately 129.9 nm, with the spherical
shape. The application of OCT nanoparticles on strawberry has prolonged the preservation times
approximately 2.5 times higher compared to the control.
Keywords: Nano oligochitosan, Radiation degradation, Synergistic action, Shelf-life extension,
Strawberry.
I. INTRODUCTION
Nowadays, consumption of fresh fruits
and vegetables has attracted increasing
attention due to their high nutritional values.
Nevertheless, the major problem is their
perishable nature resulting many troubles such
as weight loss, fungal decay… For that reason,
the maintainance of their quality for a
longertime (preservation) is necessary. Many
techniques have been studied to extend the
shelf life of fresh produces such as low
temperature,
controlled
and
modified
atmosphere packaging. On the other hand,
there are many studies using chitosan and
oligochitosan
to
preserve
post-harvest
agricultural products. The use of CTS or OCT
to form the physical membrane surrounding the
agricultural products will prevent their weigh
loss. In addition, this physical membrane also
inhibits the bacteria growth due to the
antibacterial properties of CTS or OCT and
inhibition of oxidation of the postharvest
agricultural products [2].
Nanotechnology has been extensively
researched and applied in many fields such as
agriculture, cosmetics, food and medicine [1].
Recently, the CTS nanoparticle dispersion was
used to replace for chitosan solution due to its
©2017 Vietnam Atomic Energy Society and Vietnam Atomic Energy Institute
NGUYEN TRONG HOANH PHONG et al.
higher effect. Particularly, the direct
antimicrobial activity of CTS nanoparticle.
dispersion was 80-100 times longer than that of
chitosan solution.
CTS, 1mg/mL was dissolved in 1% (w/v)
acetic
acid
and
sonicated
for
60
minutes.Simultaneously, TPP solution was
prepared at a concentration of 1 mg/mL. CTSnanoparticles were formed by adding TPP
solution into CTS solution under mechanical
stirring (1000 rpm) at room temperature [10,
11].
The purpose of this investigation is the
shelf-life extension of agricultural products
using nano oligochitosan. Firstly, oligochitosan
was prepared by synergistic effect technique.
Parameters affecting the degradation of CTS
were investigated. OCT nanoparticles were
prepared using ionic gelation method. The
formation of OCT nanoparticles was
demonstrated by the FTIR and DSC methods.
The morphology and particle size of nano CTS
were studied. Preservation efficiency were
evaluated on strawberry.
- Characterization of chitosan and chitosan
nanoparticles
The molecular weight (Mw):
The
molecular weight of degraded chitosan was
determined by LC – 20AD gel permeation
chromatography (GPC) (Shimadzu, Japan)
with detector RID 20A and the columns SB803 HQ from Shodex (Japan). The standards
for calibration of the columns were pullulan
(Mw 12.2 – 100× 103 Da). The eluent was
aqueous solution 0.25M CH3COOH/0.25M
CH3COONa with the flow rate of 0.5 ml min-1
and temperature at 400C [1]. The chitosan
sample concentration was 0.1% (w/v).
II. EXPERIMENTAL
A. Materials and methods
Strawberry collected in the garden. CTS
molecular weight of 101.9 kDa, derived from
crab shell was purchase from Chitosan Viet
Company, (Vietnam), acid acetic and sodium
triphosphate pentabasic (TPP) were purchased
from Sigma-Aldrich. All the other reagents
used in the experiments were of analytical
grade. Distilled water was used for the
experiment.
Fourier transform infrared spectroscopy
(FT-IR) analysis: FT-IR analysis of chitosan
and chitosan nanoparticles were performed
between 400and 4000 cm-1 at 2 cm-1 using
FT/IR 4600 spectrometer (Jasco, Japan).
The degree of deacetylation was
calculated based on IR spectra according to the
following Eq.(1) [5]:
- Preparation of oligochitosan by synergistic
effect technique [8]
Oligochitosan was prepared using the
method reported by Hien et al (2012). Firstly,
chitosan was swelled in 25ml of hydrogen
peroxide solution 5% for 1 hour then irradiated
with Gamma Chamber 5000 irradiator at doses
of 0-30 kGy, dose rate 2.4kGy/h. Determine
the average molecular weight by GPC.
DDA % = 100 – [(A1320 /A1420 – 0.3822)/0.03133]
(1)
Where A1320 and A1420 are absorbances of
chitosan at 1320 cm−1 and 1420 cm−1,
respectively.
Differential
scanning
calorimetry
(DSC): Differential scanning calorimetry
measurements were performed in a DSC-60
(Shimazu, Japan). The DSC curves were
performed under dynamic nitrogen atmosphere
(50–100 mL min−1) using sample mass is 4 mg
- Preparation of chitosan nanoparticles
CTS-TPP nanoparticles were prepared
using the method reporting previously [6].
35
PREPERATION OF NANOCHITOSAN FROM RADIATION DEGRADED OLIGOCHITOSAN FOR …
and heating rates is 20 ◦C min−1. Accurately
weighed samples (±0.1 mg) were placed into a
covered aluminum sample holder with a central
pin hole. An empty sample holder was used as
reference and the runs were performed by
heating the samples from 30 up to 6000C.
version 16.0 by one-way analysis of variance
(ANOVA), assuming confidence level of 95%
(P<0.05) for statistical significance. All
analysis was performed in triplicate.
B. Results and discussion
Investigating the chitosan degradation
effect, we firstly investigated some parameters
of initial chitosan such as deacetylation,
molecular weight Mw and Polydispersity Index
PI. In which, deacylation determined using the
FTIR spectra; Molecular weight Mw indicated
average molecular weight of CTS and
determined using GPC; PI indicated
polydispersity index of CTS and determined
using GPC.
Particle size and zeta potential: The
measurements of particle size and zeta
potential of nanoparticles were performed
using a Nano Particar ZS-100 (HORIBA,
Japan) on the basis of Dynamic light scattering
(DLS) techniques at an angel of 90o.
- Coating process
The fruits were coated by dipping
method. The experiment was arranged in a
completely randomized design and consisted of
1 coating in 2 minutes and 4 storage times (1,
2, 4 and 7 days), with three replicates. The
experimental unit consisted of ten strawberry.
Coating was followed with cool air drying (2030˚C) then stored at room temperature. To
evaluate the changes in quality of the coated
samples, the criteria of weight loss and fungal
decay was studied at interval time points.
- IR spectral analysis
Weight loss: weight loss was calculated
according to the weight of each sample before
and after storage and expressed as the
percentage weight loss compared to the initial
weight.
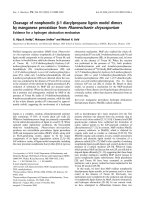
Fig.1. IR spectrum of chitosan.
Fungal decay: Fungal decay was
visually inspected during the storage period.
Results were expressed as the percentage of
fruits infected. The fungal decay can be
obtained from the Eq. (2).
The bands 3290 cm–1 is determined by
υ(OH) overlapped on υs(N–H). The band from
2867 cm–1 is determined by υ(–C=O) of the
amide group CONHR of the chitosan. The
bands 1568 cm–1 (chitosan) are determined by
υ(–C=O) of the proton amide group, and
δ(NH3) is determined by the proton amide
group. The bands 1417 cm–1 is determined by
δ(OH). The bands 1372cm–1 chitosan are
determined by δ(–CH3). The bands 1318 cm–1
(2)
- Statistical analysis
Statistical analysis of data was
performed using SPSS software package
36
NGUYEN TRONG HOANH PHONG et al.
is determined by υs(-CH3) third amide ω (–
CH2) + OH deformation in plane. The bands
1152 cm–1 is determined by υas(C=O) oxygen
bridges resulting from the deacetylation of the
chitosan. The bands 1060 cm–1 is determined
by υ(C=O) by the bindings C–O–H, C–O–C
and CH2CO. The bands 892 cm–1 is
determined
by
ω(C–H)
from
the
polysaccharide’s structure (Fig.1).
Mw, kDa
110
100
90
80
70
60
50
40
30
20
10
0
The degree of deacetylation was
calculated according to the following equation
0
DDA % = 100 – [(A1320 /A1420 – 0.3822)/0.03133]
The result shows that, DDA of initial
chitosan is 82.64%.
5
10
15 20 25
Dose, kGy
30
35
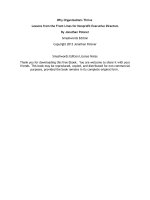
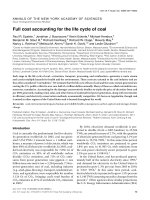
Fig.3. The molecular weight of chitosan versus
dose.
- GPC analysis.
The effect of absorbed (irradiation) dose
on the radiation cleavage yield of chitosan
swelled in hydroperoxide solution is shown in
Figure 3. The results show that the average
molecular weight (Mw) of chitosan decreases
with radiation dose. Particularly, Mw is
approximately of 12.1 kDa and 7.7 kDa at
absorbed dose of 25 kGy and 30 kGy,
respectively.
- Effect of CTS/TPP mass ratio onto chitosan
nanoparticle size
In this study, we investigated the effect
of CTS/TPP ratio (w/w) onto the particle size
of nano chitosan with Mw ~101 kDa at initial
concentration 0.1%. The results are shown in
Figure 4.
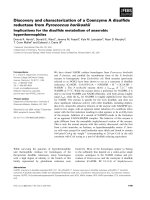
Fig.2. GPC chromatogram of initial chitosan.
The molecular weight (M w) of degraded
chitosan was determined by GPC with
pullulan as a standard. The chromatogram
shown that molecular weight (Mw) of initial
chitosan is 101.9 kDa, Mn is 54.7 and PI is
1.86 (Figure 2).
The concentrations of CTS and TPP
solutions and ratio of CTS to TPP by weight
have an important effect on the formed CTS
nanoparticles. As the TPP concentration was
increased, the reactive product changed in
three stages [13]
- The effect of irradiation conditions on the
degradation
of
chitosan
swelled
in
hydroperoxide
Stage 1:When the TPP concentration is small,
the mixture was transparent.
37
PREPERATION OF NANOCHITOSAN FROM RADIATION DEGRADED OLIGOCHITOSAN FOR …
Based on the results of Effect of
CTS/TPP
mass
ratio
onto
chitosan
nanoparticle size, CTS:TPP ratio of 5:2 (w/w)
was chosen to investigate the effect of chitosan
molecular weights on characteristics of the
formed nanoparticles. Effect of Mw chitosan on
chitosan nanoparticle size and zeta potential
shown in Fig.5. The smaller particle size and
higher zeta potential were achieved when the
lower molecular weight of CTS was used. It is
because the smaller particle size led to the
higher charge density resulted in the higher
value of zeta potential.
Stage 3: When the TPP concentration is too
high the precipitation was happened due to the
formation of very large CTS particles or the
clump of CTS particles.
1400
1200
Partical size, nm
1000
800
600
400
0
0
0.05
0.1
TPP concentration, %
350
70
300
60
250
50
200
40
150
30
100
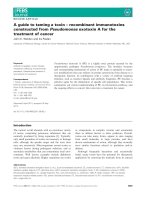
Fig.4. The particle size of nanochitosan versus TPP
concentration.
20
Particle size
Zeta potential
50
10
0
When TPP concentration was very low,
the number of phosphate groups was not
enough to produce effective electrostatic
attraction with the amino groups of CTS [12];
therefore, the solution is still transparent
because there was not the formation of CTS
nanoparticle. As the TPP content was increased
gradually, the solution became opaque and
when the CTS/TPP mass ratio reached to ratio
of 5:2 (w/w), particle size of CTS nanoparticles
was about 349 nm. Thereafter, when TPP
concentration was very high, the larger
particles were formed and the precipitation was
happened probably due to the coagulation of
the excessive CTS nanoparticles.
- Effect of Mw chitosan on
nanoparticle size and zeta potential
80
Particle size, nm
200
400
Zeta potential, mV
Stage 2: As the TPP concentration increases
gradually, the mixture became opaque due to
the formation of CTS nanoparticles.
0
0
20
40
60
Mw, kDa
80
100
Fig.5. Effect of Mw chitosan onto chitosan
nanoparticle size and zeta potetial
- Characterization of nano chitosan
IR: Figure 6 shows the IR absorption
spectra of chitosan nanoparticle (a); chitosan
(b) and TPP (c)
It can be seen that, two spectra, 6a and
6b, had similar peaks, locations, and
intensities. In Figure 6b, at 1584 cm-1, there
was an -NH2 absorption peak. While in Figure
6a, besides the same absorption peak found in
Figure 6b, it can be observed that an –NH2
stretch vibration absorption peak drifted to a
low wave number in 6a at 1534 cm-1, this
indicated that the phosphate group linked to the
chitosan
38
NGUYEN TRONG HOANH PHONG et al.
amino group and formed strong intermolecular
and intermolecular hydrogen bond.
linkage. The decomposition of chitosan
nanoparticles is expected to happen well above
6000C. Decreased crystallinity indicates change
in solid state structure of chitosan due to
crosslinking.
FE-SEM, particle size distribution and zeta
potential of OCT nanoparticles
The results of the FE-SEM image of the
nano chitosan shown in Figure 8 shown that
the morphology of OCT nanoparticles is
spherical and relatively uniform.
Fig.6. IR spectrum of (a) chitosan nanoparticles; (b)
chitosan and (c)TPP.
DSC: Fig.7. shows DSC curves of (a) chitosan
and (b) chitosan nanoparticles.
Fig.8. FE-SEM image of the OCT nanoparticles
Fig.7. DSC curves of (a) chitosan and (b) chitosan
nanoparticles.
Figure 7a shows a wide endothermic
peak at 900C which is attributed to the
elimination of absorbed water and a sharp
exothermic peak at 3240C which is due to the
decomposition of chitosan chains. The DSC
curve of chitosan nanoparticles fig. 7b has a
wide enothermic peak below 900C which is due
to the removal of absorbed water and a sharp
endothermic peak at 2680C associated with the
breakage of chitosan phosphoric acid cross
Fig.9. Particle size distribution of OCT
nanoparticles
39
PREPERATION OF NANOCHITOSAN FROM RADIATION DEGRADED OLIGOCHITOSAN FOR …
the Fig. 9 also show the particle size of OCT
nanopartices is very uniform due to the narrow
distribution of the peak.
- Shelf-life extension of strawberry using OCT
nanoparticles
The fruits were randomly harvested at
the commercial ripening stage and screened for
uniformity and the absence of physical defects
or decay. Subsequently, the strawberry fruits
were randomly distributed into four groups
prior to treatment with three replicates. Control
group were dipping in water, TPP group were
dipping in 200 ppm TPP solution, OCT group
were dipping in 500 ppm OCT solution and
OCT nanoparticle group were dipping in 500
ppm nano oligochitosan solution with the
particle size approximately 129.9nm. The
results are shown in table. I.
Fig.10. Zeta potential of OCT nanoparticles
129.9 nm
In addition, as shown in Fig. 9 and Fig.
10, the particle size and zeta potential of the
OCT nanoparticles approximately 129.9 nm
and +67.4 mV, respectively. On the other hand,
Table I. Weight loss and fungal decay of strawberry versus time.
Days
Weight loss
(%)
Fungal decay
(%)
Control
TPP
b
9.36±0.09
OCT
b
2.23±0.14
OCT nanoparticle
a
2.10±0.15a
1
8.83±0.24
2
13.06±0.43b
15.30±0.23c
3.46±0.14ab
3.00±0.15a
4
7
1
2
4
7
22.40±0.73c
25.60±0.46c
0.00±0.00a
1.66±1.66a
8.33±3.33b
11.66±1.66c
25.80±0.20d
28.73±0.49d
0.00±0.00a
0.00±0.00a
6.66±1.66ab
10.00±2.88b
7.60±0.34b
11.93±0.34b
0.00±0.00a
0.00±0.00a
1.66±1.66ab
5.00±2.88ab
5.63±0.14a
9.63±0.26a
0.00±0.00a
0.00±0.00a
0.00±0.00a
1.66±1.66a
Different letters in the same raw indicate significant difference (P<0.05)
Fruit weight loss is mainly associated
with respiration and moisture evaporation
through the skin. The thin skin of strawberry
makes them susceptible to rapid water loss,
resulting in shrivelling and deterioration
making fruit surface wounded. Strawberry
preservation capacity of 500 ppm nano
oligochitosan solution with particle size of
129.9 nm at room temperature is presented in
Table I. The results show that in the control
sample, the weight loss and the fungal decay of
strawberry after 7 days was very high. Weight
loss is 25.6% and fungal decay is 11.66%. This
also occurred similar to the sample coating
with TPP solution. With sample coating by
OCT after 7 days, weight loss is 11.93% but
after 4 days the fungal decay were happend.
With sample coating by CTS nanoparticle
129.9nm after 7 days, weight loss of
strawberry is 9.63% and the fungal decay is
very low about 1.66%. In fact, nano chitosan
coating acts as a semi-permeable barrier to
40
NGUYEN TRONG HOANH PHONG et al.
with chitin and chitosan characterization".
Polymer, 42, 3569-3580,2001.
water, resulting in procrastination of water
transfer and more control over weight loss.
6. Kuo-Shien Huang, Yea-Ru Sheu, In-Chun Chao
"Preparation and Properties of Nanochitosan".
Polymer-Plastics Technology and Engineering,
48 (12), 1239-1243, 2009.
III. CONCLUSIONS
Oligochitosan
was
prepeared
by
synergistic effect technique with gamma ray and
hydro peroxyt 5%. Molecular weight of
oligochitosan is 7.7 kDa. Molecular weight of
chitosan decreases as the dose increases. Nano
oligochitosan particle size 129.9 nm was
prepared from oligochitosan by ionic gelation
technique with TPP. The lower the CTS
molecular weight, the smaller the particles
derived from the chitosan. More valuable effect
of chitosan nanoparticle was that the chitosan
concentration of 500 ppm could significantly
affect the qualities including fungal decay, water
loss. Nano-chitosan coating delayed softening
and ripening, changes in weight loss, fungal
decay. Chitosan nano-particle has high
efficiency in extending the shelf life of
strawberry after 7 days at room temperature.
7. M.S.
Sivakami, Thandapani
Gomathib,
Jayachandran Venkatesan, Hee-Seok Jeong,
Se-Kwon Kim, P.N. Sudha"Preparation and
characterization of nanochitosan for treatment
wastewaters".
International
Journal
of
Biological Macromolecules, 57, 204-212, 2013.
8. Nguyen Quoc Hien, Dang Van Phu, Nguyen
Ngoc
Duy, Nguyen
Thi
Kim
Lan
"Degradation Of Chitosan In Solution By
Gamma Irradiation In The Presence Of
Hydrogen Peroxide". Carbohydrate Polymers,
87, 935-938, 2012.
9.
10. R. Stoica, R. Şomoghi, R.M. Ion (2013)
"Preparation Of Chitosan – Tripolyphosphate
Nanoparticles For The Encapsulation Of
Polyphenols Extracted From Rose Hips ".
Digest Journal of Nanomaterials and
Biostructures, 8 (3), 955-963, 2013.
REFERENCES
1.
2.
A C Wu, W A Bough, E C Conrad, K E Alden
"Determination
of
molecular-weight
distribution of chitosan by high-performance
liquid
chromatography".
Journal
Chromatography, 128 (1), 87-99,1976.
11. Vasco José Dias Duarte Silva "Preparation and
characterization of chitosan nanoparticles for
gene delivery", Instituto Superior Técnico Alameda, 2013.
Duan Jianglian, Zhang Shaoying "Application
of Chitosan Based Coating in Fruit and
Vegetable Preservation: A Review". J Food
Process Technol, 4 (5), 2013.
3.
Ana Grenha "Chitosan nanoparticles: a survey
of preparation methods". Journal of Drug
Targeting, 20 (4), 291-300, 2012.
4.
Hassan M. Ibrahim, Manal K. El-Bisi, Ghada
M. Taha, Ekhlas A. El-Alf "Chitosan
nanoparticles loaded antibiotics as drug
delivery biomaterial". Journal of Applied
Pharmaceutical Science, 5 (10), 85-90, 2015.
5.
J. Brugnerotto, J. Lizardi, F.M. Goycoolea, W.
Argu Èelles-Monal, J. Desbrie Áres, M.
Rinaudo "An infrared investigation in relation
Prem Lal Kashyap, Xu Xiang, Patricia Heiden
"Chitosan nanoparticle based delivery systems
for sustainable agriculture". International
Journal of Biological Macromolecules, 77, 3651, 2015.
12. Hui Liu, Changyou Gao, "Preparation and
properties of ionically cross-linked chitosan
nanoparticles".
Polymers
Advanced
Technologies, 20, 613-619, 2009
13. Kuo-Shien Huang, Yea-Ru Sheu, In-Chun
Chao,
"Preparation and Properties of
Nanochitosan". Polymer-Plastics Technology
and Engineering, 48 (12), 1239-1243, 2009.
41